. 2021 Oct;17(10):3048-3067.
doi: 10.1080/15548627.2020.1851897. Epub 2020 Dec 7.

Autophagy alleviates hypoxia-induced blood-brain barrier injury via regulation of CLDN5 (claudin 5)

Affiliations

Autophagy alleviates hypoxia-induced blood-brain barrier injury via regulation of CLDN5 (claudin 5)

Zhenguo Yang et al. Autophagy. 2021 Oct.

Abstract

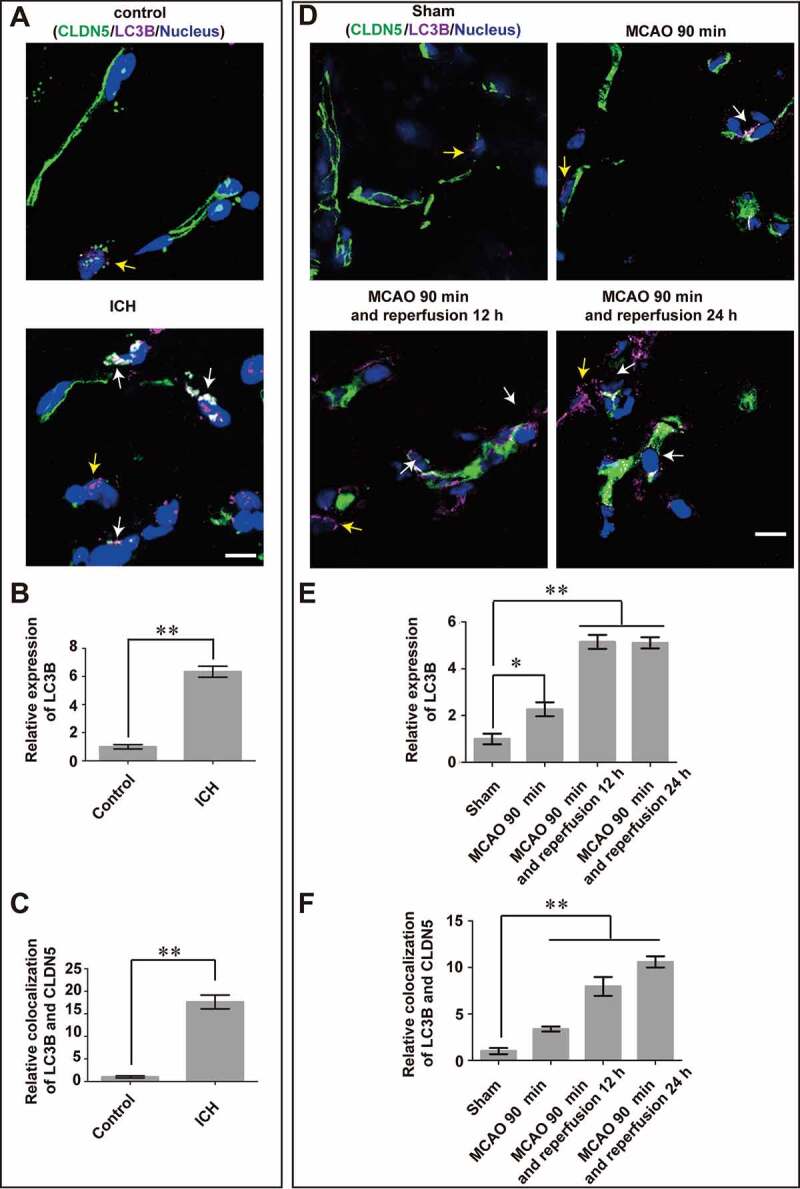
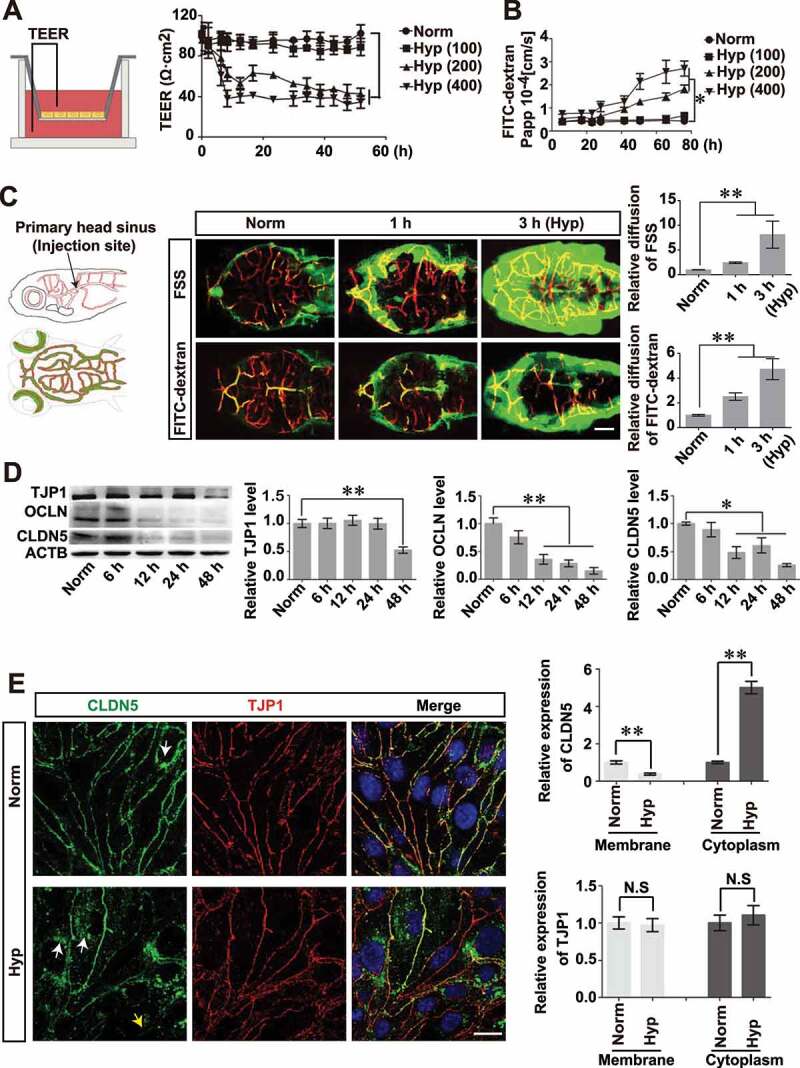
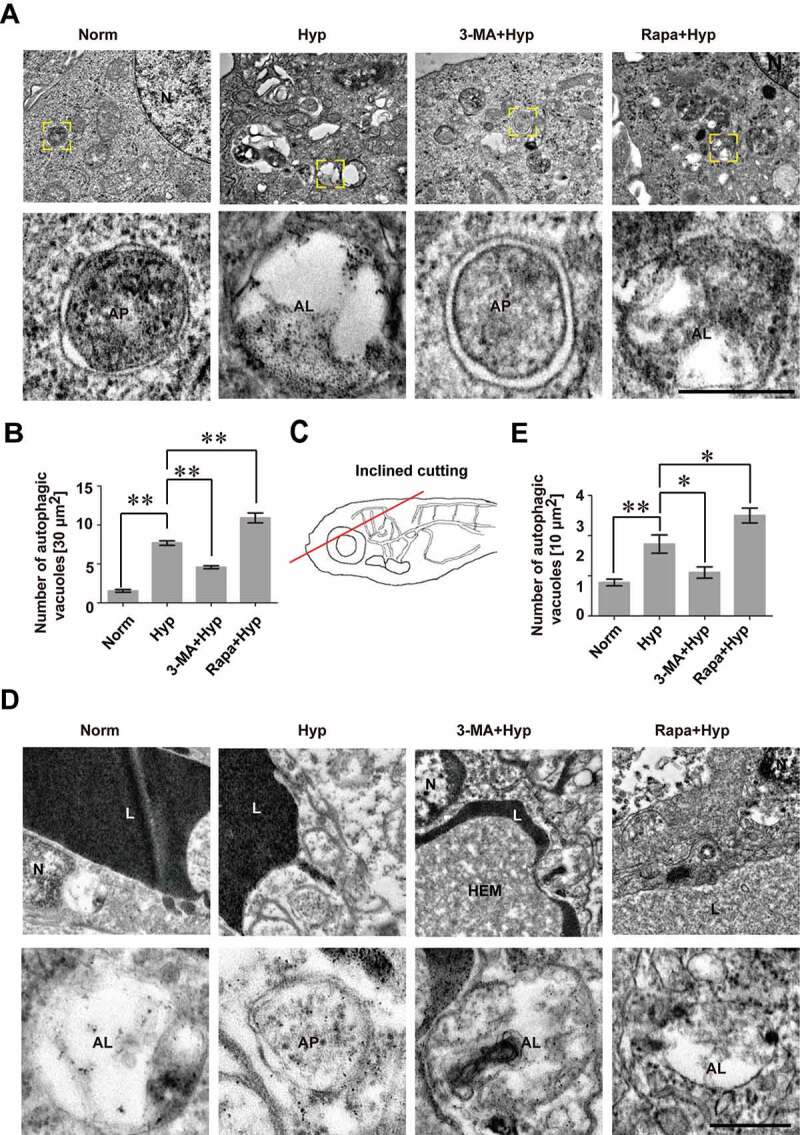
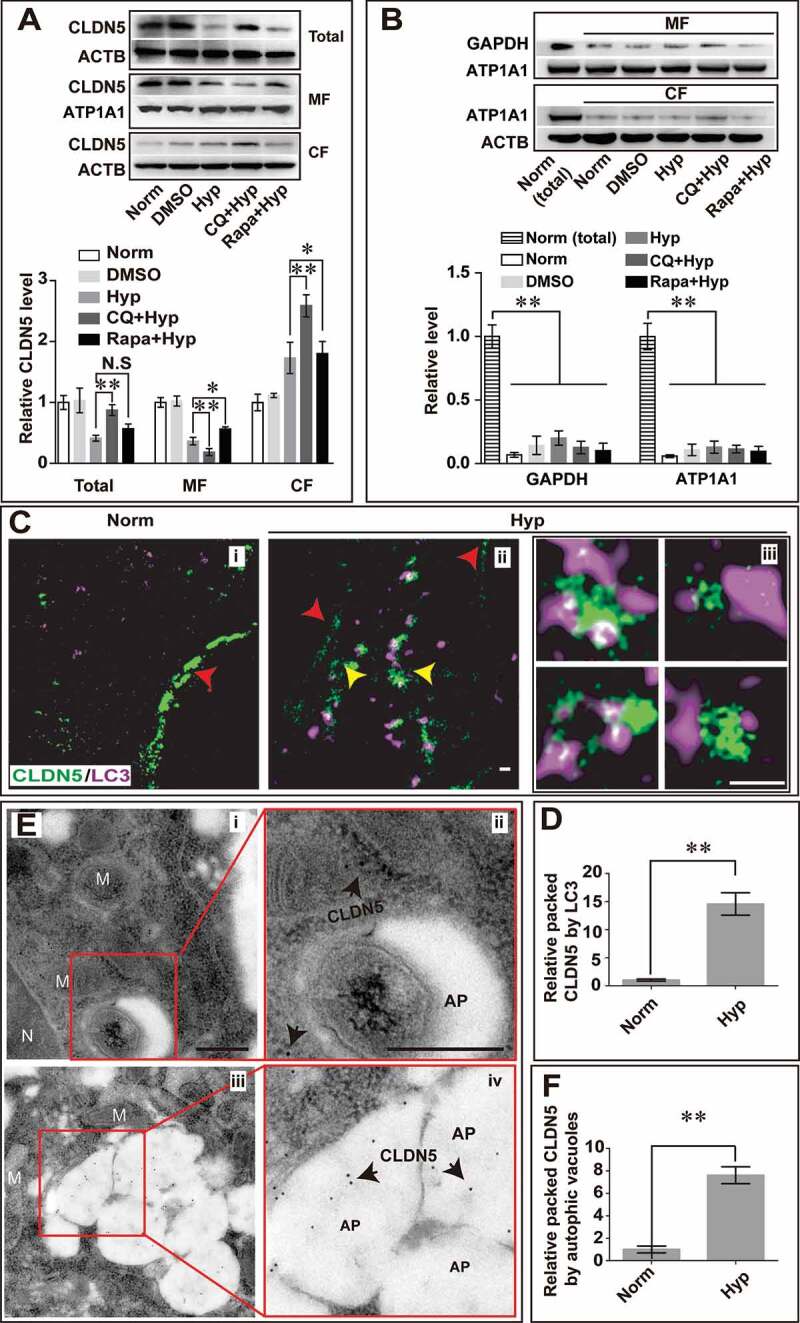
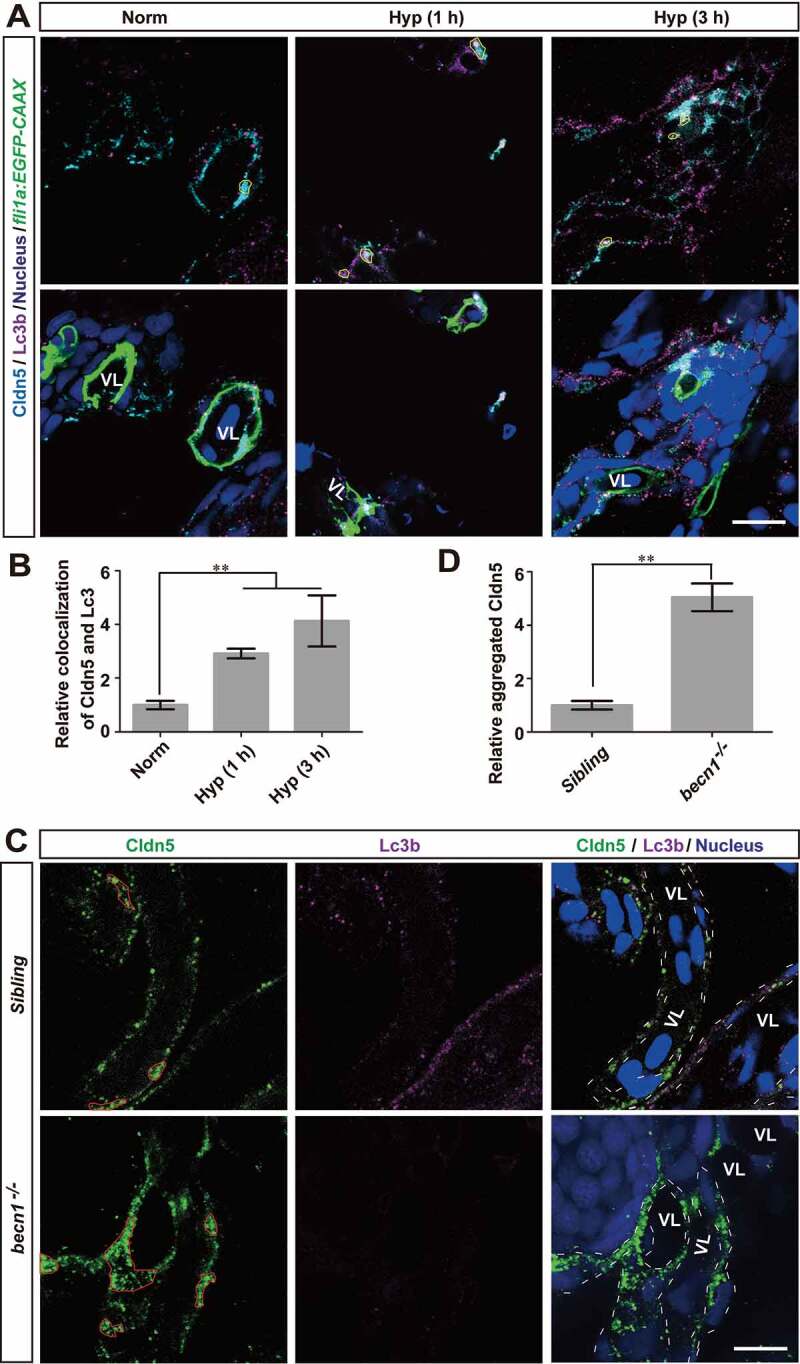
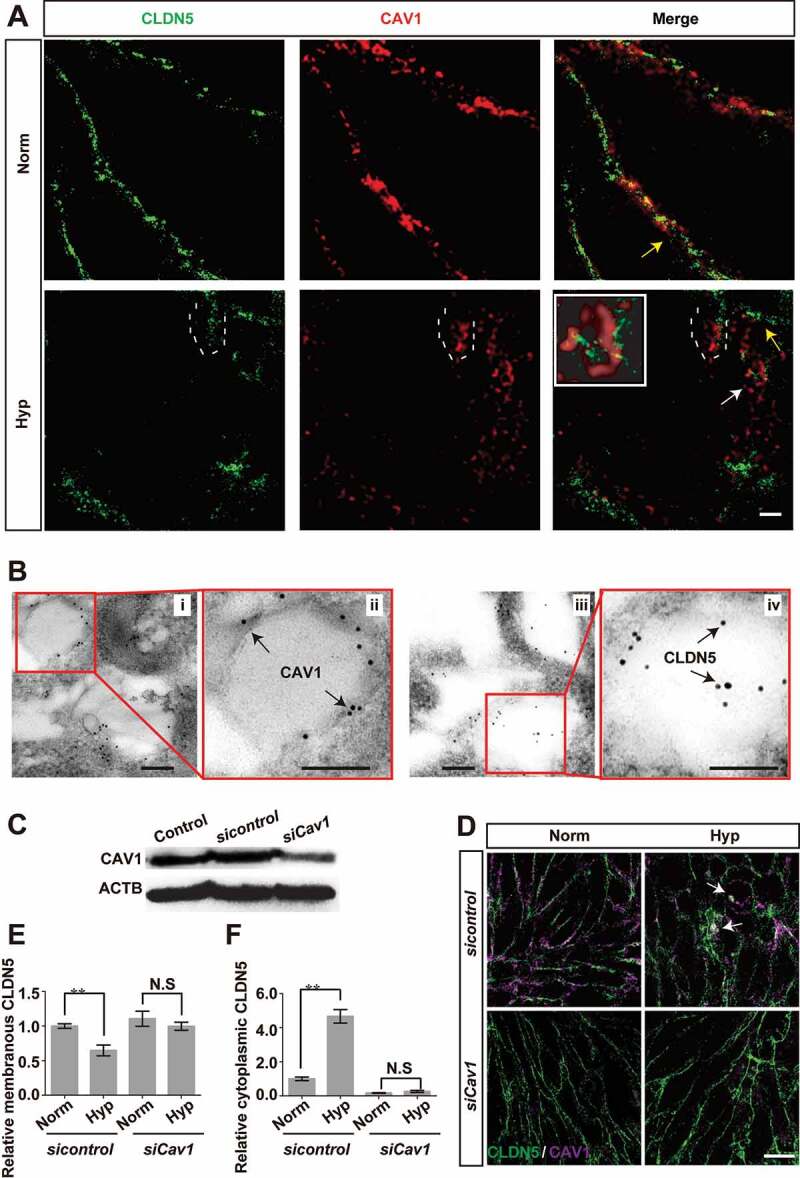
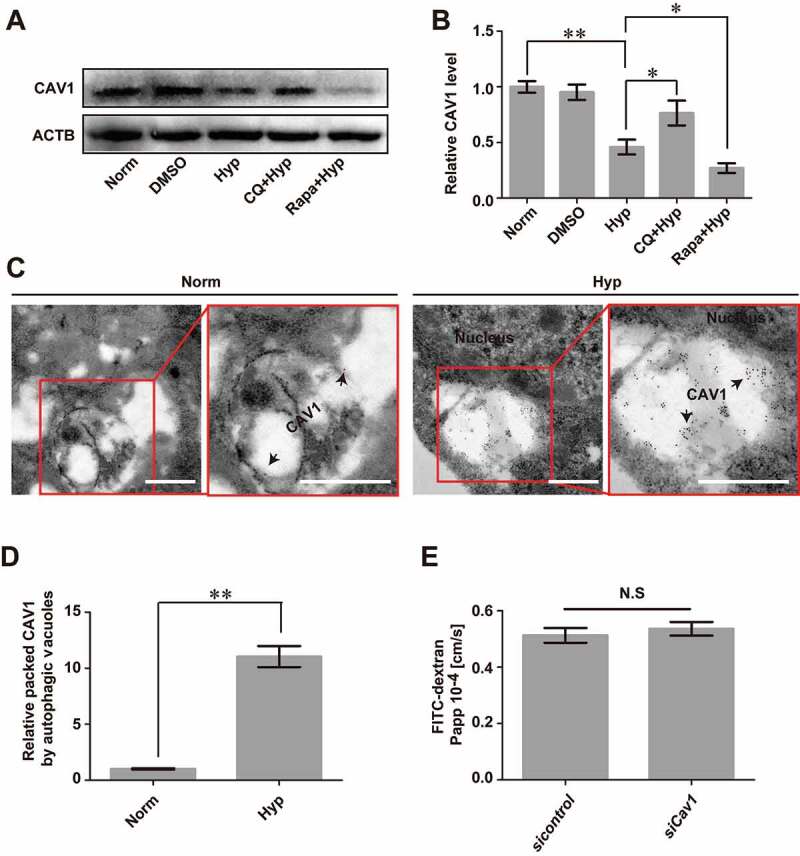
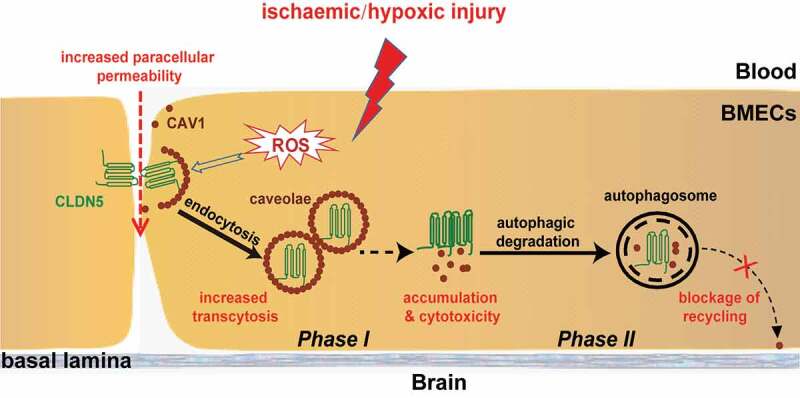
Blood-brain barrier (BBB) disruption is a key event in triggering secondary damage to the central nervous system (CNS) under stroke, and is frequently associated with abnormal macroautophagy/autophagy in brain microvascular endothelial cells (BMECs). However, the underlying mechanism of autophagy in maintaining BBB integrity remains unclear. Here we report that in BMECs of patients suffering stroke, CLDN5 (claudin 5) abnormally aggregates in the cytosol accompanied by autophagy activation. In vivo zebrafish and in vitro cell studies reveal that BBB breakdown is partially caused by CAV1 (caveolin 1)-mediated redistribution of membranous CLDN5 into the cytosol under hypoxia. Meanwhile, autophagy is activated and contributes mainly to the degradation of CAV1 and aggregated CLDN5 in the cytosol of BMECs, therefore alleviating BBB breakdown. Blockage of autophagy by genetic methods or chemicals aggravates cytosolic aggregation of CLDN5, resulting in severer BBB impairment. These data demonstrate that autophagy functions in the protection of BBB integrity by regulating CLDN5 redistribution and provide a potential therapeutic strategy for BBB disorder-related cerebrovascular disease.Abbreviations: BBB: blood-brain barrier; BECN1: beclin 1; BMEC: brain microvascular endothelial cell; CAV1: caveolin 1; CCA: common carotid artery; CLDN5: claudin 5; CNS: central nervous system; CQ: chloroquine; HIF1A: hypoxia inducible factor 1 subunit alpha; MCAO: middle cerebral artery occlusion-reperfusion; OCLN: occludin; ROS: reactive oxygen species; STED: stimulated emission depletion; TEER: trans-endothelial electrical resistance; TEM: transmission electron microscopy; TJ: tight junction; TJP1: tight junction protein 1; UPS: ubiquitin-proteasome system.

Keywords: Autophagy; blood-brain barrier; claudin 5; hypoxia; zebrafish.


Conflict of interest statement

The authors declare no conflict of interests.

Figures

Figure 1.
Figure 1.
Autophagy correlates with the redistribution of endothelial CLDN5 in the stroke-induced BBB impairment. The expression of LC3B (purple) and the localization of CLDN5 (green) in cerebral endothelial cells was observed in brain tissues from patients with ICH (A-C) and male mice with MCAO/R (D-F). CLDN5 in brain microvascular endothelial cells (BMECs) from patients with ICH (n = 14) or mice after MCAO aggregated in the cytosol, especially in the perinuclear space (yellow arrows), which partly colocalized with the upregulated LC3B (white arrows). (B and C) Quantitative integrated optical density (IOD) of total LC3B, and colocalization of LC3B and CLDN5 in the cytosol of BMECs. P value indicates two-tailed unpaired t test. (E and F) Quantitative IOD of total LC3B, and colocalization of LC3B and CLDN5 in the cytosol of mice BMECs post MCAO/R treatment. Control: brain tissues from non-stroke patients (n = 12). LC3: microtubule-associated protein 1 light chain 3. ICH: intracranial hemorrhage. MCAO/R: middle cerebral artery occlusion/reperfusion. Sample sizes: sham, n = 12; MCAO, n = 9; MCAO and 12 h reperfusion, n = 8; MCAO and 24 h reperfusion, n = 8. Data were presented as mean ± SEM. P value indicates one-way ANOVA with Dunnett’s multiple comparisons test. *, P < 0.05; **, P < 0.01. Scale bars: 10 μm
Figure 2.
Figure 2.
Hypoxia treatment results in impairment of BBB. (A and B) After the formation of a monolayer of bEnd.3 on transwell membrane, the barrier function was reduced under CoCl2-induced hypoxia condition, as evaluated by the TEER and the infiltrated FITC-dextran (10 kDa) measurement. Hyp (100), Hyp (200) and Hyp (400) indicate hypoxia induction by CoCl2 with a concentration of 100, 200, 400 μmol/L, respectively. (C) Cerebral microangiograph on 5 dpf zebrafish to evaluate the BBB permeability after hypoxia induction. After injection of FSS (735 Da) or FITC-dextran (70 kDa) into the primary head sinus (schematic diagrams on the left), reconstructed 3-dimensional cerebrovascular images showed severe infiltration of the dye penetrant through BBB after N2-induced hypoxic treatment for 1 or 3 h (middle and right). Tg(kdrl:ras-cherry)s916 transgenic zebrafish in which vascular endothelial cells were labeled by cherry fluorescent protein was used. n = 12 fishes per group. Scale bar: 100 μm. (D) A reduced expression of TJ proteins including TJP1, OCLN and CLDN5 was detected in monolayer bEnd.3 cells after 200 μmol/L CoCl2 induction with a time-dependent manner (0, 6, 12, 24 and 48 h). n = 3 repeats. P value indicates one-way ANOVA with Dunnett’s multiple comparisons test. (E) TJ proteins, especially CLDN5, delocalized from membrane (yellow arrow) and aggregated in the cytosol (white arrows) of bEnd.3 after 200 μmol/L CoCl2-induced hypoxia treatment for 12 h. The integrated optical density (IOD) of the cytosolic proteins was quantified. n = 3. P value indicates two-tailed unpaired t test. Scale bar: 10 μm. TEER: trans-endothelial electrical resistance; Norm: normoxia; Hyp: hypoxia; FSS: fluorescein sodium salt; FITC-dextran: fluorescein-labeled dextran; Papp: apparent permeability coefficient. Data were presented as mean ± SEM. *, P < 0.05; **, P < 0.01
Figure 3.
Figure 3.
An increase of autophagosomes and autolysosomes in cerebrovascular endothelial cells after hypoxia induction. (A and B) Hypoxia induction caused an increase of autophagosomes and autolysosomes while blockage of autophagy by 3-MA inhibited the formation of autophagosomes in bEnd.3 cells (yellow arrowheads), as imaged by TEM. Conversely, activation of autophagy by Rapa treatment increased the number of autophagosomes (yellow arrowheads). The lower panel show high magnification of yellow square-labeled area in the up panel. Autophagic vacuoles were counted quantified from a 30 μm2-sized region per cell. n = 5. (C) BMECs of zebrafish embryos were scanned by TEM after cross section of the brain region (red line in the schematic diagram) and autophagosomes in BMECs of zebrafish post 1 h-hypoxia treatment were captured (D). The lower panel show high magnification scans of the area labeled by yellow squares in the upper panel. (E) Hypoxia treatment caused an increase of autophagosomes in BMECs of zebrafish while 3-MA inhibits the formation of autophagic vacuoles. In contrast, Rapa treatment increased the number of autophagosomes in hypoxia-induced zebrafish BMECs. Autophagic vacuoles were quantified in 10 μm2-sized region per endothelial cell. Yellow arrowheads indicate autophagosomes. n = 4 fishes per group. Data were presented as mean±SEM. P value indicates one-way ANOVA with Dunnett’s multiple comparisons test. *, P < 0.05; **, P < 0.01. Norm: normoxia; Hyp: hypoxia; CoCl2: 200 μmol/L, treated for 12 h; CQ: Chloroquine, 30 μmol/L; 3-MA: 3-methyladenine, 10 mmol/L; Rapa: rapamycin, 50 nmol/L; L: cerebrovascular lumen; AP, autophagosome; AL, autolysosome; HEM, hematocyte. Scale bars: 1 μm
Figure 4.
Figure 4.
The protective role of autophagy on maintaining BBB function. (A and B) The TEER value and the infiltration of FITC-dextran (10 kDa) across monolayer of bEnd.3 cells were measured for analyzing the role of autophagy on endothelial barrier function. Blockage of hypoxia-induced autophagy by 3-MA increased the permeability through the monolayer endothelial cells while Rapa treatment partly restored the tightness of the endothelial barrier caused by hypoxia for 12 h or 24 h induction respectively. (C and D) Blockage of autophagy by 3-MA aggravated hypoxia (evoked by N2 treatment for 1 h)-induced BBB breakdown in zebrafish larvae. A severer infiltration of dye penetrant (FSS, 735 Da or FITC-dextran, 70 kDa) through cerebrovascular wall of endothelial specific transgenic Tg(kdrl:ras-cherry)s916 zebrafish at 5 dpf in 3-MA-treated group was observed. In contrast, Rapa treatment partly restored the leakage of zebrafish BBB caused by hypoxia induction. n = 4 fishes for each group. (E and F) Hypoxia treatment caused early and late stage apoptosis in bEnd.3 cells. 3-MA treatment significantly enhanced this effect while Rapa induction had a counteraction effect of hypoxia-induced autophagy on apoptosis changes. Norm: normoxia; Hyp: hypoxia; 3-MA: 3-methyladenine, 10 mmol/L; Rapa: rapamycin, 50 nmol/L; FSS: fluorescein sodium salt; FITC-dextran: Fluorescein-labeled dextran; Papp: apparent permeability coefficient; PI: propidium iodide. Data were expressed as mean ± SEM, n 4. P value indicates one-way ANOVA with Dunnett’s multiple comparisons test. *, P < 0.05; **, P < 0.01. Scale bar: 100 μm
Figure 5.
Figure 5.
Autophagy mediates the degradation of endothelial CLDN5 in the cytosol. (A) After hypoxia treatment, the membranous, cytosolic and total CLDN5 in bEnd.3 cell was quantified by western blot analyses. Blockage of autophagy by CQ caused an accumulation of CLDN5 in the cytosol while Rapa-induction partly retarded the redistribution of membranous CLDN5. (B) Western blotting analyses showed a high protein purity of cytosolic or membranous fractions under different induction conditions. GAPDH was used as cytosolic reference marker and ATP1A1/Na,K-ATPase was used as membranous reference marker. n = 3 repeats. Data were presented as mean ± SEM. P value indicates one-way ANOVA with Dunnett’s multiple comparisons test. (C and D) Stimulated emission depletion (STED) microscope images showed that after the hypoxia induction, membranous CLDN5 (red arrowheads in i and ii) delocalized, aggregated and was surrounded by LC3 in the cytosol (yellow arrowheads in ii). iii are high magnification images of the cytosolic proteins in ii. The numbers of LC3-surrounded CLDN5 clusters per image were counted and quantified. (E and F) Immuno-electronmicroscope (IEM) images showed CLDN5 (black arrows) was packaged in autophagosome-like vesicles in bEnd.3 cells after CoCl2-induced hypoxia treatment. i and ii, normoxia control; iii and iv, hypoxia-treated group. ii and iv are high magnification scans of the red line-marked regions in i and iii respectively. The numbers of gold particles in autophagosome-like vesicles were quantified. P value indicates two-tailed unpaired t test. MF: membranous fraction; CF: cytosolic fraction. M, mitochondria; N, nucleus, AP, autophagosome; CQ: Chloroquine, 30 μmol/L; Rapa: rapamycin, 50 nmol/L. Data were presented as mean ± SEM. n = 3. *, P < 0.05; **, P < 0.01. N.S: no significance. Scale bars: 500 nm
Figure 6.
Figure 6.
Autophagy suppresses the redistribution of membranous Cldn5 in zebrafish cerebrovascular endothelial cells. (A and B) Colocalization of Lc3b and Cldn5 (yellow circles) was observed in the cytosol of zebrafish BMECs after N2-induced hypoxia for 1 or 3 h respectively. Endothelial eGFP-specific transgenic Tg(fli1a:EGFP-CAAX) zebrafish (5 dpf) were used. The integrated optical density (IOD) of colocalized Lc3b and Cldn5 in the cytosol of zebrafish cerebrovascular endothelial cells (in yellow circles) was quantified. n = 4 fishes per group. P value indicates one-way ANOVA with Dunnett’s multiple comparisons test. (C and D) Autophagy deficiency caused a cytosolic accumulation of Cldn5 (red circles) in the BMECs of homozygous becn1 mutated zebrafish, especially in the perinuclear space, after N2-induced hypoxia treatment for 1 h. IOD of colocalized Lc3b and Cldn5 in the cytosol of zebrafish cerebrovascular endothelial cells (in red circles) was quantified. n = 4 fishes for each group. P value indicates two-tailed unpaired t test. **, P < 0.01. Norm: normoxia; Hyp: hypoxia; VL: cerebrovascular lumen. LC3: microtubule-associated protein 1 light chain 3; 3-MA: 3-methyladenine, 10 mmol/L; CQ: chloroquine, 30 μmol/L; Rapa: rapamycin, 50 nmol/L. Yellow circles indicate the colocalization of LC3 and Cldn5 in the cytosol of BMECs and white dotted lines indicate the boundary of BMECs of zebrafish. Scale bars: 5 μm
Figure 7.
Figure 7.
Caveolae-mediated endocytosis is involved in the redistribution of endothelial CLDN5 after hypoxia induction. (A) The localization of CLDN5 and CAV1 in bEnd.3 cells under CoCl2-induced hypoxia treatment was imaged by stimulated emission depletion (STED) microscope. White dotted lines-labeled region showed a surrounding of CLDN5 by CAV1 beneath the endothelial cell membrane (yellow arrows). Caveolae-liked vesicle packaging the aggregated CLDN5 (white arrow) was captured and the higher magnification image was shown in the white square. Scale bar: 1 μm. (B) CAV1 and CLDN5 in bEnd.3 cells under CoCl2-induced hypoxia treatment was imaged by immuno-electronmicroscope (IEM). Immunogold-labeled CAV1 was captured and found on the membrane of caveolae-liked vesicle while immunogold-labeled CLDN5 localized inside of the caveolae-liked vesicle. i and ii, normoxia control; iii and iv, hypoxia-treated group. ii and iv are high magnification scans of the red line-marked regions in i and iii respectively. Scale bars: 100 nm. (C-F) After knock-down of Cav1, the redistribution of membranous CLDN5 into the cytosol of bEnd.3 cells (white arrows in D) was suppressed under CoCl2-induced hypoxic conditions. The integrated optical density (IOD) of membranous or cytosolic CLDN5 was quantified. CoCl2: 200 μmol/L, treated for 12 h; Norm: normoxia; Hyp: hypoxia. sicontrol: monolayer of bEnd.3 was transiently transfected with scrambled negative control siRNA. siCav1: monolayer of bEnd.3 was transiently transfected with Cav1 siRNA. n = 3 images for each experiment. Data were presented as mean ± SEM. P value indicates one-way ANOVA with Dunnett’s multiple comparisons test. **, P < 0.01. N.S: no significance. Scale bar: 10 μm
Figure 8.
Figure 8.
Autophagy mediates the degradation of endocytosed CAV1 under hypoxia. (A and B) CoCl2-induced hypoxia caused degradation of CAV1 in monolayer bEnd.3 cells. Blocking of autophagy by CQ significantly inhibited the degradation of CAV1 while enhancing of autophagy by Rapa promoted its degradation. n = 5. P value indicates one-way ANOVA with Dunnett’s multiple comparisons test. (C and D) Immunogold-labeled CAV1 (black arrows) was imaged by immuno-electronmicroscope (IEM) and was found in autophagosome-like vesicles of bEnd.3 cells after CoCl2-induced hypoxia treatment. The right panel is a high magnification scan of the red line-marked region in the left panel. The numbers of gold particles which represent packaged CAV1 in caveolae per image were counted for quantification analyses. n = 6 images analyzed. Scale bars: 200 nm. (E) knock-down of Cav1 itself in bEnd.3 cells showed no effect on the paracellular permeability of cell monolayer under normoxic condition. n = 3. CoCl2: 200 μmol/L, treated for 12 h. Norm: normoxia; Hyp: hypoxia; sicontrol: monolayer of bEnd.3 was transiently transfected with scrambled negative control siRNA. siCav1: monolayer of bEnd.3 was transiently transfected with Cav1 siRNA. CQ: chloroquine. Rapa: rapamycin. FITC-dextran: Fluorescein-labeled dextran. Papp: apparent permeability coefficient. LC3: microtubule-associated protein 1 light chain 3. Data were presented as mean ± SEM. P value indicates two-tailed unpaired t test. *, P < 0.05, **, P < 0.01. N.S: no significance
Figure 9.
Figure 9.
A proposed model of the role of autophagy on protecting the integrity of BBB under hypoxia. Hypoxia treatment in cerebrovascular endothelial cells induces a redistribution of membranous CLDN5 which is further endocytosed by CAV1-composed caveolae, impairing the integrity and permeability of BBB. Meanwhile, endothelial autophagy mediates the clearance of aggregated CLDN5 and CAV1 in the cytosol to reduce cytotoxicity and to block the recycling of CAV1 back to cell membrane, suppressing further redistribution of membranous CLDN5 and preventing BBB from fast disruption. control (CLDN5/LC3B/Nucleus)

References

    1. Abbott N, Ronnback L, Hansson E.. Astrocyte-endothelial interactions at the blood-brain barrier. Nat Rev Neurosci. 2006;7(1):41–53. - PubMed
    1. Flierl MA, Stahel PF, Rittirsch D, et al. Inhibition of complement C5a prevents breakdown of the blood-brain barrier and pituitary dysfunction in experimental sepsis. Crit Care. 2009;13(1):R12. - PMC - PubMed
    1. Jingjing Z, J?Rg P, Hartwig W, et al. Establishment of a neuroepithelial barrier by Claudin5a is essential for zebrafish brain ventricular lumen expansion. Proc Natl Acad Sci USA. 2010;107(4):1425–1430. - PMC - PubMed
    1. Liao Z, Yang Z, Piontek A, et al. Specific binding of a mutated fragment of Clostridium perfringens enterotoxin to endothelial claudin-5 and its modulation of cerebral vascular permeability. Neuroscience. 2016;327:53–63. - PubMed
    1. Liu J, Weaver J, Jin X, et al. Nitric oxide interacts with caveolin-1 to facilitate autophagy-lysosome-mediated claudin-5 degradation in oxygen-glucose deprivation-treated endothelial cells. Mol Neurobiol. 2015;53(9):1–13. - PMC - PubMed

Publication types