. 2021 Jan 25;379(2189):20200159.
doi: 10.1098/rsta.2020.0159. Epub 2020 Dec 7.

Whole-beam self-focusing in fusion-relevant plasma

Affiliations

Whole-beam self-focusing in fusion-relevant plasma

B T Spiers et al. Philos Trans A Math Phys Eng Sci. .

Abstract

Fast ignition inertial confinement fusion requires the production of a low-density channel in plasma with density scale-lengths of several hundred microns. The channel assists in the propagation of an ultra-intense laser pulse used to generate fast electrons which form a hot spot on the side of pre-compressed fusion fuel. We present a systematic characterization of an expanding laser-produced plasma using optical interferometry, benchmarked against three-dimensional hydrodynamic simulations. Magnetic fields associated with channel formation are probed using proton radiography, and compared to magnetic field structures generated in full-scale particle-in-cell simulations. We present observations of long-lived, straight channels produced by the Habara-Kodama-Tanaka whole-beam self-focusing mechanism, overcoming a critical barrier on the path to realizing fast ignition. This article is part of a discussion meeting issue 'Prospects for high gain inertial fusion energy (part 2)'.

Keywords: fast ignition; inertial confinement fusion; laser–plasma interactions; plasma channelling; proton radiography; synthetic diagnostics.


Conflict of interest statement

We declare we have no competing interests.

Figures

Figure 1.
Figure 1.
Illustration of the experimental setup used at the ORION laser facility. (a) Geometry of the frequency-trebled heating beam, a fundamental frequency short pulse interaction beam and the second-harmonic transverse probe beam. (b) Gated and streaked optical camera fields of view. The probe beam is split between the different cameras after passing through an interferometer. (Online version in colour.)
Figure 2.
Figure 2.
Dose delivered to each active layer of a typical RCF stack (per unit charge fluence) as a function of incident proton energy. Taller, blue peaks are HD810 film and shorter green peaks are EBT3 film. Doses delivered to iron and aluminium filter layers are shown in thinner black lines.Inert substrate and adhesive layers of films are not shown. (Online version in colour.)
Figure 3.
Figure 3.
Electron density along the central laser axis in a three-dimensional FLASH simulation at times corresponding to short pulse delivery times. The vacuum focus of the short pulses at 800 μm and quarter-critical density are represented by vertical and horizontal dashed light grey lines, respectively. At the earliest time used, the plasma has a very short scale length of just 6 μm, but at all other drive times the quarter-critical surface is located approximately 500 μm from original target surface. The other times used vary mainly in the progress of the expansion front. Density ‘bumps’ near the end of the density profile are related to the plasma’s expansion into low-density gas, rather than vacuum—a natural limitation of hydrodynamic simulations. (Online version in colour.)
Figure 4.
Figure 4.
The plasma density profile (upper panel) and magnetic field distribution (lower panel) at t = 550 ps, in the z = 0 plane of a three-dimensional Cartesian simulation. Magnetic fields are produced at the edges of the laser spot by the Biermann Battery mechanism and then advected out into the expanding plasma. (Online version in colour.)
Figure 5.
Figure 5.
Slice from a cylindrical Smilei simulation 4.4 ps after 200 TW short pulse injection at the right wall. At this time, the pulse energy has been fully absorbed by the plasma. It can be seen that the pulse has produced a low-density channel structure reaching 130 μm from the target surface that expands to approximately 40 μm diameter behind the pulse, but is only around 10 μm wide closer to the target surface (most easily seen from the magnetic field). Original target surface is located at x = 0 μm in this simulation. Magnetic fields generated by numerical noise closer to the target surface than the channel reaches have been omitted for clarity. (Online version in colour.)
Figure 6.
Figure 6.
Magnified view of the laser intensity distribution, integrated over the duration of the simulation. It can be seen that, as required by the HKT mechanism, the laser’s energy is mostly confined within a radius of λp from the laser axis. (Online version in colour.)
Figure 7.
Figure 7.
State of the plasma channel structure after 1 ns of hydrodynamic evolution using FLASH, at t = 1.55 ns. Slice of three-dimensional MHD simulation at z = 0. (Online version in colour.)
Figure 8.
Figure 8.
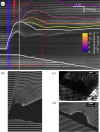
(a) Experimental streaked optical interferometry image of the long-pulse interaction, using 10 ns sweep time. The first 1.5 ns recorded, before the interaction begins, are not shown. The region without defined fringes is outlined in white, and recovered density contours are shown outside of this region. These densities agree with the FLASH simulations to within a factor of 3–4. A blue bar indicates the time profile of the heating beam and a red triangle indicates the short pulse time and focal point. (b) Synthetic streaked interferometry image produced using the method described in §2c from the plasma density profile extracted from FLASH simulations detailed in §2bi with 526.5 nm probe light. The dashed red box in (a) indicates the region corresponding to (b). (c) Experimental gated interferogram and (d) Synthetic gated interferogram taken at t0 + 1 ns (indicated with white bar in (a)). 1 cm of collection lens misalignment is included in (b) and (d) to optimize agreement with (a) and (c), respectively. The regions in which light islost are 470 ± 10 μm in the gated images and 600650μm in the streaked images. (Online version in colour.)
Figure 9.
Figure 9.
Reconstructed magnetic fields from a shot on which only the long pulses were fired, demonstrating the results of the algorithm in a situation with relatively simple, low-magnitude magnetic field structures. (a) A section of raw scanned image from a layer of EBT3 RCF. (b) Proton dose (arbitrary units) obtained from (a) using dose-response calibrations of (M. P. Hill 2016, Private communication). (c) and (d) The x and y components, respectively, of integrated magnetic field density recovered from (b) using the algorithm of Brown et al. [37]. The integrated field values found here are consistent with the magnitude of long pulse-produced fields near the target surface in figure 7.
Figure 10.
Figure 10.
(a) A section of an RCF layer. Dose levels (arb. units) are shown within the central region of interest, and the raw scanned image outside. Reconstructed longitudinal integrated MHD current densities are shown in (b)–(d), for three layers corresponding to energies of (a) 1 MeV (1.25 ns), (b) 13 MeV (200 ps) (c) 23 MeV (105 ps), with times quoted the delay between the arrival of the channelling pulse and the proton probe time. Dashed lines mark the probable location of a channelling feature. Positive integrated current densities correspond to currents counter-propagating with the proton beam, and produce a defocusing effect. (Online version in colour.)

References

    1. Shalloo RJ, Arran C, Corner L, Holloway J, Jonnerby J, Walczak R, Milchberg HM, Hooker SM. 2018. Hydrodynamic optical-field-ionized plasma channels. Phys. Rev. E 97, 053203 (10.1103/PhysRevE.97.053203) - DOI - PubMed
    1. Shalloo RJ. et al. 2019. Low-density hydrodynamic optical-field-ionized plasma channels generated with an axicon lens. Phys. Rev. Accel. Beams 22, 041302 (10.1103/PhysRevAccelBeams.22.041302) - DOI
    1. Lemos N. et al. 2019. X-ray sources using a picosecond laser driven plasma accelerator. Phys. Plasmas 26, 083110 (10.1063/1.5091798) - DOI
    1. Ceurvorst L. et al. 2016. Mitigating the hosing instability in relativistic laser–plasma interactions. New J. Phys. 18, 053023 (10.1088/1367-2630/18/5/053023) - DOI
    1. Matsuoka T. et al. 2008. Focus optimization of relativistic self-focusing for anomalous laser penetration into overdense plasmas (super-penetration). Plasma Phys. Controlled Fusion 50, 105011 (10.1088/0741-3335/50/10/105011) - DOI

LinkOut - more resources