. 2020 Dec 7;39(1):274.
doi: 10.1186/s13046-020-01768-8.

Mitophagy promotes sorafenib resistance through hypoxia-inducible ATAD3A dependent Axis

Affiliations

Mitophagy promotes sorafenib resistance through hypoxia-inducible ATAD3A dependent Axis

Hong Wu et al. J Exp Clin Cancer Res. .

Abstract

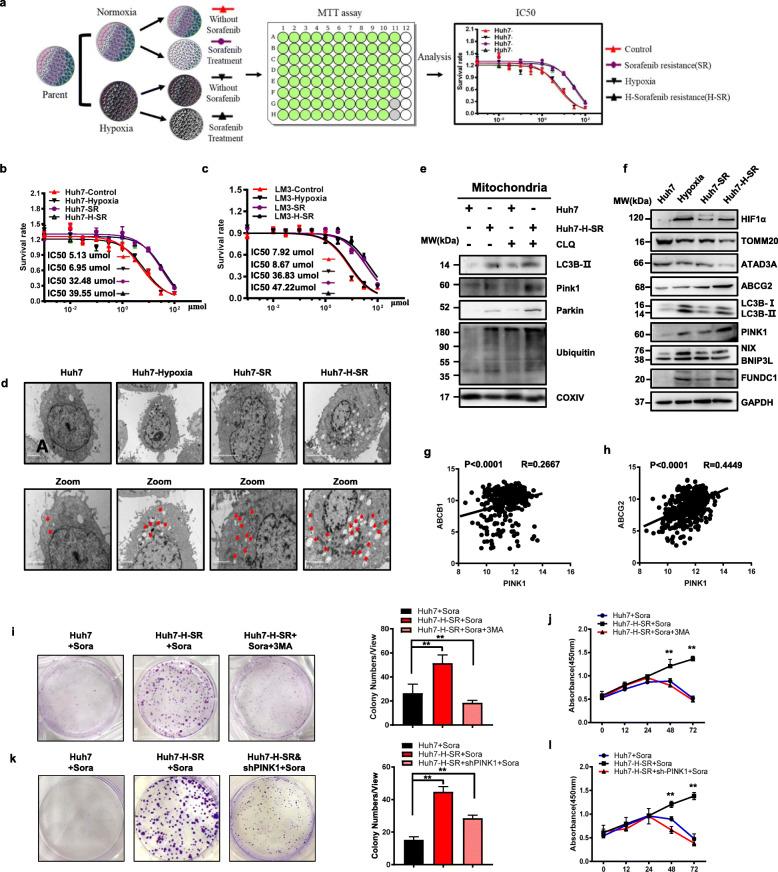
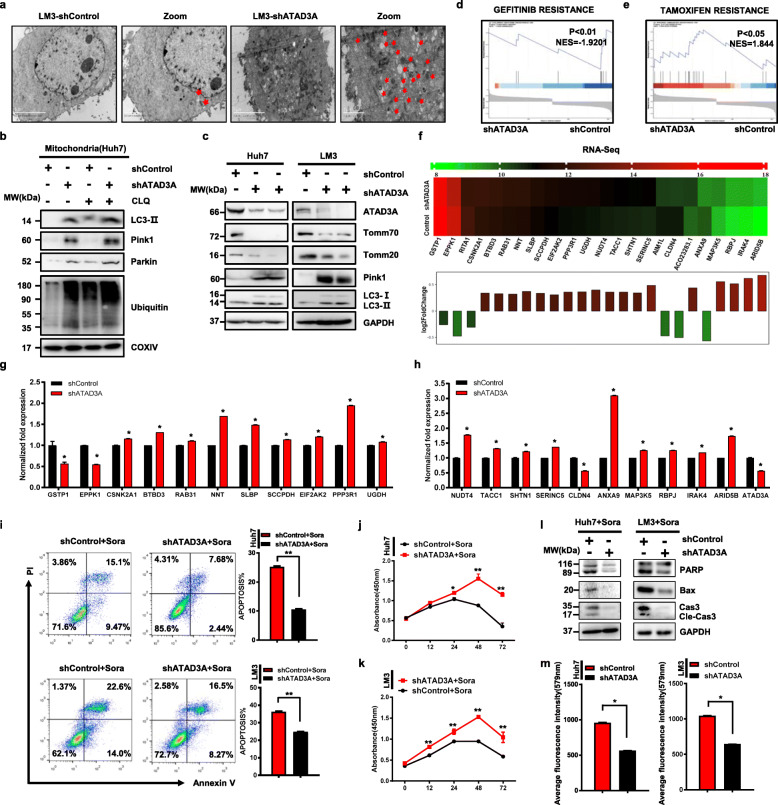
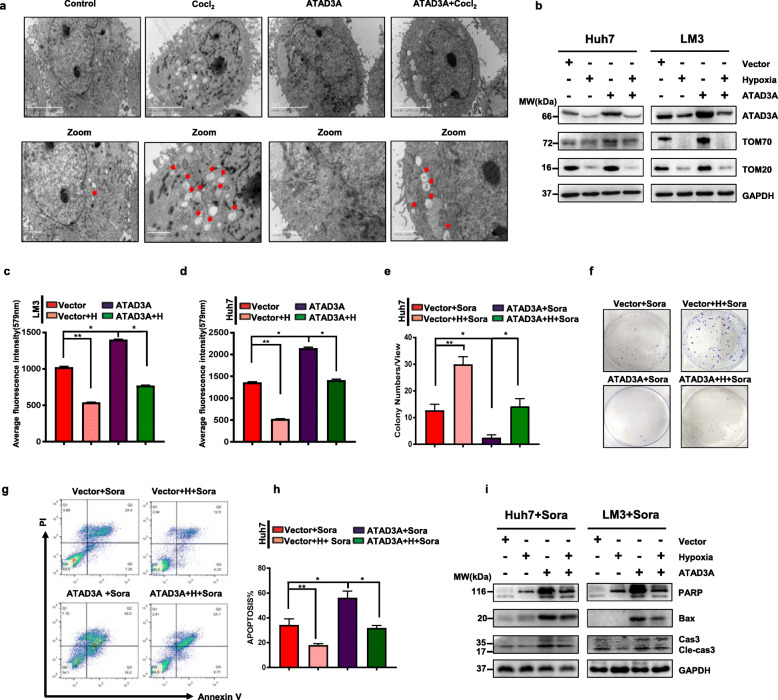
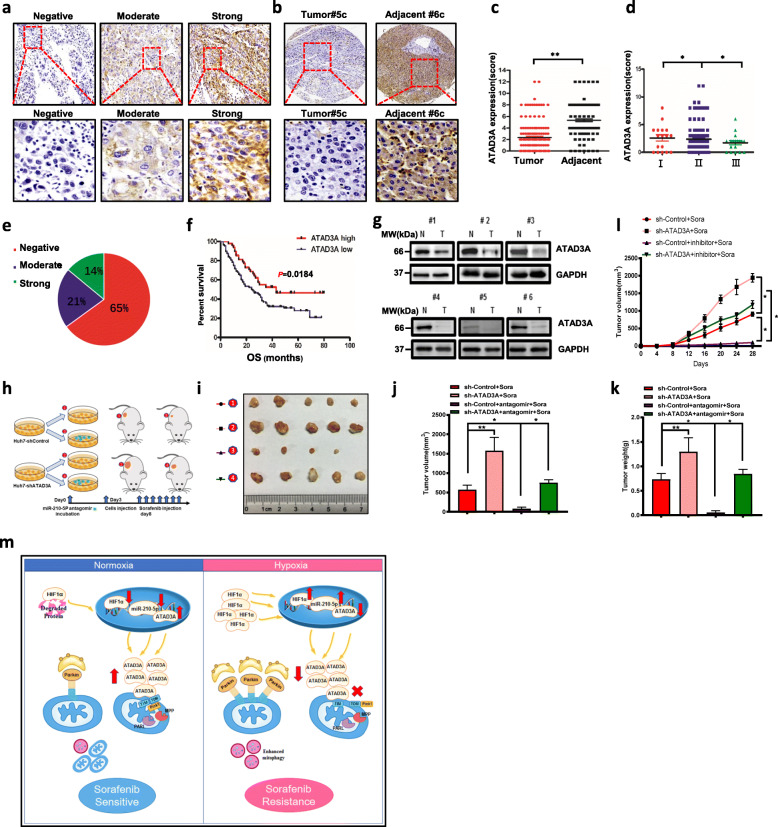
Background: The identification of novel targets for recovering sorafenib resistance is pivotal for Hepatocellular carcinoma (HCC) patients. Mitophagy is the programmed degradation of mitochondria, and is likely involved in drug resistance of cancer cells. Here, we identified hyperactivated mitophagy is essential for sorafenib resistance, and the mitophagy core regulator gene ATAD3A (ATPase family AAA domain containing 3A) was down regulated in hypoxia induced resistant HCC cells. Blocking mitophagy may restore the sorafenib sensitivity of these cells and provide a new treatment strategy for HCC patients.

Methods: Hypoxia induced sorafenib resistant cancer cells were established by culturing under 1% O2 with increasing drug treatment. RNA sequencing was conducted in transfecting LM3 cells with sh-ATAD3A lentivirus. Subsequent mechanistic studies were performed in HCC cell lines by manipulating ATAD3A expression isogenically where we evaluated drug sensitivity, molecular signaling events. In vivo study, we investigated the combined treatment effect of sorafenib and miR-210-5P antagomir.

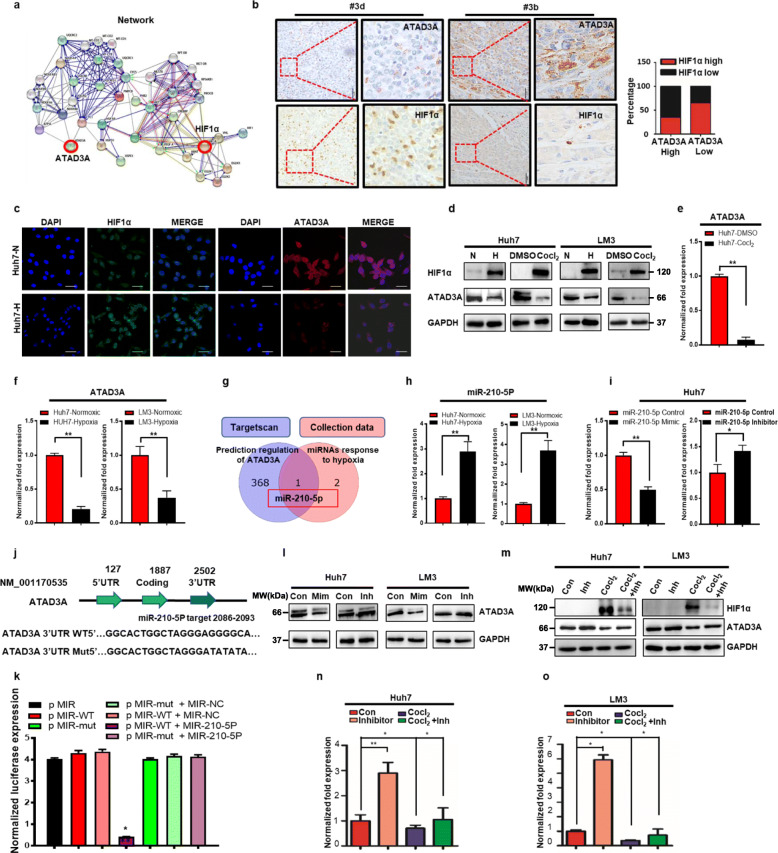
Results: We found a hyperactivated mitophagy regulating by ATAD3A-PINK1/PARKIN axis in hypoxia induced sorafenib resistant HCC cells. Gain- and loss- of ATAD3A were related to hypoxia-induced mitophagy and sorafenib resistance. In addition, ATAD3A is a functional target of miR-210-5p and its oncogenic functions are likely mediated by increased miR-210-5P expression. miR-210-5P was upregulated under hypoxia and participated in regulating sorafenib resistance. In vivo xenograft assay showed that miR-210-5P antagomir combined with sorafenib abrogated the tumorigenic effect of ATAD3A down-regulation in mice.

Conclusions: Loss of ATAD3A hyperactivates mitophagy which is a core event in hypoxia induced sorafenib resistance in HCC cells. Targeting miR-210-5P-ATAD3A axis is a novel therapeutic target for sorafenib-resistant HCC.

Keywords: ATAD3A; Hypoxia; Mitophagy; Sorafenib resistance.


Conflict of interest statement

The authors declare no competing financial interests.

Figures

Fig. 1
Fig. 1
Hypoxia-induced sorafenib resistance in HCC cells is dependent on hyperactived mitophagy. a Schematic diagram showing establishment of sorafenib resistant (SR) and hypoxia-induced sorafenib resistant (H-SR) cells. b, c Evaluation of the half inhibitory concentration (IC50) of sorafenib in the indicated groups. d Transmission electron micrographs showing mitophagy in the indicated cells. e Immunoblots showing expression levels of the indicated proteins in control and Huh7-H-SR cells treated with/out chloroquine (CLQ). f Immunoblot showing expression levels of indicated proteins in control, hypoxia, SR and Huh7-H-SR cells. g, h Correlation between PINK1 expression and ABCB1 (g) and ABCG2 (h) in HCC patients from TCGA database. i Number of colonies formed by Huh7, Huh7-H-SR and Huh7-H-SR cells with 3MA (dosage: 5 mM) under sorafenib treatment (dosage: 5.13 μM). j Cell viability of Huh7, Huh7-H-SR and Huh7-H-SR cultured with 3MA under sorafenib treatment for varying durations. k Number of colonies formed by Huh7, Huh7-H-SR and Huh7-H-SR transfected with shPINK1 under sorafenib treatment. l Percentage of viable Huh7, Huh7-H-SR and Huh7-H-SR transfected with shPINK1 under sorafenib treatment for varying durations. Data are shown as mean ± SEM from three independent experiments, **p < 0.01, ***p < 0.001
Fig. 2
Fig. 2
ATAD3A plays a vital role in sorafenib resistance and hyperactivates mitophagy in hepatoma cells. a Electron micrographs showing mitophagy in ATAD3A-knockdown LM3 cells. b Immunoblot showing expression levels of indicated proteins in untreated and chloroquine (CLQ)-treated Huh7 and Huh7-shATAD3A cells. c Immunoblot showing expression levels of indicated proteins in Huh7-shControl, Huh7-shATAD3A, LM3-shControl and LM3-shATAD3A cells. d, e GSEA of drug resistance genes in shControl and shATAD3A cells. NES, normalized enrichment score. f Heatmap showing expression for drug resistance core-enriched genes in LM3-shATAD3A cells relative to that in LM3-shControl cells. g, h qRT-PCR analyses of the indicated genes in shATAD3A and shControl LM3 cells. i Percentage of apoptotic cells in ATAD3A-knockdown cells. Annexin V and PI respectively indicate the early and late stage apoptotic cells. j, k Percentage of viable shControl and shATAD3A Huh7 (j) and LM3 (k) cells under sorafenib treatment for varying durations. l Immunoblot showing the expression levels of the indicated proteins in Huh7-shControl, Huh7-shATAD3A, LM3-shControl and LM3-shATAD3A cells. m Mito-Tracker fluorescence intensities in the indicated Huh7 cells and LM3 cells. Data are shown as mean ± SEM from three independent experiments, **p < 0.01, ***p < 0.001
Fig. 3
Fig. 3
ATAD3A plays a vital role in hypoxia-induced mitophagy and sorafenib sensitivity in hepatoma cells. a Electron micrographs showing mitophagy in ATAD3A-overexpressing Huh7 cells treated with or without CoCl2. b Immunoblot showing the expression levels of indicated proteins in empty vector and Ov-ATAD3A cells with/out CoCl2 treatment. c, d Mito-Tracker fluorescence intensities of the indicated LM3 (c) and Huh7 (d) cells. e, f Number of colonies formed by vector and ATAD3A overexpression Huh7 cells under normal or hypoxia condition with sorafenib treatment. g, h Apoptosis rates in vector and ATAD3A overexpression LM3 cells under normal or hypoxia condition with sorafenib treatment. Annexin V and PI respectively indicate the early and late stage apoptotic cells. i Immunoblot showing expression levels of indicated proteins in Huh7-vector, Huh7-Ov-ATAD3A, LM3-vector and LM3-Ov-ATAD3A cells with/without CoCl2 under sorafenib treatment. Each bar represents the mean ± SEM of three independent experiments. *P < 0.05 and ** P < 0.01
Fig. 4
Fig. 4
ATAD3A is a direct target of hypoxia-induced miR-210-5p in hepatoma cells. a Gene-gene interaction network. b In situ ATAD3A and HIF-1α expression in paired HCC and normal liver tissues (n = 85). c Representative immunofluorescence images showing HIF-1α (in green) and ATAD3A (in red) expression Huh7 cells cultured under normoxic and hypoxic (1% O2 for 24 h) conditions. Scale bar = 200 μm. d Immunoblot showing HIF-1α and ATAD3A in LM3 and Huh7 cells under 1% O2 or CoCl2 treatment for 24 h. e qRT-PCR analysis showing ATAD3A mRNA levels in Huh7 cells treated with CoCl2 or DMSO for 24 h. f qRT-PCR analysis showing ATAD3A mRNA levels in Huh7 and LM3 cells under 1% or 20% O2. g The overlap between the predicted miRNA regulators of ATAD3A and the hypoxia-responsive miRNAs from three different digestive tract cancers. h qRT-PCR analysis showing miR-210-5P levels in Huh7 and LM3 cells treated with 20% or 1% O2. i qRT-PCR analysis showing the expression of ATAD3A in Huh7 cells treated with miR-210-5P mimic or inhibitor. J, k The binding sites of miR-210-5p in the 3’UTR region of ATAD3A based on bioinformatics prediction and the sequences of designed ATAD3A mutants (j). Luciferase reporter assay of 293 T cell transfected with miR-210-5P mimics or miR-NC and ATAD3A-3’UTR-wt or ATAD3A-3’UTR-mut (k). l Immunoblot showing ATAD3A expression in hepatoma cells transfected with miR-210-5P mimic or inhibitor. m-o Immunoblot (m) and qRT-PCR (n-o) analyses of ATAD3A expression in Huh7 and LM3 cells transfected with miR-210-5P inhibitor with/without CoCl2 treatment. Each bar represents the mean ± SEM of three independent experiments. *P < 0.05 and ** P < 0.01
Fig. 5
Fig. 5
Hypoxia-induced sorafenib resistance and mitophagy are partially mediated by miR-210-5P. a Electron micrographs showing mitophagy in hypoxia-cultured Huh7 cells transfected with miR-210-5P mimic or inhibitor treated cells with or without CoCl2. b Immunoblot showing expression levels of indicated proteins in miR-210-5P mimic or inhibitor treated cells with or without CoCl2. c, d Mito-Tracker fluorescence intensities of the indicated huh7 (c) and LM3 (d) cells. e Immunoblot showing expression levels of indicated proteins in Huh7 cells treated with miR-210-5P inhibitor and 1% O2 with/without chloroquine. f-h Representative FACS analyses of apoptosis rates in Huh7 cells transfected with miR-210-5P mimic or inhibitor with or without hypoxia condition under sorafenib treatment. i Immunoblot showing expression levels of indicated proteins in miR-210-5P mimic or CoCl2 and miR-210-5P inhibitor-treated Huh7 and LM3 cells under sorafenib treatment. Each bar represents the mean ± SEM of three independent experiments. *P < 0.05 and ** P < 0.01
Fig. 6
Fig. 6
The miR-210-5P-ATAD3A axis influences xenografts formation in vivo. a Representative images of ATAD3A expression with IHC staining in hepatocellular carcinoma specimens. b Representative images of ATAD3A expression with IHC staining in tumor and adjacent hepatocellular carcinoma specimens. c Statistical analysis of IHC-determined ATAD3A expression in tumor and adjacent normal tissue from HCC patients (Student t test) (n = 85). d Comparison of IHC-determined ATAD3A expression among HCC patients of different pathological grades. e Percentages of strong, moderate, and negative ATAD3A expression in hepatocellular carcinoma samples(n = 135). f Kaplan-Meier analysis of ATAD3A expression and overall survival of HCC patients(n = 135). g Immunoblot analysis of ATAD3A expression in HCC tissues and their adjacent normal tissues. GAPDH was used as a loading control. h. Xenograft tumors derived from shATAD3A LM3 cells with/without miR-210-5P antagomir under sorafenib treatment. i-l. Representative images of tumor growth (i), and the tumor volume (j), tumor weight (k) and tumor growth curve (l) in the indicated groups. m. Schematic representation of ATAD3A-mediated mitophagy during hypoxia-induced sorafenib resistance in HCC cells. Each bar represents the mean ± SEM of three independent experiments. *P < 0.05 and ** P < 0.01

References

    1. Levine B, Kroemer G. Biological functions of autophagy genes: a disease perspective. Cell. 2019;176(1–2):11–42. doi: 10.1016/j.cell.2018.09.048. - DOI - PMC - PubMed
    1. Sorrentino V, Menzies KJ, Auwerx J. Repairing mitochondrial dysfunction in disease. Annu Rev Pharmacol Toxicol. 2018;58:353–389. doi: 10.1146/annurev-pharmtox-010716-104908. - DOI - PubMed
    1. Wu Q, Luo CL, Tao LY. Dynamin-related protein 1 (Drp1) mediating mitophagy contributes to the pathophysiology of nervous system diseases and brain injury. Histol Histopathol. 2017;32(6):551–559. - PubMed
    1. Fukuda T, Kanki T. Mechanisms and physiological roles of Mitophagy in yeast. Mol Cells. 2018;41(1):35–44. - PMC - PubMed
    1. Yang X, Pan W, Xu G, Chen L. Mitophagy: a crucial modulator in the pathogenesis of chronic diseases. Clin Chim Acta. 2020;502:245–254. doi: 10.1016/j.cca.2019.11.008. - DOI - PubMed