

Data analysis of Covid-19 pandemic and short-term cumulative case forecasting using machine learning time series methods
- PMID: 33281306
- PMCID: PMC7698672
- DOI: 10.1016/j.chaos.2020.110512
Data analysis of Covid-19 pandemic and short-term cumulative case forecasting using machine learning time series methods
Abstract
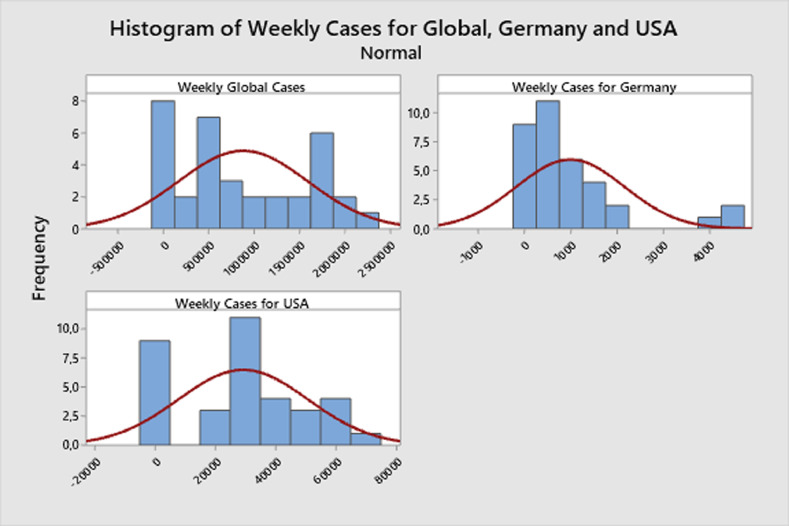
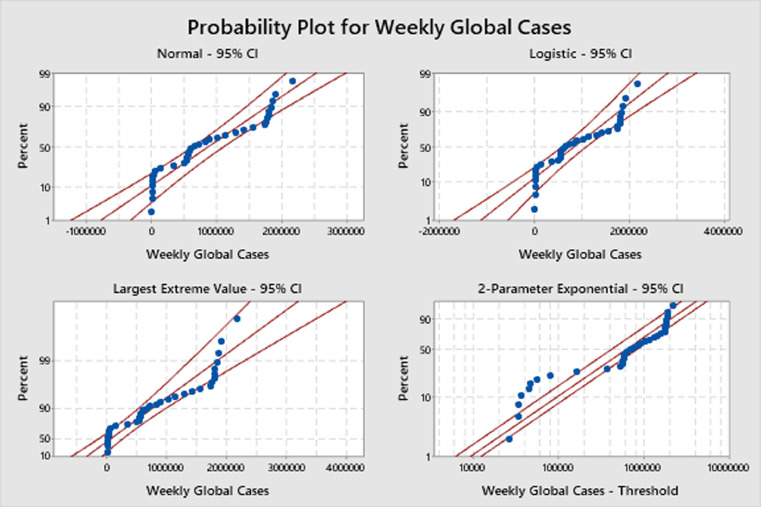
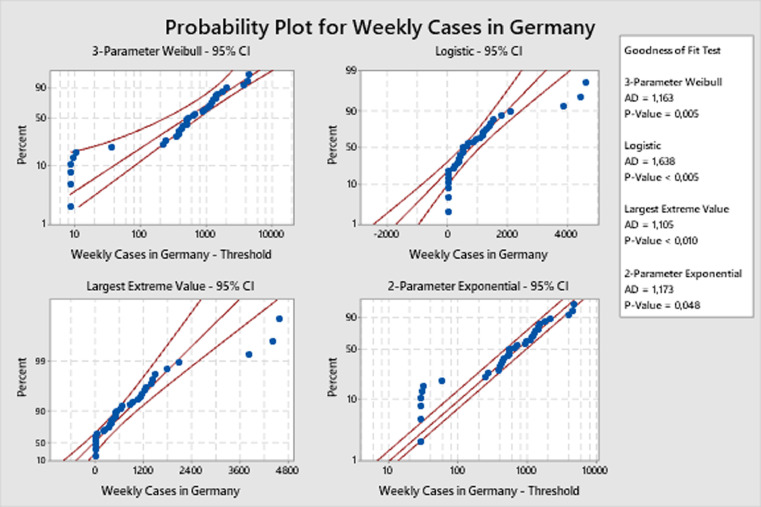
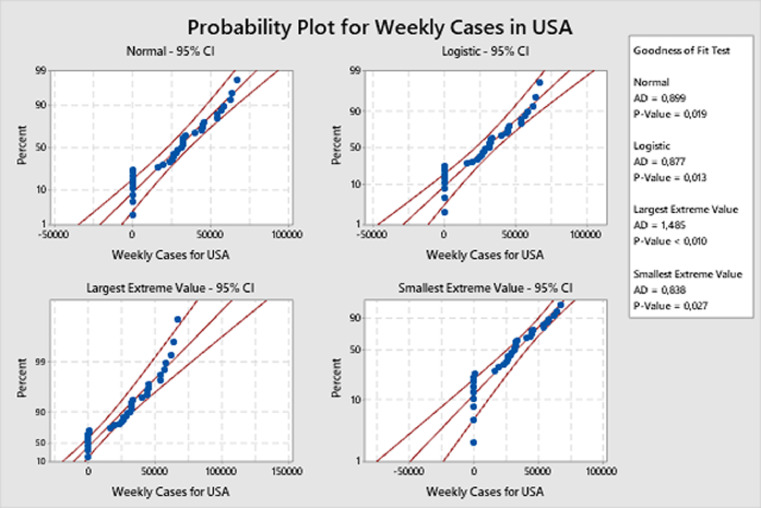
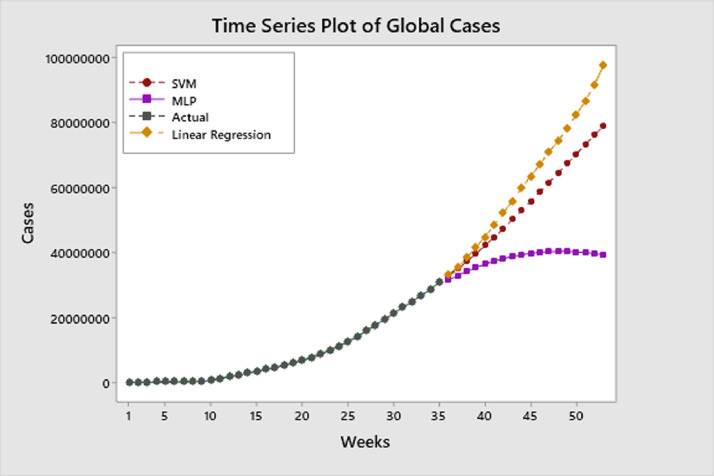
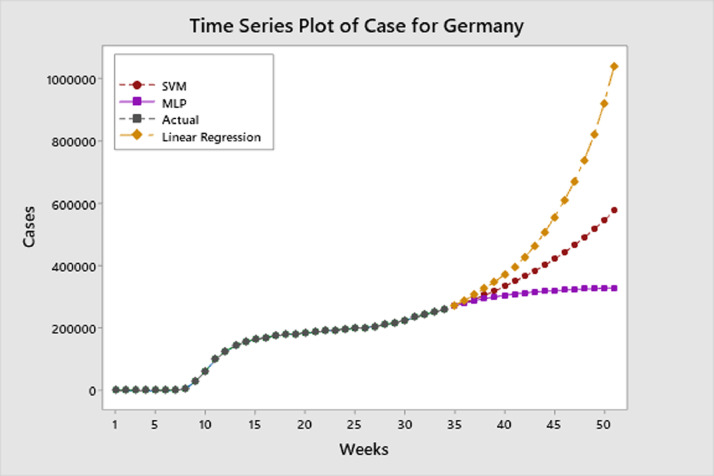
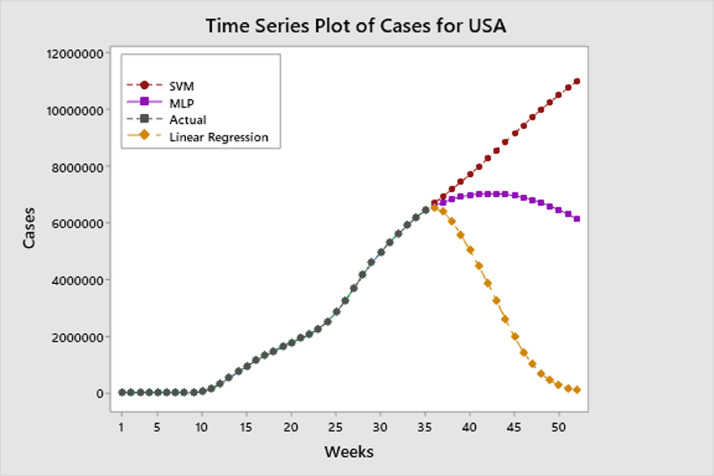
The Covid-19 pandemic is the most important health disaster that has surrounded the world for the past eight months. There is no clear date yet on when it will end. As of 18 September 2020, more than 31 million people have been infected worldwide. Predicting the Covid-19 trend has become a challenging issue. In this study, data of COVID-19 between 20/01/2020 and 18/09/2020 for USA, Germany and the global was obtained from World Health Organization. Dataset consist of weekly confirmed cases and weekly cumulative confirmed cases for 35 weeks. Then the distribution of the data was examined using the most up-to-date Covid-19 weekly case data and its parameters were obtained according to the statistical distributions. Furthermore, time series prediction model using machine learning was proposed to obtain the curve of disease and forecast the epidemic tendency. Linear regression, multi-layer perceptron, random forest and support vector machines (SVM) machine learning methods were used. The performances of the methods were compared according to the RMSE, APE, MAPE metrics and it was seen that SVM achieved the best trend. According to estimates, the global pandemic will peak at the end of January 2021 and estimated approximately 80 million people will be cumulatively infected.
Keywords: Covid-19; Machine learning; Multi-layer perceptron; Statistical distribution; Support vector machines.
© 2020 Elsevier Ltd. All rights reserved.
Conflict of interest statement
The author declares that he has no known competing financial interests or personal relationships that could have appeared to influence the work reported in this paper.
Figures
References
-
- Ahmed N.K., Atiya A.F., Gayar N.E., El-Shishiny H. An empirical comparison of machine learning models for time series forecasting. Econom Rev. 2010;29(5–6):594–621.
-
- Breiman L. Random forests. Mach Learn. 2001;45(1):5–32.
-
- Elfahham Y. Estimation and prediction of construction cost index using neural networks, time series, and regression. Alex Eng J. 2019;58(2):499–506.
LinkOut - more resources
Full Text Sources
Other Literature Sources
Research Materials
Miscellaneous
