. 2020 Nov 12:13:602638.
doi: 10.3389/fnmol.2020.602638. eCollection 2020.

Krüppel-Like Factors 9 and 13 Block Axon Growth by Transcriptional Repression of Key Components of the cAMP Signaling Pathway

Affiliations

Krüppel-Like Factors 9 and 13 Block Axon Growth by Transcriptional Repression of Key Components of the cAMP Signaling Pathway

José Ávila-Mendoza et al. Front Mol Neurosci. .

Abstract

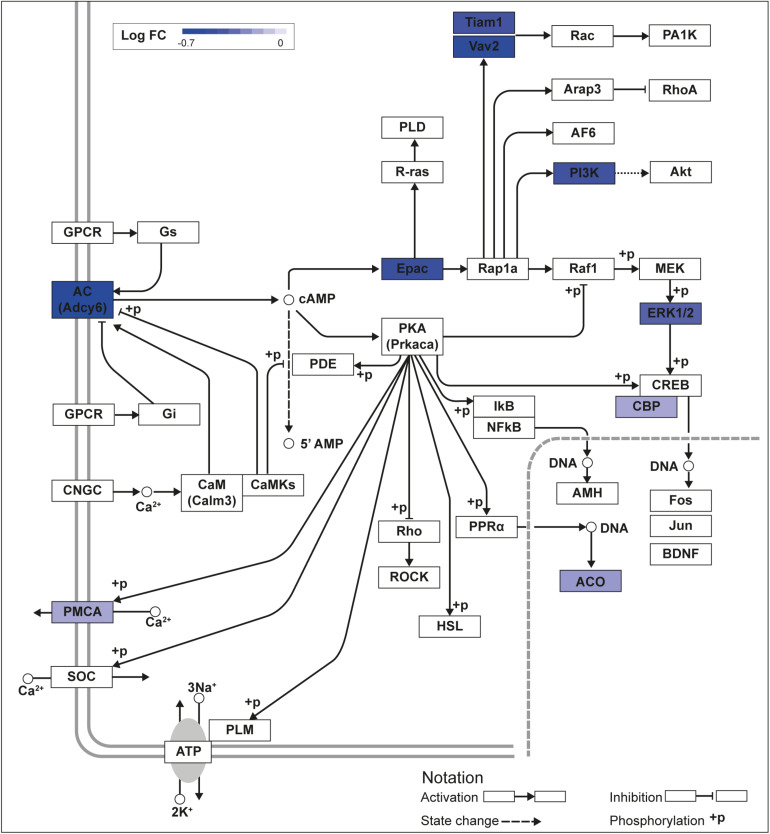
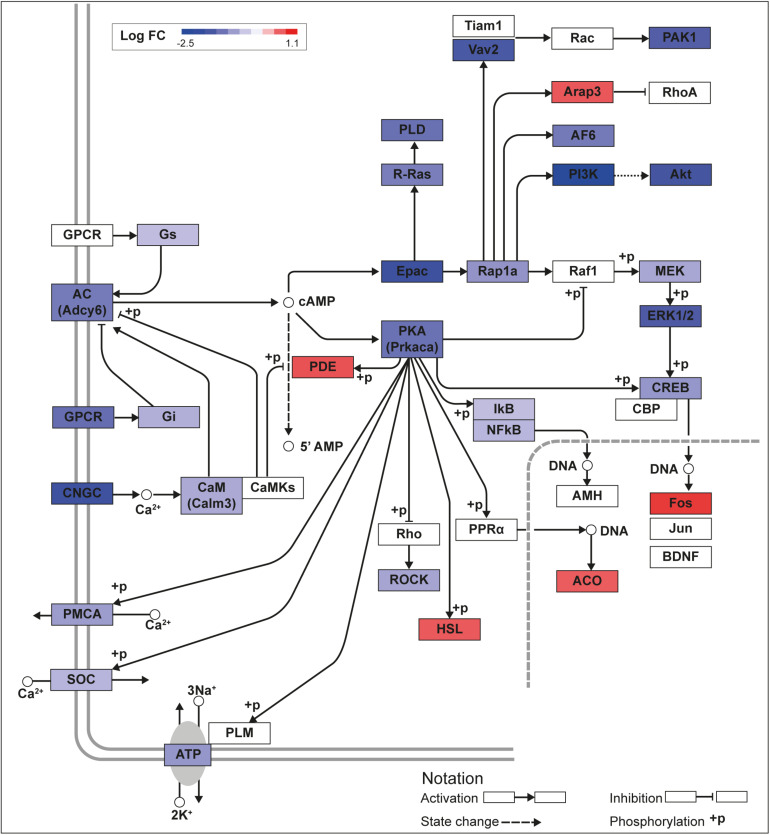
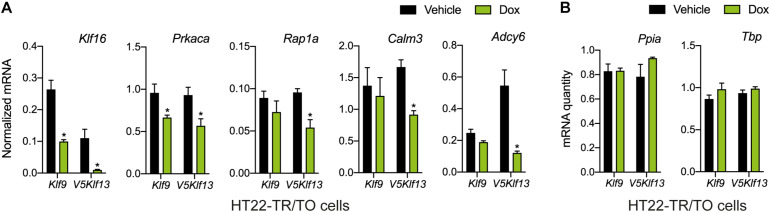
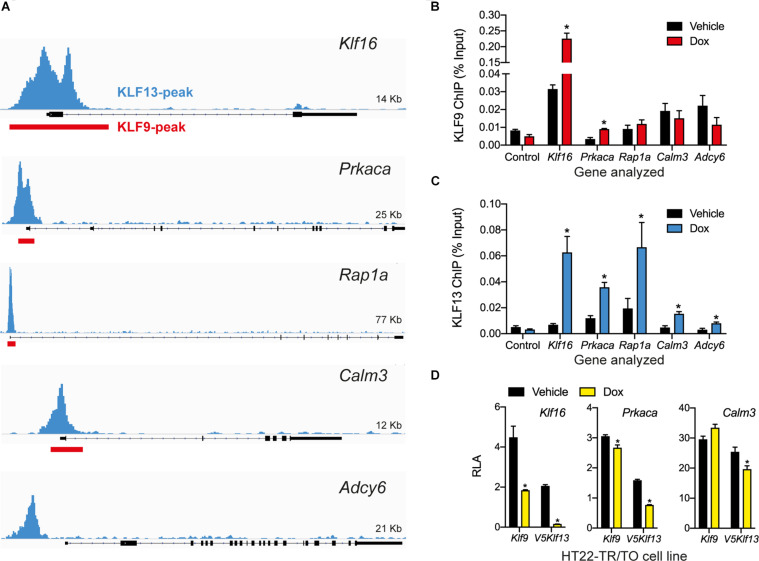
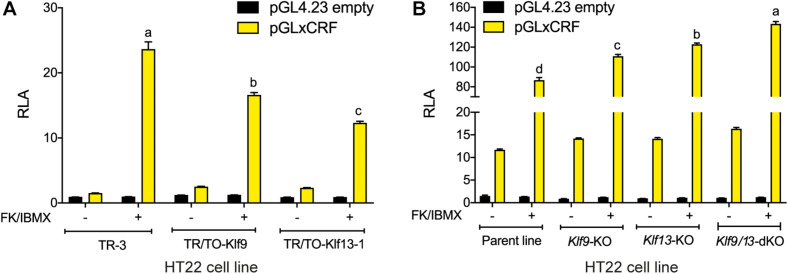
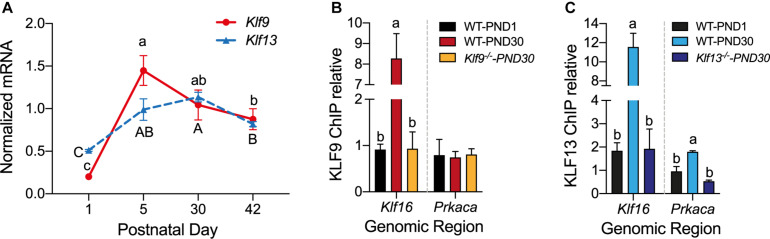
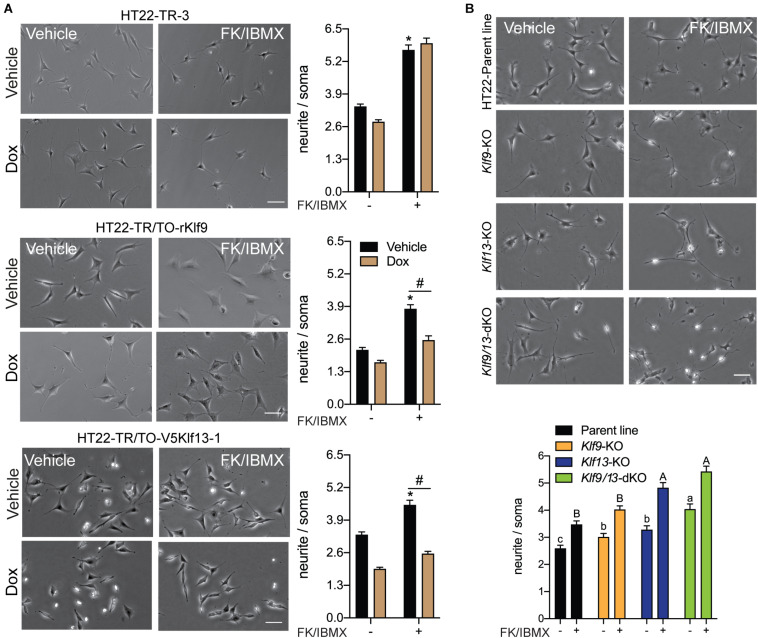
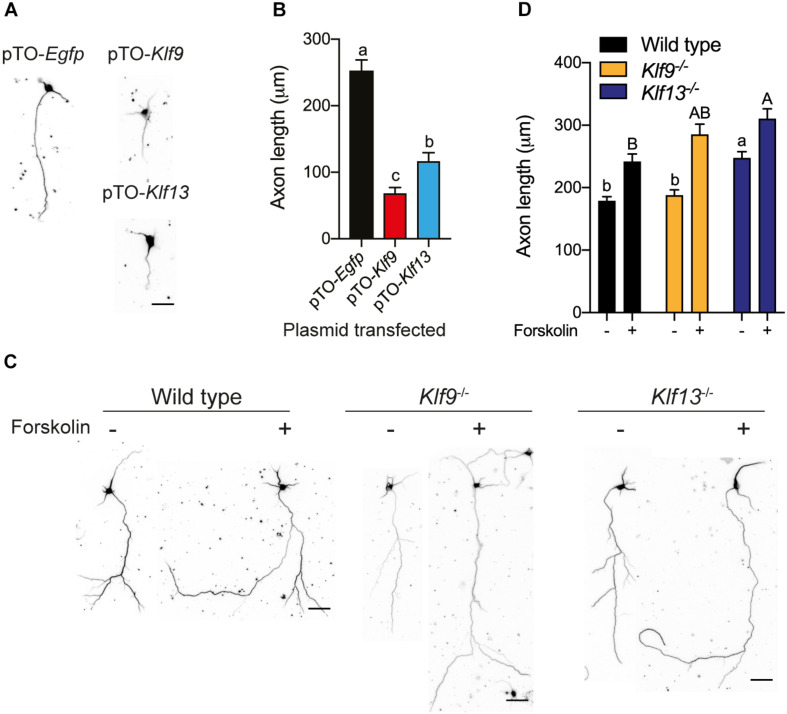
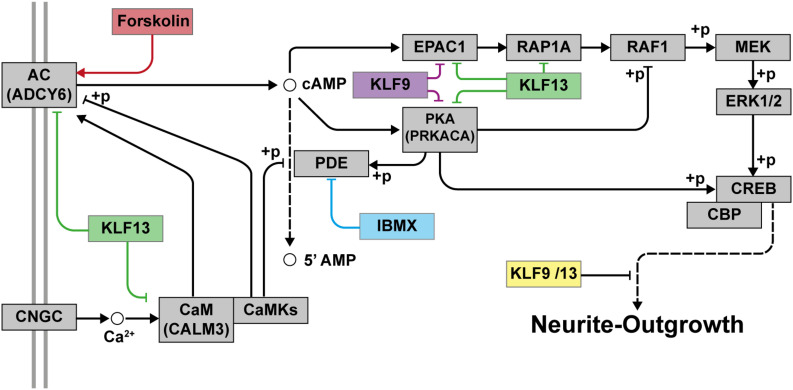
Krüppel-like factors (KLFs) are zinc finger transcription factors implicated in diverse biological processes, including differentiation of neural cells. The ability of mammalian neurons to elongate axons decreases during postnatal development in parallel with a decrease in cAMP, and increase in expression of several Klf genes. The paralogous KLFs 9 and 13 inhibit neurite outgrowth, and we hypothesized that their actions are mediated through repression of cAMP signaling. To test this we used the adult mouse hippocampus-derived cell line HT22 engineered to control expression of Klf9 or Klf13 with doxycycline, or made deficient for these Klfs by CRISPR/Cas9 genome editing. We also used primary hippocampal cells isolated from wild type, Klf9 -/- and Klf13 -/- mice. Forced expression of Klf9 or Klf13 in HT22 changed the mRNA levels of several genes involved with cAMP signaling; the predominant action was gene repression, and KLF13 influenced ∼4 times more genes than KLF9. KLF9 and KLF13 repressed promoter activity of the protein kinase a catalytic subunit alpha gene in transfection-reporter assays; KLF13, but not KLF9 repressed the calmodulin 3 promoter. Forskolin activation of a cAMP-dependent promoter was reduced after forced expression of Klf9 or Klf13, but was enhanced in Klf gene knockout cells. Forced expression of Klf9 or Klf13 blocked cAMP-dependent neurite outgrowth in HT22 cells, and axon growth in primary hippocampal neurons, while Klf gene knockout enhanced the effect of elevated cAMP. Taken together, our findings show that KLF9 and KLF13 inhibit neurite/axon growth in hippocampal neurons, in part, by inhibiting the cAMP signaling pathway.

Keywords: Krüppel like factor; axon regeneration; cyclic AMP; hippocampus; neurite outgowth.


Figures

FIGURE 1
FIGURE 1
KLF9 regulates cAMP signaling pathway genes in HT22 cells. We previously conducted an RNA sequencing experiment in the HT22-TR/TO-Klf9 cell line treated with or without doxycycline for 8 h to induce the Klf9 transgene (Knoedler et al., 2017). We analyzed differentially regulated genes in the context of the Kyoto Encyclopedia Genes and Genomes signaling pathways. Shown is the core of the cAMP signaling pathway (KEGG:04024) overlayed with differential gene expression values for each gene with a p-value < 0.05. The box shading for each gene represents the direction of change in mRNA levels (Log fold change – Log FC shown in the legend); i.e., boxes with darkest shading indicate the largest decreases in mRNA levels.
FIGURE 2
FIGURE 2
KLF13 regulates cAMP signaling pathway genes in HT22 cells. We previously conducted an RNA sequencing analysis in the HT22-TR/TO-V5Klf13-1 cell line treated with or without doxycycline for 8 h to induce the V5Klf13 transgene (Ávila-Mendoza et al., 2020). We analyzed differentially regulated genes in the context of the Kyoto Encyclopedia Genes and Genomes signaling pathways. Shown is the core of the cAMP signaling pathway (KEGG:04024) overlayed with differential gene expression values for each gene with a p-value < 0.05. The color of the box for each gene represents the direction of change in mRNA levels (Log fold change – Log FC shown in the legend); i.e., boxes with dark blue indicate the largest decreases, while boxes with dark red indicate the largest increases in mRNA levels.
FIGURE 3
FIGURE 3
Targeted analysis of cAMP signaling pathway gene repression by KLF9 and KLF13 in HT22 cells. We treated the HT22-TR/TO-Klf9 and HT22-TR/TO-V5Klf13-1 cell lines with vehicle or doxycycline (dox; 1 μg/ml) for 8 h, then harvested cells, isolated RNA and conducted RT-qPCR. Bars represent the mean ± SEM. (A) Changes in Klf16 mRNA levels served as a positive control. Forced expression of Klf9 reduced the mRNA levels of Klf16 (p = 0.0004) and Prkaca (p = 0.02) while forced expression of V5Klf13 reduced the mRNA levels of Klf16 (p = 0.0037), Prkaca (p = 0.026), Rap1a (p = 0.007), Calm3 (p = 0.001), and Adcy6 (p = 0.001); n = 4/treatment; Student’s independent t-test. Asterisks indicate statistically significant differences within a cell line with p < 0.05. (B) We normalized target gene mRNA levels shown in (A) to the geometric mean of the mRNA levels of the reference genes Tbp and Ppia, which were unaffected by dox treatment.
FIGURE 4
FIGURE 4
KLF9 and KLF13 associate in chromatin at promoters of cAMP signaling pathway genes in HT22 cells. (A) Screenshots of genome traces from the Integrative Genome Viewer (IGV) showing the locations of KLF13 chromatin-streptavidin precipitation sequencing (ChSP-seq) peaks at genes in the cAMP signaling pathway (Ávila-Mendoza et al., 2020). The gene structures are shown below the genome traces, with lines and black filled bars representing introns and exons, respectively. The gene orientations are 5′ 3′, and all peaks are within the proximal promoter regions of the genes shown. Red boxes indicate locations of KLF9 peaks identified previously by ChSP-seq (Knoedler et al., 2017). (B,C) We conducted targeted ChIP-qPCR assays in HT22 cells to validate the KLF9 and KLF13 ChSP-seq peaks at cAMP signaling pathway genes. We treated HT22-TR/TO-Klf9 and HT22-TR/TO-V5Klf13-1 cells with vehicle or doxycycline (dox; 1 μg/ml) for 16 h, then harvested cells and isolated chromatin for ChIP assays. The KLF9 and KLF13 ChIP qPCR data are expressed as a percentage of the input. We analyzed the Klf16 intron, which did not have KLF9 or KLF13 ChSP peaks, as a negative control region (Control). Bars represent the mean ± SEM (n = 4/treatment), and we used Student’s independent t-test to compare the ChIP values between vehicle and dox treatment within a cell line (asterisks indicate p < 0.05). (B) KLF9 ChIP qPCR assay conducted on chromatin isolated from HT22-TR/TO-Klf9 cells (Klf16: p < 0.0001; Prkaca: p = 0.0024). (C) KLF13 ChIP qPCR assay conducted on chromatin isolated from HT22-TR/TO-V5Klf13-1 cells (Klf16: p = 0.0006; Prkaca: p = 0.0044; Rap1a: p = 0.032; Calm3: p = 0.027; Adcy6: p = 0.048). (D) KLF9 and KLF13 regulate promoter activity in transfection promoter-reporter assays conducted in HT22 cells. We co-transfected HT22-TR/TO-Klf9 or HT22-TR/TO-V5Klf13-1 cells with pRenilla plus firefly luciferase reporter vectors containing genomic DNA fragments corresponding to KLF9 and KLF13 ChSP peaks [shown in (A)] within the promoters of the Klf16 (positive control), Prkaca and Calm3 genes. Twenty hr after transfection we treated cells with vehicle or dox (1 μg/ml) for 16 h, then harvested cells and conducted dual luciferase reporter assay. The relative luciferase activity (RLA) represents firefly luciferase normalized to the Renilla luciferase values. Forced expression of Klf9 or V5Klf13 repressed transcriptional activity of the Klf16 and Prkaca promoters (HT22-TR/TO-Klf9: Klf16, p = 0.0004; Prkaca, p = 0.018; HT22-TR/TO-V5Klf13-1: Klf16, p < 0.0001; Prkaca, p < 0.0001; n = 4/treatment; Student’s independent t-test); only forced expression of V5Klf13 repressed transcriptional activity of the Calm3 promoter (Calm3, p < 0.013; n = 4/treatment). Asterisks indicate statistically significant differences within a cell line with p < 0.05.
FIGURE 5
FIGURE 5
KLF9 and KLF13 repress cAMP signaling pathway activity in HT22 cells. (A) We co-transfected HT22-TR/TO-Klf9 and HT22-TR/TO-V5Klf13-1 cells with pRenilla plus a firefly luciferase reporter vector containing the proximal promoter of the Xenopus laevis corticotropin releasing factor b (crfb) gene (pGLxCRF), which contains a functional cAMP response element (CRE) (Yao et al., 2007). This reporter is activated by phosphorylated CRE binding protein (CREB), and therefore reflects the activity of the cAMP signaling pathway in cells. Control cells were transfected with pGL4.23 empty vector. Twenty hour after transfection we treated cells with doxycycline (dox; 1 μg/ml) to induce expression of the Klf9 or V5Klf13 transgenes, and 4 hour later we added vehicle or FK + IBMX to elevate intracellular cAMP. Eight hr after initiating dox treatment we harvested cells and analyzed reporter activity using dual luciferase assay. Bars represent the mean ± SEM. Forced expression of Klf9 or V5Klf13 reduced the relative luciferase activity (RLA) induced by FK + IBMX treatment [F(2,9) = 86.06, p < 0.0001; one-way ANOVA followed by Tukey’s post hoc test; n = 4/treatment]. Letters indicate statistically significant differences (p < 0.05) between cell lines treated with FK + IBMX. (B) We co-transfected HT22 parental and Klf knockout (KO) cell lines (HT22-Klf9-KO, HT22-Klf13-KO, and HT22-Klf9/13-double KO) as described above, then we treated them with FK + IBMX for 4 h before harvest and analysis by dual luciferase assay. Bars represent the mean ± SEM. The RLA induced by FK + IBMX was greater in each of the KO cell lines compared to the parental cell line, and was greatest in the double KO cells [F(3,12) = 89.39, p < 0.0001; one-way ANOVA followed by Tukey’s post hoc test; n = 4/treatment]. Letters indicate statistically significant differences (p < 0.05) between cell lines treated with FK + IBMX.
FIGURE 6
FIGURE 6
The mRNA levels for Klf9 and Klf13 increase, and KLF13, but not KLF9, associates in chromatin at the promoter region of Prkaca during postnatal development of the hippocampus. (A) Changes in Klf9 and Klf13 mRNA levels in mouse hippocampus during postnatal development. We collected the hippocampal region from mice at postnatal day (PND) 1, 15, 30, and 42, and we quantified Klf9 and Klf13 mRNAs by RT-qPCR. We normalized the Klf mRNA levels to the geometric means of the mRNA levels of the reference genes Gadph and Ppia. The mean mRNA levels of both Klf genes peaked at PND15, remained elevated at PND30, and declined at PND42. Points represent the mean ± SEM [Klf9: F(3,26) = 55.84, p < 0.0001; Klf13: F(3,12) = 24.99, p < 0.0001; one-way ANOVA followed by Tukey’s post hoc test; n = 4/treatment]. Means with the same letter are not significantly different. (B,C) We analyzed KLF9 and KLF13 occupancy in chromatin at the promoter regions of the Klf16 and Prkaca genes in wild type (WT) mouse hippocampus at PND1 and PND30, and PND30 Klf9–/– and Klf13–/– mice using ChIP qPCR. We normalized the KLF9 and KLF13 ChIP values to the signal obtained with IgGs purified from normal goat (KLF9) or normal rabbit (KLF13) serum. Bars represent the mean ± SEM (n = 4/treatment). Means with the same letter within a gene analyzed are not significantly different (p < 0.05; one-way ANOVA followed by Tukey’s post hoc test.). (B) The KLF9 ChIP signal at the Klf16 gene promoter was greater in WT PND30 mice compared to PND1, and also compared to Klf9–/– PND30 mice (which was not different from PND1 WT mice) [F(2,9) = 28.80, p = 0.0001]. The mean KLF9 ChIP signal at the Prkaca gene promoter was at background level (the level of the Klf9–/– PND30 mice) in WT PND1 and PND30 mice. (C) The KLF13 ChIP signal at the Klf16 gene promoter was greater in WT PND30 mice compared to PND1, and also compared to Klf13–/– PND30 mice [which was not different from WT PND1 mice; F(2,10) = 36.01, p < 0.0001]. The mean KLF13 ChIP signal at the Prkaca gene promoter in WT PND30 mice was greater than the level in WT PND1 and Klf13–/– PND30 mice [F(2,7) = 14.89, p = 0.003].
FIGURE 7
FIGURE 7
Forced expression of Klf9 or V5Klf13 block, while their deficiency enhances cAMP-dependent neurite-outgrowth in HT22 cells. We analyzed the effects of forced expression of Klf9 or V5Klf13 on cAMP-dependent neurite-outgrowth, or the effects of inactivation of the Klf9 or Klf13 genes using CRISPR/Cas9 genome editing on neurite outgrowth in HT22 cells. We estimated the length of neurites by calculating the ratio of the length of the longest neurite to the width of the soma of each cell analyzed. Bars represent the mean ± SEM (we analyzed > 100 cells/treatment from three independent experiments). (A) We treated HT22-TR-3 (control), TR/TO-Klf9 and TR/TO-V5Klf13-1 cells with vehicle or doxycycline (dox; 1 μg/ml) for 4 h, then added forskolin (FK; 25 μM) plus IBMX (250 μM) for 16 h before fixing cells for morphometric analysis. Shown are representative micrographs with graphs depicting quantification of neurites to the right. Treatment with FK + IBMX induced neurite outgrowth in each of the three cell lines; asterisks indicate statistically significant differences (p < 0.0001; Student’s independent t-test) between cells receiving vehicle (no dox) treated ± FK + IBMX. Treatment with dox had no effect on the response to FK + IBMX in HT22-TR-3 cells, but dox treatment completely blocked the response in HT22-TR/TO-Klf9 and HT22-TR/TO-V5Klf13-1 cells. Hashtags indicate statistically significant differences (p < 0.05; Student’s independent t-test) between vehicle and dox-treated cells that received FK + IBMX. (B) We treated HT22 Klf9-knockout (KO), Klf13-KO and Klf9/13-double-KO cells with vehicle or FK (25 μM) + IBMX (250 μM) for 16 h before fixing cells for morphometric analysis. Shown are representative micrographs with a graph depicting quantification of neurites at the bottom. Inactivation of Klf9, Klf13 or both genes increased the baseline neurite length compared with the HT22 parent cell line [F(3,514) = 15.63, p < 0.0001; one-way ANOVA followed by Tukey’s post hoc test]. Treatment with FK + IBMX increased neurite length in all four cell lines (p < 0.05, Student’s independent t-test), but neurite length was greater in the Klf13-KO and Klf9/13-double KO cells compared with the Klf9-KO and parental cell lines [F(3,589) = 24.13, p < 0.0001]. Means with the same letter are not significantly different (lowercase letters for vehicle treatment, uppercase letters for FK + IBMX treatment).
FIGURE 8
FIGURE 8
Forced expression of Klf9 or Klf13 inhibits axon growth, while inactivation of Klf9 or Klf13 enhances cAMP-dependent axon growth in primary hippocampal neurons. We analyzed the effects of forced expression of Klf9 or Klf13 on axon growth in primary hippocampal neurons isolated from PND1 wild type mice, and the effects of loss of Klf9 or Klf13 on baseline and forskolin (FK)-stimulated axon growth in primary hippocampal neurons isolated from WT, Klf9–/– and Klf13–/– mice. We conducted immunocytochemistry (ICC) using a monoclonal β-tubulin III antibody and measured β-tubulin-stained projections as described in the section “Materials and Methods.” (A) Representative images of primary hippocampal neurons isolated from WT mice and transfected with pTO-Egfp (control), pTO-Klf9 or pTO-Klf13 vectors. We cultured cells for 3 days after transfection before fixing for ICC. Scale bar = 50 μm. (B) Quantification of axon lengths of primary neurons transfected with the indicated vectors. Bars represent the mean ± SEM. Forced expression of Klf9 or Klf13 strongly suppressed axon growth [F(2,38) = 42.37, p < 0.0001; one-way ANOVA followed by Tukey’s post hoc test; we analyzed > 100 cells per culture, with n = 3/treatment]. Means with the same letter are not significantly different (p < 0.05). (C) Representative images of primary hippocampal neurons isolated from PND1 WT, Klf9–/– and Klf13–/– mice treated with vehicle or FK (5 μM) for 4 days before conducting ICC. Scale bars = 50 μm. (D) Quantification of axon lengths of primary hippocampal neurons treated with vehicle or FK. Bars represent the mean ± SEM; we analyzed > 100 cells per culture, with n = 3/treatment). The baseline axon length was greater in neurons from Klf13–/– mice compared with WT mice [F(2,483) = 17.29, p < 0.0001]. Axon growth was induced by FK treatment in neurons from all genotypes (p < 0.05, Student’s independent t-test), but the absolute axon length was greater in cells from Klf13–/– mice compared with WT or Klf9–/– mice [F(2,399) = 5.394, p = 0.0049]. Means with the same letter are not significantly different (p < 0.05) between vehicle (lowercase letters) or FK treatment (uppercase letters).
FIGURE 9
FIGURE 9
Proposed model for the repressive actions of KLF9 and KLF13 on cAMP-dependent neurite-outgrowth. Neurite-outgrowth is promoted by activation of the cAMP signaling pathway. Experimentally, we used forskolin to activate adenylate cyclase (AC) and 3-isobutyl-1-methylxanthine (IBMX) to inhibit phosphodiesterase. KLF9 and/or KLF13 repress the expression of several genes of the cAMP signaling pathway. Shown in the figure are the proteins that would be affected by KLF9 and KLF13 gene repression. Adenylate cyclase 6 (ADCY6), calmodulin 3 (CALM3), protein kinase A alpha subunit (PRKACA) and Rap guanine nucleotide exchange factor 3 (also known as EPAC1). CNGC: cyclic nucleotide gated channel; CaM: calmodulin; CaMKs: calmodulin-dependent kinases; PKA: protein kinase A; RAP1A: Ras-related protein 1a; RAF1: v-raf-leukemia viral oncogene 1; MEK: mitogen-activated protein kinase kinase; ERK1/2: extracellular signal-regulated kinases 1 and 2; CREB: cAMP response element-binding protein; CBP: CREB-binding protein; +p: phosphorylation.

References

    1. Apara A., Galvao J., Wang Y., Blackmore M., Trillo A., Iwao K., et al. (2017). KLF9 and JNK3 interact to suppress axon regeneration in the adult CNS. J. Neurosci. 37 9632–9644. 10.1523/JNEUROSCI.0643-16.2017 - DOI - PMC - PubMed
    1. Avci H. X., Lebrun C., Wehrlé R., Doulazmi M., Chatonnet F., Morel M.-P., et al. (2012). Thyroid hormone triggers the developmental loss of axonal regenerative capacity via thyroid hormone receptor α1 and Krüppel-like factor 9 in Purkinje cells. Proc. Natl. Acad. Sci. U.S.A. 109 14206–14211. 10.1073/pnas.1119853109 - DOI - PMC - PubMed
    1. Averaimo S., Nicol X. (2014). Intermingled cAMP, cGMP and calcium spatiotemporal dynamics in developing neuronal circuits. Front. Cell. Neurosci. 8:376. 10.3389/fncel.2014.00376 - DOI - PMC - PubMed
    1. Ávila-Mendoza J., Subramani A., Sifuentes C. J., Denver R. J. (2020). Molecular mechanisms for Krüppel-like factor 13 actions in hippocampal neurons. Mol. Neurobiol. 57 3785–3802. 10.1007/s12035-020-01971-w - DOI - PubMed
    1. Bagamasbad P., Ziera T., Borden S. A., Bonett R. M., Rozeboom A. M., Seasholtz A., et al. (2012). Molecular basis for glucocorticoid induction of the Krüppel-like factor 9 gene in hippocampal neurons. Endocrinology 153 5334–5345. 10.1210/en.2012-1303 - DOI - PMC - PubMed

LinkOut - more resources