Contribution of Stretch-Induced Force Enhancement to Increased Performance in Maximal Voluntary and Submaximal Artificially Activated Stretch-Shortening Muscle Action
- PMID: 33281623
- PMCID: PMC7689280
- DOI: 10.3389/fphys.2020.592183
Contribution of Stretch-Induced Force Enhancement to Increased Performance in Maximal Voluntary and Submaximal Artificially Activated Stretch-Shortening Muscle Action
Abstract
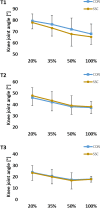
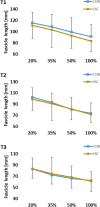
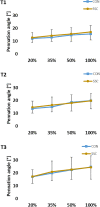
In everyday muscle action or exercises, a stretch-shortening cycle (SSC) is performed under different levels of intensity. Thereby, compared to a pure shortening contraction, the shortening phase in a SSC shows increased force, work, and power. One mechanism to explain this performance enhancement in the SSC shortening phase is, besides others, referred to the phenomenon of stretch-induced increase in muscle force (known as residual force enhancement; rFE). It is unclear to what extent the intensity of muscle action influences the contribution of rFE to the SSC performance enhancement. Therefore, we examined the knee torque, knee kinematics, m. vastus lateralis fascicle length, and pennation angle changes of 30 healthy adults during isometric, shortening (CON) and stretch-shortening (SSC) conditions of the quadriceps femoris. We conducted maximal voluntary contractions (MVC) and submaximal electrically stimulated contractions at 20%, 35%, and 50% of MVC. Isometric trials were performed at 20° knee flexion (straight leg: 0°), and dynamic trials followed dynamometer-driven ramp profiles of 80°-20° (CON) and 20°-80°-20° (SSC), at an angular velocity set to 60°/s. Joint mechanical work during shortening was significantly (p < 0.05) enhanced by up to 21% for all SSC conditions compared to pure CON contractions at the same intensity. Regarding the steady-state torque after the dynamic phase, we found significant torque depression for all submaximal SSCs compared to the isometric reference contractions. There was no difference in the steady-state torque after the shortening phases between CON and SSC conditions at all submaximal intensities, indicating no stretch-induced rFE that persisted throughout the shortening. In contrast, during MVC efforts, the steady-state torque after SSC was significantly less depressed compared to the steady-state torque after the CON condition (p = 0.034), without significant differences in the m. vastus lateralis fascicle length and pennation angle. From these results, we concluded that the contribution of the potential enhancing factors in SSCs of the m. quadriceps femoris is dependent on the contraction intensity and the type of activation.
Keywords: concentric; eccentric; elastic energy; electrical stimulation; force depression; force enhancement; muscular activation.
Copyright © 2020 Groeber, Stafilidis, Seiberl and Baca.
Figures


Similar articles
-
The effect of stretch-shortening magnitude and muscle-tendon unit length on performance enhancement in a stretch-shortening cycle.Sci Rep. 2021 Jul 16;11(1):14605. doi: 10.1038/s41598-021-94046-2. Sci Rep. 2021. PMID: 34272461 Free PMC article.
-
Unlocking the benefit of active stretch: the eccentric muscle action, not the preload, maximizes muscle-tendon unit stretch-shortening cycle performance.J Appl Physiol (1985). 2024 Aug 1;137(2):394-408. doi: 10.1152/japplphysiol.00809.2023. Epub 2024 Jun 27. J Appl Physiol (1985). 2024. PMID: 38932683
-
Residual force enhancement contributes to increased performance during stretch-shortening cycles of human plantar flexor muscles in vivo.J Biomech. 2018 Aug 22;77:190-193. doi: 10.1016/j.jbiomech.2018.06.003. Epub 2018 Jun 18. J Biomech. 2018. PMID: 29935734
-
The Contraction Modalities in a Stretch-Shortening Cycle in Animals and Single Joint Movements in Humans: A Systematic Review.J Sports Sci Med. 2019 Nov 19;18(4):604-614. eCollection 2019 Dec. J Sports Sci Med. 2019. PMID: 31827344 Free PMC article.
-
Evidence for Muscle Cell-Based Mechanisms of Enhanced Performance in Stretch-Shortening Cycle in Skeletal Muscle.Front Physiol. 2021 Jan 8;11:609553. doi: 10.3389/fphys.2020.609553. eCollection 2020. Front Physiol. 2021. PMID: 33488399 Free PMC article. Review.
Cited by
-
Modulation of stretch activation influences the stretch-shortening cycle effect in in vivo human knee extensors.Physiol Rep. 2025 May;13(10):e70377. doi: 10.14814/phy2.70377. Physiol Rep. 2025. PMID: 40375615 Free PMC article.
-
Effects of High-Intensity Interval Training With Specific Techniques on Jumping Ability and Change of Direction Speed in Karate Athletes: An Inter-individual Analysis.Front Physiol. 2021 Nov 18;12:769267. doi: 10.3389/fphys.2021.769267. eCollection 2021. Front Physiol. 2021. PMID: 34887776 Free PMC article.
-
Effects of 4 Weeks of a Technique-Specific Protocol with High-Intensity Intervals on General and Specific Physical Fitness in Taekwondo Athletes: An Inter-Individual Analysis.Int J Environ Res Public Health. 2021 Mar 31;18(7):3643. doi: 10.3390/ijerph18073643. Int J Environ Res Public Health. 2021. PMID: 33807435 Free PMC article.
-
Inter-Individual Variability of a High-Intensity Interval Training With Specific Techniques vs. Repeated Sprints Program in Sport-Related Fitness of Taekwondo Athletes.Front Physiol. 2021 Nov 17;12:766153. doi: 10.3389/fphys.2021.766153. eCollection 2021. Front Physiol. 2021. PMID: 34867471 Free PMC article.
-
Decoupling of muscle-tendon unit and fascicle velocity contributes to the in vivo stretch-shortening cycle effect in the male human triceps surae muscle.Physiol Rep. 2024 Dec;12(23):e70131. doi: 10.14814/phy2.70131. Physiol Rep. 2024. PMID: 39663152 Free PMC article.
References
-
- Arampatzis A., Karamanidis K., de Monte G., Stafilidis S., Morey-Klapsing G., Brüggemann G.-P. (2004). Differences between measured and resultant joint moments during voluntary and artificially elicited isometric knee extension contractions. Clin. Biomechan. (Bristol, Avon) 19 277–283. 10.1016/j.clinbiomech.2003.11.011 - DOI - PubMed
LinkOut - more resources
Full Text Sources

