. 2020 Nov 12:11:589005.
doi: 10.3389/fpls.2020.589005. eCollection 2020.

Elucidation of the miR164c-Guided Gene/Protein Interaction Network Controlling Seed Vigor in Rice

Affiliations

Elucidation of the miR164c-Guided Gene/Protein Interaction Network Controlling Seed Vigor in Rice

Kerui Huang et al. Front Plant Sci. .

Abstract

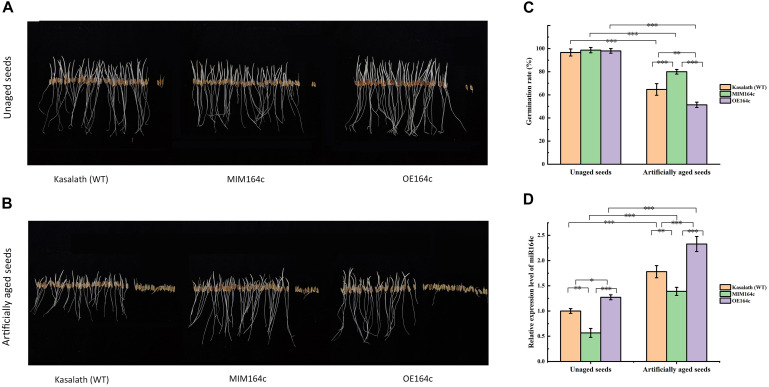
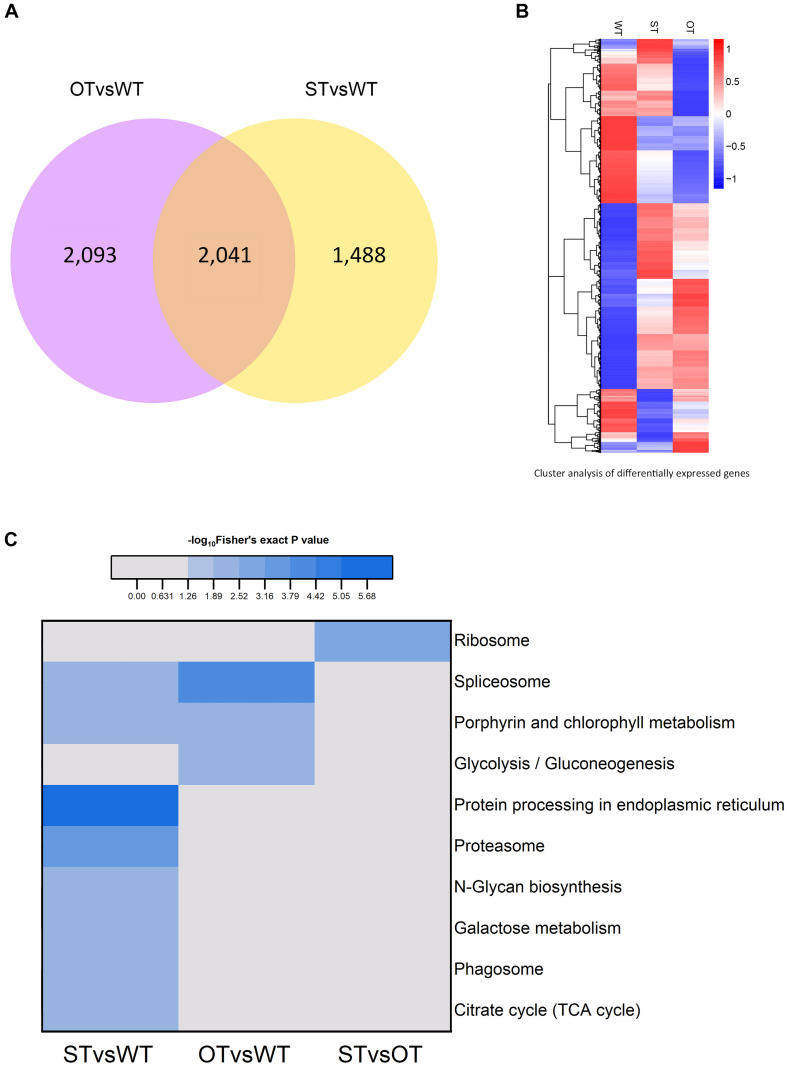
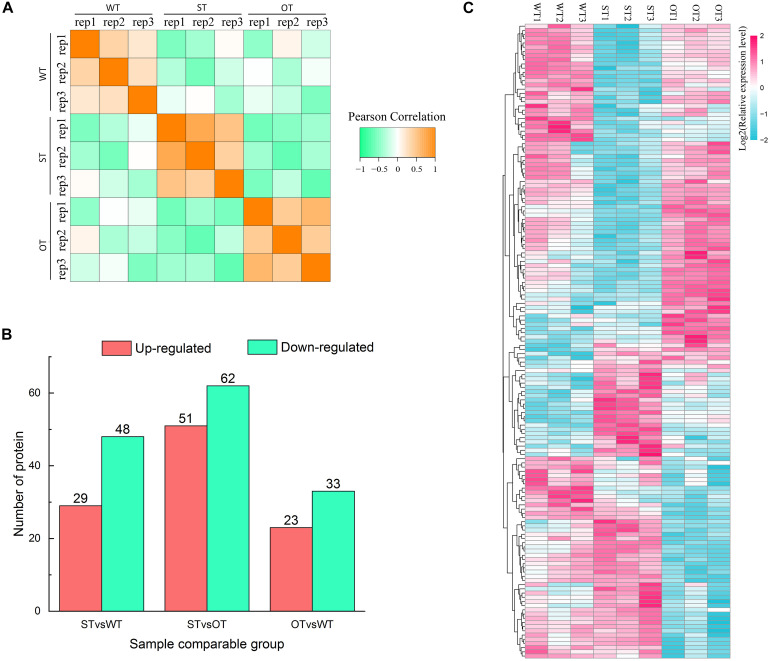
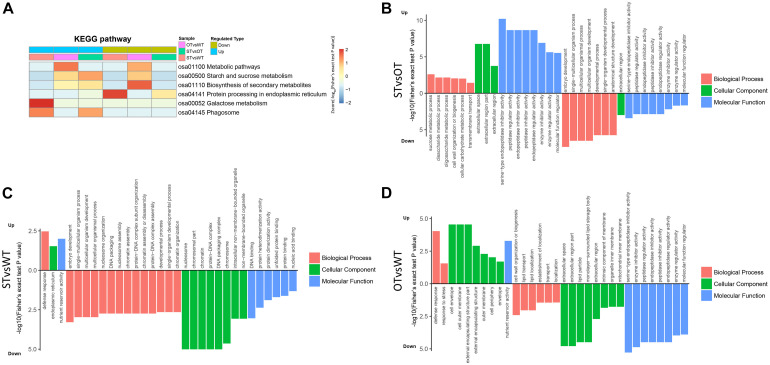
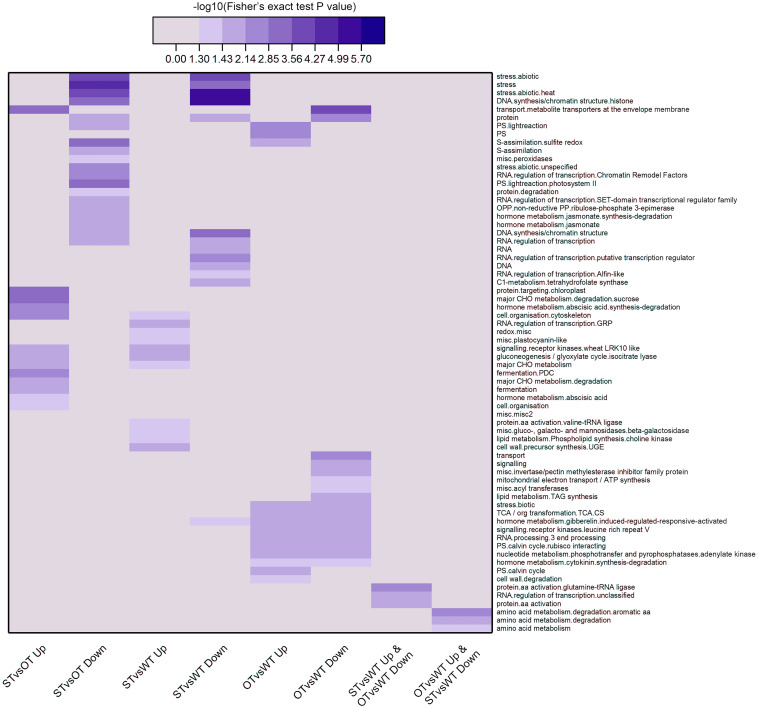
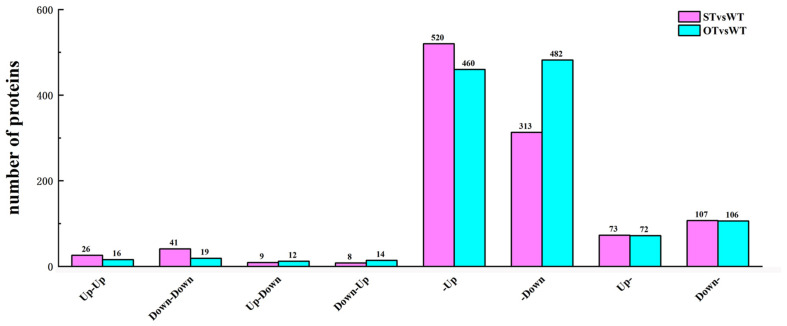
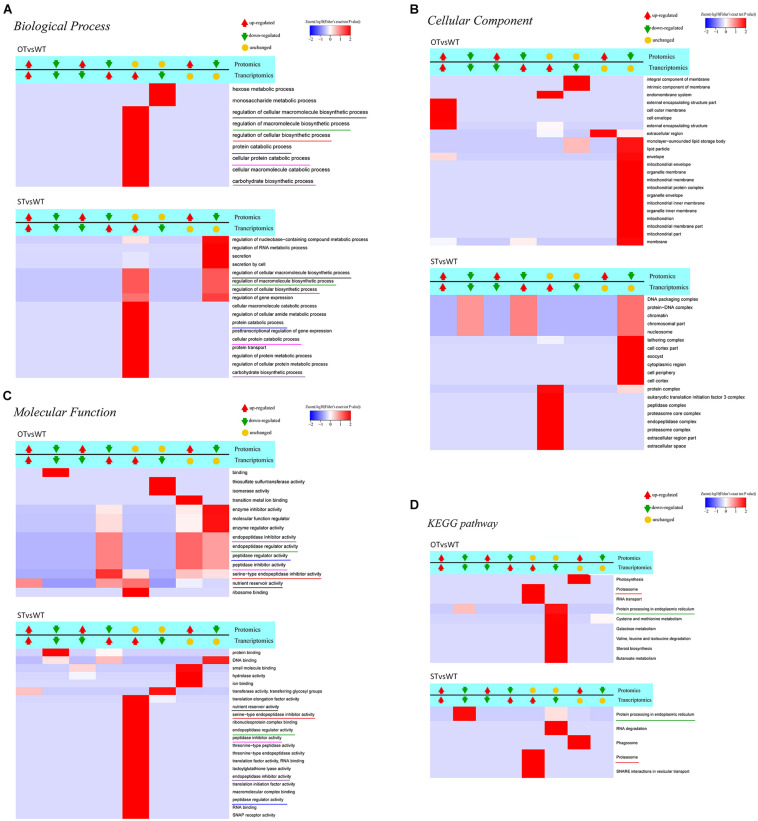
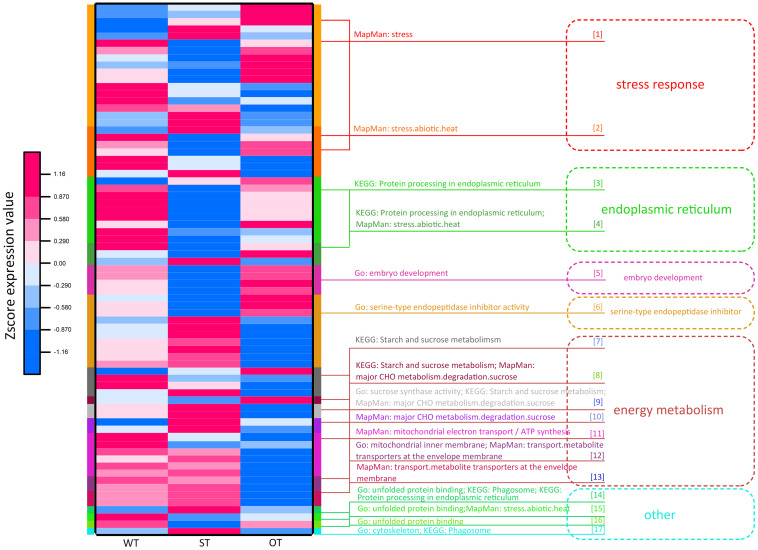
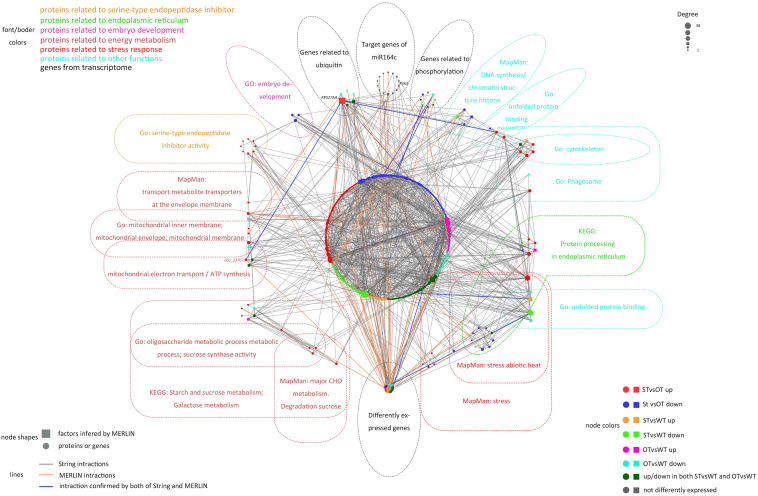
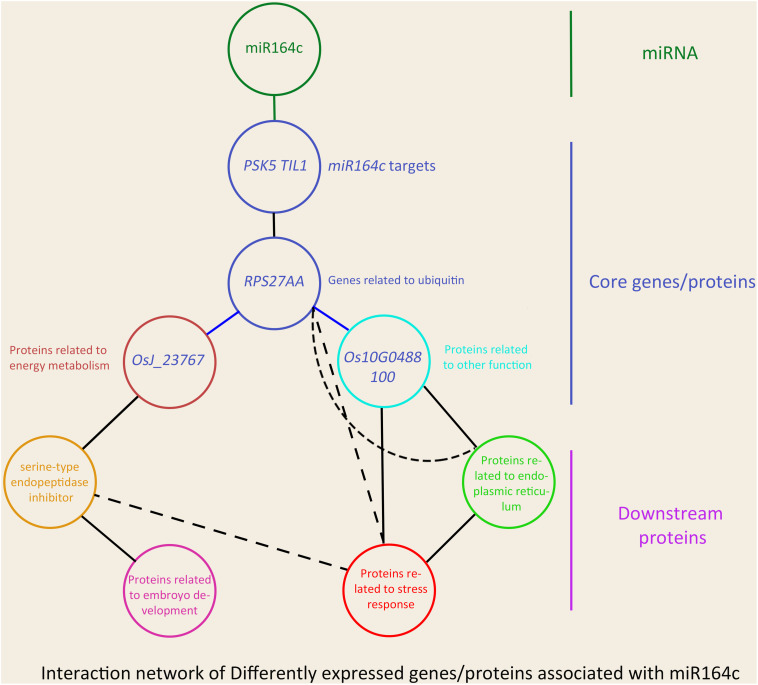
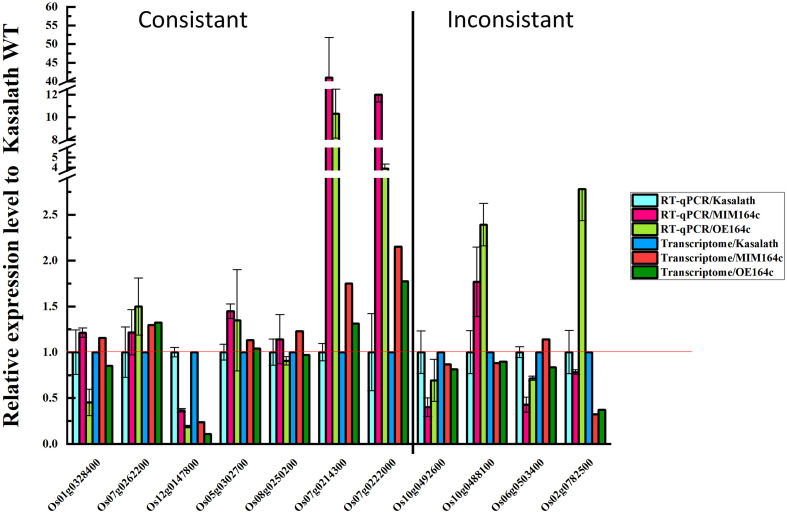
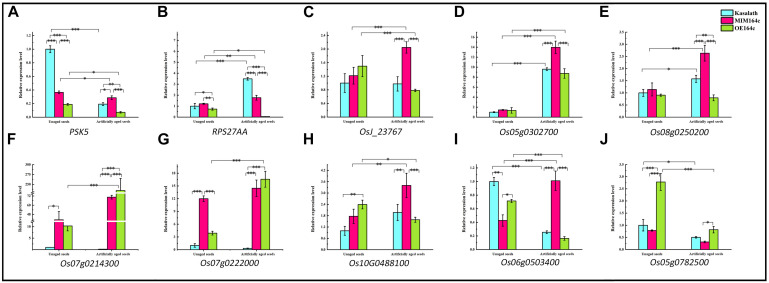
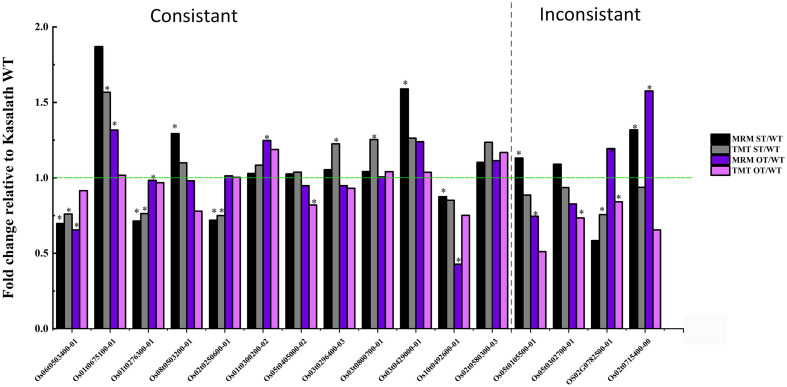
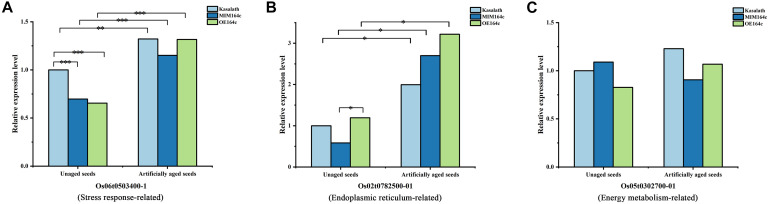
MicroRNAs (miRNAs) play important roles in various aspects of plant physiology and metabolism. The expression level of miR164c is negatively correlated with seed vigor in rice (Oryza sativa L.); however, the mechanism of seed vigor regulation by miR164c remains unknown. Anti-aging capacity is an important indicator of seed vigor. Here, we report an miR164c-guided gene/protein interaction network that regulates the anti-aging ability of rice seeds. Seeds of the wild-type (WT) rice cultivar "Kasalath" and its transgenic derivatives, miR164c-silenced line (MIM164c) and miR164c overexpression line (OE164c), with significant differences in anti-aging capacity, showed significant differences in gene and protein expression levels. The differentially expressed genes (DEGs) or proteins were significantly enriched in six metabolic functional categories related to seed vigor, including "stress response," "protein processing in endoplasmic reticulum (ER)," "embryo development," "serine-type endopeptidase inhibitor," "energy metabolism," and "other." Differences in the expression levels of genes or proteins related to energy metabolism, serine endopeptidase, and stress response in seeds under normal storage conditions may be associated with anti-aging capacity. The results of gene/protein interaction analyses suggest that miR164c first targets PSK5, and the PSK5 protein then interacts with the ubiquitin-associated gene RPS27AA, which simultaneously impacts the genes/proteins in the six above-mentioned functional categories. Expression levels of some of the key genes and proteins in the interaction network were verified by real-time fluorescence quantitative PCR (RT-qPCR) and multiple reaction monitoring mass spectrometry (MRM-MS), respectively. Thus, the present study provides new insights into the miRNA-mediated gene and protein interaction network that regulates seed vigor.

Keywords: Oryza sativa L.; miR164c; proteome; regulatory network; seed vigor; transcriptome.


Figures

FIGURE 1
FIGURE 1
Analysis of seed morphological phenotypes and miR164c expression levels in the seeds of the wild-type rice cultivar “Kasalath” (WT), miRNA164c-silenced line (MIM164c; ST), and miR164c overexpression line (OE164c; OT) before and after artificial aging. (A,B) Morphological phenotypes of germinating seeds. (C) Seed germination rates. (D) miR164c expression levels. Photographs shown in A and B were taken on the third day of germination. Data represent mean ± SD (n = 3). Significant differences in seed germination rates and miR164c expression levels among the different rice genotypes were determined using Tukey’s test (P < 0.05, ∗∗P < 0.01, ∗∗∗P < 0.001). In D, the expression level of miR164c in unaged WT seeds was defined as 1.
FIGURE 2
FIGURE 2
Analysis of the transcriptome of ST and OT seeds relative to that of WT seeds (three biological replicates per genotype). (A) Venn diagram. (B) Cluster analysis. In B, the greater the intensity of the red color, the higher the gene expression; and the greater the intensity of the blue color, the lower the gene expression. (C) Heat map showing the results of KEGG pathway enrichment analysis of genes differentially expressed between WT, MIM164c (ST), and OE164c (OT) seeds.
FIGURE 3
FIGURE 3
Proteome analysis of WT, ST, and OT seeds (three biological replicates per genotype). (A) Reproducibility of the proteome data. (B) Number of DEPs. (C) Cluster analysis of DEPs.
FIGURE 4
FIGURE 4
Heat map showing the results of KEGG and GO enrichment analyses of DEPs in WT, ST, and OT seeds. (A) KEGG enrichment analysis. The greater the intensity of the red color, the greater the degree of enrichment. GO enrichment analyses of DEGs identified in STvsOT (B), STvsWT (C), and OTvsWT (D) comparisons.
FIGURE 5
FIGURE 5
Clustering analysis of the results of MapMan pathway enrichment of genes corresponding to the DEPs identified in the WT, ST, and OT seeds. The darker the color, the more significant the degree of enrichment. The DEPs were selected based only on fold-change (FC > 1.3 or < 1/1.3), and not on the basis of the P-value.
FIGURE 6
FIGURE 6
Number of DEGs/DEPs in each of the eight transcriptome–proteome correlation categories. Up-Up: up-regulated in both proteome and transcriptome; Down-Down: down-regulated in both proteome and transcriptome; Up-Down: up-regulated in proteome and down-regulated in transcriptome; Down-Up: down-regulated in proteome and up-regulated in transcriptome; -Up: unchanged in proteome and up-regulated in transcriptome; -Down: unchanged in proteome and down-regulated in transcriptome; Up-: up-regulated in proteome and unchanged in transcriptome; Down-: down-regulated in proteome and unchanged in transcriptome.
FIGURE 7
FIGURE 7
Clustering analysis of the results of functional enrichment of DEGs/DEPs identified by transcriptome–proteome correlation analysis. The common GO terms and KEGG pathways in the STvsWT and OTvsWT groups are underlined by the same color. The darker the red color, the more significant the degree of enrichment. (A–C) The GO categories Biological Process, Cellular Component, and Molecular Function, respectively. (D) represents the KEGG pathway enrichment of DEGs.
FIGURE 8
FIGURE 8
Functional cluster heat map showing the expression levels of DEPs in WT, ST, and OT seeds.
FIGURE 9
FIGURE 9
Interaction between miR164c target genes and DEGs/DEPs identified in the transcriptome and proteome of WT, ST, and OT seeds. Colors of different boxes and the text within each box represent the major functional categories of genes or proteins. Colored nodes represent different types of regulation. Node shapes represent different types of genes or proteins. The node size represents the degree of nodes; the bigger the node size, the higher the degree. DEPs were identified based on the value of FC alone (>1.3 or <1/1.3). DEGs were identified using thresholds for FC (>1.2 or <1/1.2) as well as the P-value (<0.05).
FIGURE 10
FIGURE 10
Schematic showing the effect of miR164c on rice seed vigor via RPS27AA in the functional gene/protein interaction network. Solid straight lines represent strong interaction, and dashed lines represent weak interaction. The color of the outer frame of each node is the same as that of the functional proteins in Figure 9. Blue lines represent the interactions confirmed both by the MERLIN algorithm and String database.
FIGURE 11
FIGURE 11
Validation of the RNA-seq data of 11 DEGs by RT-qPCR. Data represent mean ± SD (n = 3).
FIGURE 12
FIGURE 12
RT-qPCR assay of the expression level of 10 genes in WT, ST, and OT seeds before and after artificial aging. (A–C,H) Core genes in the interaction network in Figure 9. (C–E) Genes related to energy metabolism. (F,G) Genes corresponding to serine-type endopeptidase inhibitors. (H–J) Stress-related genes. Data represent mean ± SD (n = 3). Significant differences in gene expression levels among the three rice genotypes were determined by Tukey’s test (P < 0.05, ∗∗P < 0.01, ∗∗∗P < 0.001). The expression level of each gene in unaged WT seeds was defined as 1.
FIGURE 13
FIGURE 13
Comparison of the quantitative data of 16 rice seed proteins between MRM-MS and TMT assays. Data represent the mean of three technical replicates. Asterisk () indicates the significant difference (a linear mixed-effects model was used for MRM data and a paired t-test for TMT data) in the protein expression level between transgenic and WT seeds (P < 0.05). The expression level of each protein in WT seeds was defined as 1.
FIGURE 14
FIGURE 14
Quantitative results of three key proteins in aged and unaged WT, ST, and OT seeds by MRM-MS. Data represent the mean of three technical replicates. A linear mixed-effects model was used to determine significant differences in protein expression levels among the three rice genotypes (P < 0.05, ∗∗P < 0.01, ∗∗∗P < 0.001). The expression level of each protein in unaged WT seeds was defined as 1.

References

    1. Aragão V. P. M., Trindade B. M. C., Reis R. S., Silveira V., Santa-Catarina C. (2019). Storage time affects the germination and proteomic profile of seeds of Cariniana legalis (Mart.) O. Kuntze (Lecythidaceae), an endangered tree species native to the Brazilian Atlantic Forest. Braz. J. Bot. 42 407–419. 10.1007/s40415-019-00551-0 - DOI
    1. Arc E., Ogé L., Grappin P., Rajjou L. (2011). Plant Seed: A Relevant Model to Study Aging Processes. Trivandrum: Transworld Research Network.
    1. Bartel D. P. (2009). MicroRNAs: target recognition and regulatory functions. Cell 136 215–233. 10.1016/j.cell.2009.01.002 - DOI - PMC - PubMed
    1. Bartel D. P. (2018). Metazoan MicroRNAs. Cell 173 20–51. 10.1016/j.cell.2018.03.006 - DOI - PMC - PubMed
    1. Bernales S., Soto M. M., Mccullagh E. (2012). Unfolded protein stress in the endoplasmic reticulum and mitochondria: a role in neurodegeneration. Front. Aging Neurosci. 4:5. 10.3389/fnagi.2012.00005 - DOI - PMC - PubMed

LinkOut - more resources