. 2020 Nov 24;9(11):e1213.
doi: 10.1002/cti2.1213. eCollection 2020.

Porphyromonas gingivalis and Lactobacillus rhamnosus GG regulate the Th17/Treg balance in colitis via TLR4 and TLR2

Affiliations

Porphyromonas gingivalis and Lactobacillus rhamnosus GG regulate the Th17/Treg balance in colitis via TLR4 and TLR2

Lu Jia et al. Clin Transl Immunology. .

Abstract

Objectives: CD4+ T cells are the key to many immune-inflammatory diseases mediated by microbial disorders, especially inflammatory bowel disease (IBD). The purpose of this study was to explore how pathogenic and probiotic bacteria directly affect the T helper (Th)17 and T regulatory (Treg) cell balance among CD4+ T cells to regulate inflammation.

Methods: Porphyromonas gingivalis (Pg; ATCC 33277) and Lactobacillus rhamnosus GG (LGG; CICC 6141) were selected as representative pathogenic and probiotic bacteria, respectively. Bacterial extracts were obtained via ultrasonication and ultracentrifugation. Flow cytometry, RT-qPCR, ELISAs, immunofluorescence and a Quantibody cytokine array were used. The dextran sodium sulphate (DSS)-induced colitis model was selected for verification.

Results: The Pg ultrasonicate induced the apoptosis of CD4+ T cells and upregulated the expression of the Th17-associated transcription factor RoRγt and the production of the proinflammatory cytokines IL-17 and IL-6, but downregulated the expression of the essential Treg transcription factor Foxp3 and the production of the anti-inflammatory factors TGF-β and IL-10 via the TLR4 pathway. However, LGG extract maintained Th17/Treg homeostasis by decreasing the IL-17+ Th17 proportion and increasing the CD25+ Foxp3+ Treg proportion via the TLR2 pathway. In vivo, Pg-stimulated CD4+ T cells aggravated DSS-induced colitis by increasing the Th17/Treg ratio in the colon and lamina propria lymphocytes (LPLs), and Pg + LGG-stimulated CD4+ T cells relieved colitis by decreasing the Th17/Treg ratio via the JAK-STAT signalling pathway.

Conclusions: Our findings suggest that pathogenic Pg and probiotic LGG can directly regulate the Th17/Treg balance via different TLRs.

Keywords: Lactobacillusrhamnosus GG; Porphyromonasgingivalis; Th17; Treg; colitis; toll‐like receptor.


Conflict of interest statement

The authors declare no conflict of interest.

Figures

Figure 1
Figure 1
LGG ultrasonicate reverses the proapoptotic effect and Th17/Treg imbalance induced by Pg extract in activated CD4+ T cells. Primary CD4+ T cells were activated by anti‐CD3 and anti‐CD28 antibodies, and a 50 μg mL−1 final concentration of LGG or Pg ultrasonicate alone or in combination (Pg + LGG) was added to the culture medium for 48 h prior to detection of cell proliferation and apoptosis and the proportion of Th17 and Treg cells in the system. Th17 cells were characterised as CD4+ IL‐17+ cells, and Treg cells were characterised as CD4+ CD25+ Foxp3+ cells. (a) Peak patterns were detected via flow cytometry after CFSE labelling, and (b) cell proliferation in each group was analysed. (c) Late apoptosis rate represented by Annexin V and PI double‐positive staining and the statistical analysis (d). (e, f) The proportion of CD4+ IL‐17+ Th17 cells and (g, h) the percentage of CD4+ CD25+ Foxp3+ Treg cells among the total CD4+ T cells in each group were detected via flow cytometry and statistically analysed. The data represent three repeated independent experiments and are shown as the mean ± SD (Bonferroni’s multiple comparisons test; *P < 0.05; ***P < 0.001; NS, no significant difference).
Figure 2
Figure 2
Pg ultrasonicate upregulates the Th17 transcription factor and cytokines and downregulates the Treg transcription factor and cytokines via the TLR4 pathway. TLR4 or TLR2 blocking antibodies were used to pretreat CD4+ T cells for 2 h; then, the bacterial extract was added. Target gene expression was measured by the fold change relative to the internal reference gene GAPDH. The culture supernatant of CD4+ T cells stimulated with the bacterial ultrasonicate for 5 days was used for ELISA detection. (a) Gene expression and (c) protein secretion of the Th17‐related cytokines IL‐17 and IL‐6 were detected via RT‐qPCR and ELISA, respectively. (b) Gene expression and (d) protein secretion of the Treg‐secreted cytokines TGF‐β and IL‐10 were detected via RT‐qPCR and ELISA, respectively. (e) Gene expression of RoRγt (the essential transcription factor for Th17 differentiation) and Foxp3 (the transcription factor necessary for Treg differentiation) in each group after coculture for 24 h was investigated via RT‐qPCR. (f) Schematic diagram of Pg ultrasonicate‐induced increase in the Th17/Treg ratio mediated by TLR4. The data represent three repeated independent experiments and are shown as the mean ± SD (Bonferroni’s multiple comparisons test; *P < 0.05; **P < 0.01; ***P < 0.001; NS, no significant difference).
Figure 3
Figure 3
Pg extract upregulates RoRγt, IL‐17 and IL‐6 expression but downregulates Foxp3, TGF‐β and IL‐10 expression through TLR4, which was reversed by LGG ultrasonicate via TLR2. A TLR2 or TLR4 antagonist was added to the mixed Pg + LGG extract‐stimulated CD4+ T cells as mentioned above to detect the gene expression and protein secretion of Th17/Treg‐related transcription factors and cytokines. The gene expression of the Th17‐related cytokines IL‐17 and IL‐6 (a) and Treg‐secreted cytokines TGF‐β and IL‐10 (b) was detected by RT‐qPCR after coculture with the microbial ultrasonicate for 24 h. (c, d) Protein secretion of IL‐17, IL‐6, TGF‐β and IL‐10 in the cell culture supernatant was detected by ELISA after coculture for 5 days. (e) Gene expression of RoRγt (essential transcription factor for Th17 differentiation) and Foxp3 (necessary transcription factor for Treg differentiation) in each group was investigated via RT‐qPCR. (f) Schematic diagram of LGG ultrasonicate‐induced reduction in the Th17/Treg balance mediated by TLR2 after the balance was disrupted by Pg. The expression of target genes was measured as the fold change relative to the internal reference gene GAPDH. The data represent three repeated independent experiments and are shown as the mean ± SD (Bonferroni’s multiple comparisons test; *P < 0.05; **P < 0.01; ***P < 0.001).
Figure 4
Figure 4
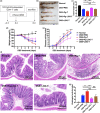
Pg extract‐stimulated CD4+ T cells aggravated and balanced Pg + LGG‐stimulated CD4+ T cells alleviated DSS‐induced colitis. Acute colitis was induced in C57BL/6 mice through administration of 3% DSS (w/v) in the drinking water for 7 days; the mice were executed on the eighth day. CD4+ T cells stimulated with different bacterial ultrasonicates were injected intravenously into the mice (1 × 106 cells per mouse, n = 5) two days before DSS was administered, and the mice were grouped accordingly into the DSS + PBS group, DSS + Pg‐T group, DSS + Pg‐LGG‐T group or DSS + LGG‐T group. Mice in the normal group were given normal drinking and no injection. (a) Technical schematic for injection of different microbial extract‐stimulated CD4+ T cells into DSS‐induced colitis mice. (b) General view of representative colons and (c) statistical analysis of colon length in each group at day 8. (d) Weight changes and (e) DAI scores of mice were recorded daily and statistically analysed during the DSS administration period. (f) H&E staining of representative colons and (g) corresponding HAI scores evaluated in each group. Magnification × 100; scale bar = 250 µm. The data are shown as the mean ± SD (Bonferroni’s multiple comparisons test; *P < 0.05; **P < 0.01; ***P < 0.001; ****P < 0.0001; NS, no significant difference).
Figure 5
Figure 5
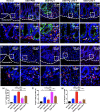
Reinfusion of Pg extract‐stimulated CD4+ T cells upregulated the Th17/Treg ratio in the colon in situ; reinfusion of Pg + LGG extract‐stimulated CD4+ T cells downregulated the Th17/Treg ratio in the colon in situ. DSS‐induced colitis mice were injected via the caudal vein with different microbial extract‐stimulated CD4+ T cells. (a) The CD3+ IL‐17+ Th17 cells and (c) the CD3+ Foxp3+ Treg cells in the colons of mice in each group were visualised in situ via IF staining. Red for CD3; green for IL‐17 or Foxp3; and blue for DAPI. Magnification × 200; scale bar = 100 µm. Local high‐power field (HPF) showing (b) CD3+ IL‐17+ Th17 cells and (d) CD3+ Foxp3+ Treg cells. Magnification × 400; scale bar = 20 µm. The (e) CD3+ IL‐17+ Th17 cell and (f) CD3+ Foxp3+ Treg cell positivity rate and (g) the corresponding Th17/Treg ratio in five random HPFs were statistically analysed using ImageJ software. The data are shown as the mean ± SD (Bonferroni’s multiple comparisons test; *P < 0.05; **P < 0.01; ***P < 0.001; NS, no significant difference).
Figure 6
Figure 6
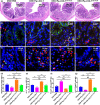
Reinfusion of TLR2‐blocked Pg + LGG extract‐stimulated CD4+ T cells upregulated the Th17/Treg ratio in the colon in situ; reinfusion of TLR4‐blocked Pg + LGG extract‐stimulated CD4+ T cells did not affect the Th17/Treg ratio. Pg + LGG extract‐stimulated CD4+ T cells or Pg + LGG‐stimulated CD4+ T cells treated with TLR2/TLR4 antagonists were injected into DSS‐induced colitis mice via the caudal vein. The mice were grouped accordingly into the DSS + PBS group, DSS + Pg‐LGG‐T group, DSS + Pg‐LGG‐Tanti‐TLR2 group or DSS + Pg‐LGG‐Tanti‐TLR4 group. (a) H&E staining of representative colons and (d) corresponding HAI scores evaluated in each group. Magnification × 100; scale bar = 250 µm. Local high‐power field (HPF) showing (b) CD3+ IL‐17+ Th17 cells and (c) CD3+ Foxp3+ Treg cells with IF staining. Red for CD3; green for IL‐17 or Foxp3; and blue for DAPI. Magnification × 400; scale bar = 20 µm. The positive rate of (e) CD3+ IL‐17+ Th17 cells and (f) CD3+ Foxp3+ Treg cells and (g) the corresponding Th17/Treg ratio were statistically analysed in five random HPFs using ImageJ software. The data are shown as the mean ± SD (Bonferroni’s multiple comparisons test; *P < 0.05; **P < 0.01; ***P < 0.001; NS, no significant difference).
Figure 7
Figure 7
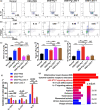
Microbial extract‐treated CD4+ T cells regulated the Th17/Treg ratio in colitis via the JAK‐STAT signalling pathway. DSS‐induced colitis mice were injected via the caudal vein with different microbial extract‐stimulated CD4+ T cells or PBS (grouped as DSS + PBS, DSS + Pg‐T, DSS + Pg‐LGG‐T and DSS + LGG‐T). (a, c) The proportion of CD4+ IL‐17+ Th17 cells and (b, d) the percentage of CD4+ CD25+ Foxp3+ Treg cells among LPLs in each group were detected via flow cytometry and statistically analysed. The normal group included mice without DSS or T‐cell injection. (e) The relative Th17‐to‐Treg cell ratio in each experimental group was calculated and statistically analysed. (f) The differentially expressed cytokines involved in Th17 cell differentiation in the colons after injection of microbial extract‐treated CD4+ T cells were identified with a Quantibody cytokine array, and (g) KEGG pathway enrichment analysis was performed to identify key pathways regulating the Th17/Treg balance. The data represent three repeated independent experiments and are shown as the mean ± SD (Bonferroni’s multiple comparisons test; *P < 0.05; **P < 0.01; ***P < 0.001; NS, no significant difference).
Figure 8
Figure 8
Microbial extract‐stimulated CD4+ T cells regulated the Th17/Treg ratio based on the local cytokine milieu they encountered but not on migration of the cells. (a, b) The proportion of CD4+ cells among colonic lamina propria lymphocytes (LPLs), mesenteric lymph node (MLN) cells and splenic lymphocytes (SPLs) in each group was detected via flow cytometry and statistically analysed after Pg extract‐stimulated CD4+ T cells or PBS was injected into DSS‐induced colitis nude mice via the caudal vein (grouped as Nude + DSS+Pg‐T and Nude + DSS + PBS). The protein secretion of the Th17‐related cytokines IL‐17 and IL‐6 and the Treg‐secreted cytokines TGF‐β and IL‐10 was detected via ELISA in (c) the colonic homogenate and (d) in serum, respectively. The data represent three repeated independent experiments and are presented as the mean ± SD (Bonferroni’s multiple comparisons test; **P < 0.01; NS, no significant difference).

References

    1. Maekawa T, Krauss JL, Abe T et al Porphyromonas gingivalis manipulates complement and TLR signaling to uncouple bacterial clearance from inflammation and promote dysbiosis. Cell Host Microbe 2014; 15: 768–778. - PMC - PubMed
    1. Thapa B, Pak S, Kwon HJ et al Decursinol angelate ameliorates dextran sodium sulfate‐induced colitis by modulating type 17 helper T cell responses. Biomol Ther (Seoul) 2019; 27: 466–473. - PMC - PubMed
    1. Lin X, Sun Q, Zhou L et al Colonic epithelial mTORC1 promotes ulcerative colitis through COX‐2‐mediated Th17 responses. Mucosal Immunol 2018; 11: 1663–1673. - PubMed
    1. Shen H, Shi LZ. Metabolic regulation of TH17 cells. Mol Immunol 2019; 109: 81–87. - PMC - PubMed
    1. Ouyang W, Kolls JK, Zheng Y. The biological functions of T helper 17 cell effector cytokines in inflammation. Immunity 2008; 28: 454–467. - PMC - PubMed

LinkOut - more resources