. 2020 Oct 6;11(11):6093-6107.
doi: 10.1364/BOE.403283. eCollection 2020 Nov 1.

Analysis of attenuation coefficient estimation in Fourier-domain OCT of semi-infinite media

Affiliations

Analysis of attenuation coefficient estimation in Fourier-domain OCT of semi-infinite media

Babak Ghafaryasl et al. Biomed Opt Express. .

Abstract

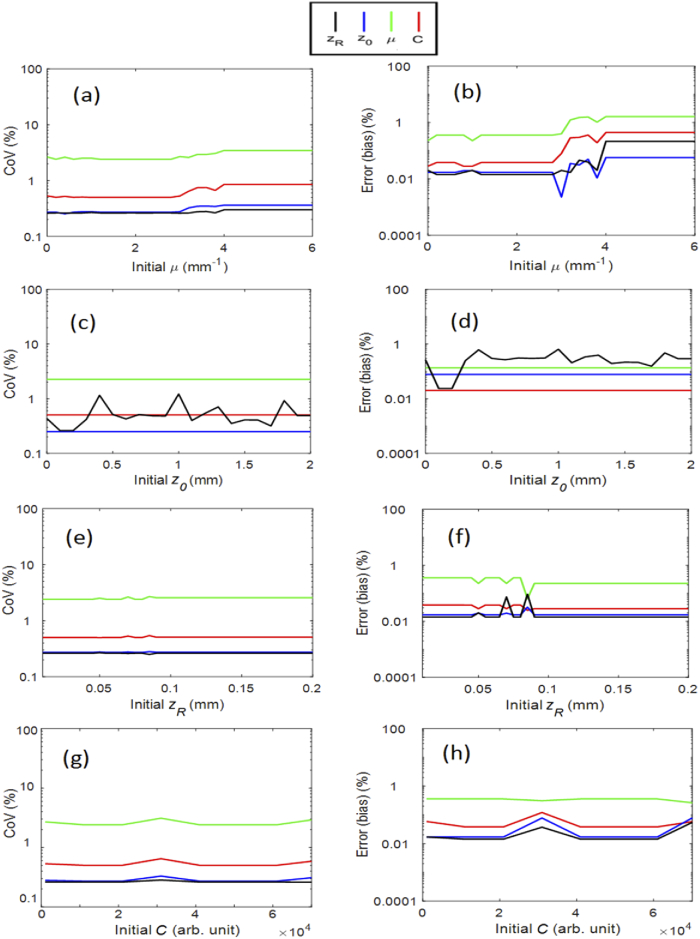
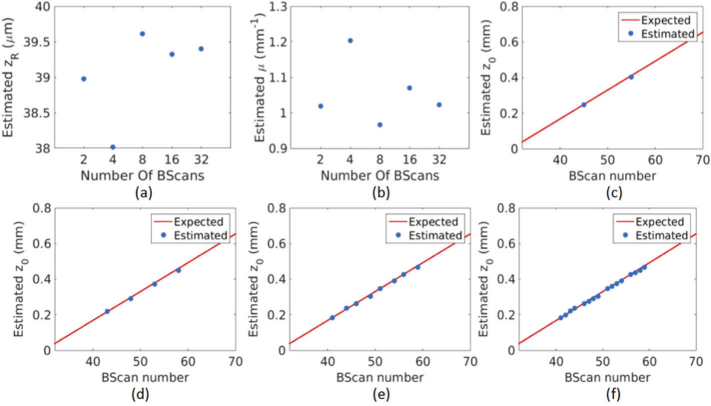
The attenuation coefficient (AC) is an optical property of tissue that can be estimated from optical coherence tomography (OCT) data. In this paper, we aim to estimate the AC accurately by compensating for the shape of the focused beam. For this, we propose a method to estimate the axial PSF model parameters and AC by fitting a model for an OCT signal in a homogenous sample to the recorded OCT signal. In addition, we employ numerical analysis to obtain the theoretical optimal precision of the estimated parameters for different experimental setups. Finally, the method is applied to OCT B-scans obtained from homogeneous samples. The numerical and experimental results show accurate estimations of the AC and the focus location when the focus is located inside the sample.


Conflict of interest statement

The authors declare no conflicts of interest.

Figures

Fig. 1.
Fig. 1.
(a) The simulated single (blue) and averaged (red) OCT signals distorted by intensity-dependent Gaussian noise as a function of depth in physical distance. The averaged OCT signal was obtained by averaging over 500 single A-lines. (b) rCRLB values after averaging 1 to 1000 A-lines. The model parameter were set to z0 = 160 µm, µ = 0.72mm1,C = 2.5×10⁴, and zR = 42 µm.
Fig. 2.
Fig. 2.
rCRLB matrices for models with intensity-dependent Gaussian noise. The model parameters were set to z0 = 160 µm, µ = 0.72mm1,C = 2.5×10⁴, and zR = 42 µm.
Fig. 3.
Fig. 3.
The diagonal elements of the rCRLB matrices for the seven models (M1…M7) as shown in Table 1.
Fig. 4.
Fig. 4.
The error (%) of the estimated model parameters obtained from the diagonal elements of the rCRLB matrix for: a) zR = 42 µm, µ = 0.72 mm−1, C = 2.5×10⁴ and z0 = [−0.2,0.9] mm ; b) z0 = 160 µm inside the sample, µ = 0.72 mm−1, C = 2.5×10⁴ and zR = [0.01,0.5] mm; c) zR = 42 µm, z0 = 160 µm inside the sample, C = 2.5×10⁴ and µ= [0.01,8] mm−1 ; d) zR = 42 µm, z0 = 160 µm, µ = 0.72 mm−1 inside the sample and C = [102,106] (arb. units). The vertical dashed lines indicate the parameter values, which were set in the simulations and also were considered to be fixed for the other plots in this figure.
Fig. 5.
Fig. 5.
The coefficient of variation (CoV) (left column) and bias of the estimated parameters (right column) using the proposed method obtained from 100 simulated OCT signals, when initial parameter values are set to: a-b) 0 mm−1 ≤ µ ≤ 6 mm−1, zR=50 µm, C = 2×10⁴ (arb. unit), and z0=1mm ; c-d) 0mmz02mm, µ = 1 mm−1, zR=50 µm, and C = 2×10⁴ (arb. unit); e-f) 0.01 mm ≤zR ≤ 0.2 mm, µ = 1 mm−1, C = 2×10⁴ (arb. unit), and z0=1 mm, and g-h) 103 ≤ C ≤ 7×10⁴ (arb. unit), µ = 1 mm−1, zR=50 µm, and z0=1 mm. The simulated model parameters were set to zR = 42 µm, C = 2.5×10⁴ (arb. unit), µ = 0.72 mm−1 and z0=0.16mm.
Fig. 6.
Fig. 6.
Monte Carlo simulation results: a) the coefficient of variation (CoV) of the estimated parameters (solid lines) for 500 measurements and Cramer-Rao lower bounds (dashed lines); and (b) bias of the estimated parameters as a function of focus location inside the medium.
Fig. 7.
Fig. 7.
a) A B-scan of 0.05 wt. % TiO2 in siliconewith adjusted focus location at 0.26 mm from the adjusted focus on the surface; b) The averaged A-lines (from the aquired B-scans per focus position) as a function of focus position; c) Averaged OCT signals (circles) along data-points located at 63 µm inside the sample (dashed lines in (a)) with the best fitted focus model.
Fig. 8.
Fig. 8.
The result of fitting the constrained model (blue) to the averaged A-lines per B-scan (red) obtained from the sample with 0.05 wt. % TiO2 in silicone for eight different focus positions {−0.5, −0.3, −0.1, 0.15, 0.3, 0.45, 0.6, 0.75} mm from left to right. The location of the estimated focus (within the shown depth range) is indicated by the vertical dashed line.
Fig. 9.
Fig. 9.
The estimated model parameters as a function of focus position obtained averaged A-lines per B-scan acquired from the sample with 0.05 wt. % TiO2 in silicone. The vertical red dashed lines indicate the B-scan in which the focus was on the sample’s surface.
Fig. 10.
Fig. 10.
Estimated model parameters: (a) zR and (b) µ, obtained from the averaged A-lines of 2, 4, 8 and 16 B-Scans acquired at different focus positions inside the sample with 0.05 wt. % TiO2 in silicone. The estimated and expected z0 are shown for the combinations of (c) 2, (d) 4, (e) 8, and (f) 16 B-Scans, i.e. focus locations.

References

    1. Vermeer K. A., van der Schoot J., Lemij H. G., de Boer J. F., “RPE-normalized RNFL attenuation coefficient maps derived from volumetric OCT imaging for glaucoma assessment,” Invest. Ophthalmol. Visual Sci. 53(10), 6102–6108 (2012).10.1167/iovs.12-9933 - DOI - PubMed
    1. McLaughlin R. A., Scolaro L., Robbins P., Saunders C., Jacques S. L., Sampson D. D., “Parametric imaging of cancer with optical coherence tomography,” J. Biomed. Opt. 15(4), 046029 (2010).10.1117/1.3479931 - DOI - PubMed
    1. Barwari K., de Bruin D. M., Cauberg E. C., Faber D. J., van Leeuwen T. G., Wijkstra H., de la Rosette J., Laguna M. P., “Advanced diagnostics in renal mass using optical coherence tomography: a preliminary report,” J. Endourol. 25(2), 311–315 (2011).10.1089/end.2010.0408 - DOI - PubMed
    1. Barwari K., de Bruin D. M., Faber D. J., van Leeuwen T. G., de la Rosette J. J., Laguna M. P., “Differentiation between normal renal tissue and renal tumors using functional optical coherence tomography: a phase I in vivo human study,” BJU Int. 110(8b), E415–E420 (2012).10.1111/j.1464-410X.2012.11197.x - DOI - PubMed
    1. Tomlins P. H., Adegun O., Hagi-Pavli E., Piper K., Bader D., Fortune F., “Scattering attenuation microscopy of oral epithelial dysplasia,” J. Biomed. Opt. 15(6), 066003 (2010).10.1117/1.3505019 - DOI - PubMed

LinkOut - more resources