. 2020 Oct 28;11(11):6755-6779.
doi: 10.1364/BOE.400525. eCollection 2020 Nov 1.

Fourier domain diffuse correlation spectroscopy with heterodyne holographic detection

Affiliations

Fourier domain diffuse correlation spectroscopy with heterodyne holographic detection

Edward James et al. Biomed Opt Express. .

Abstract

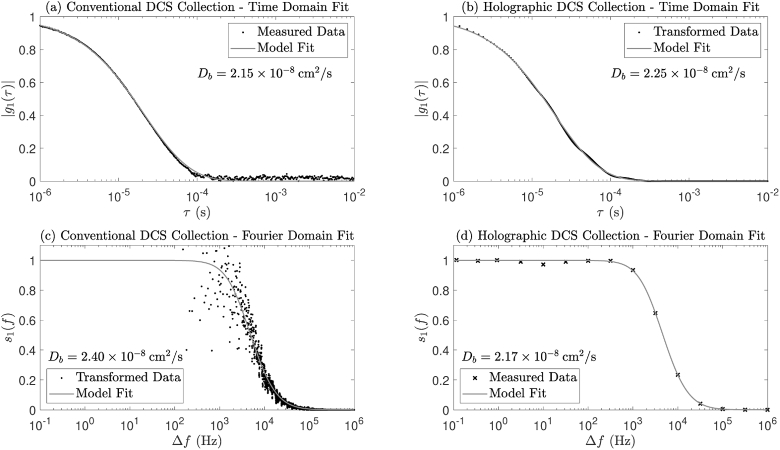
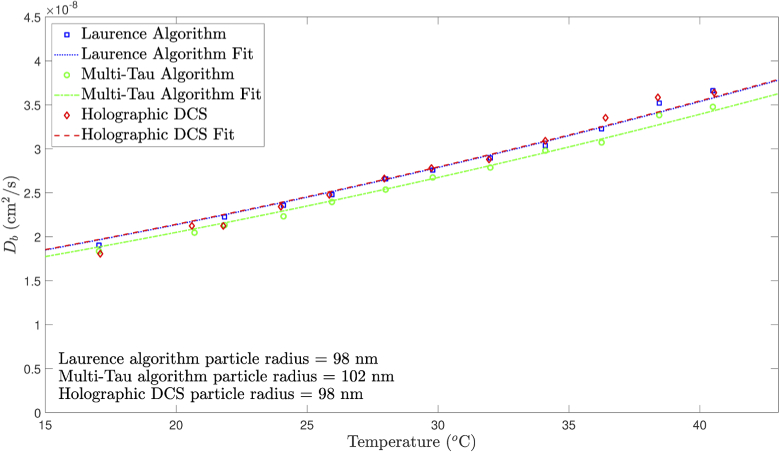
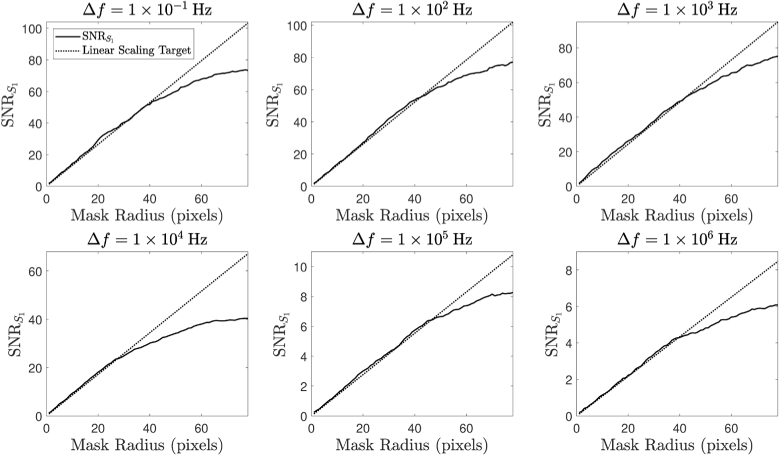
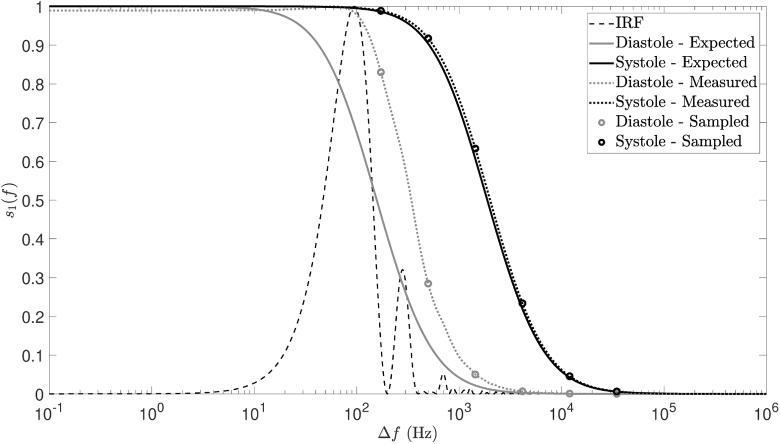
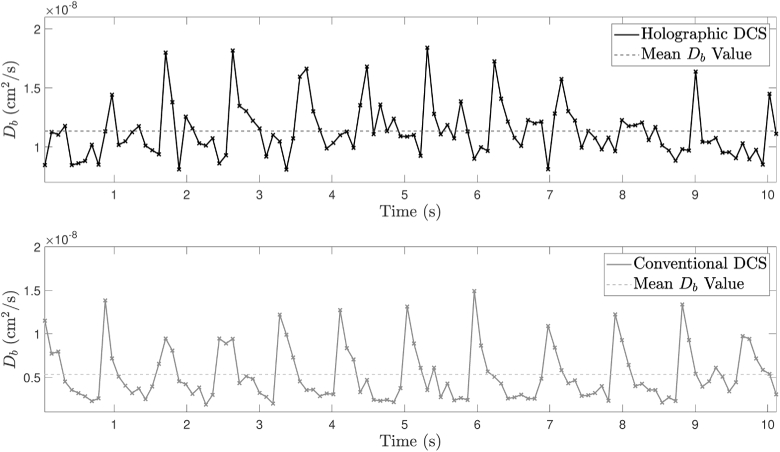
We present a new approach to diffuse correlation spectroscopy which overcomes the limited light throughput of single-mode photon counting techniques. Our system employs heterodyne holographic detection to allow parallel measurement of the power spectrum of a fluctuating electric field across thousands of modes, at the shot noise limit, using a conventional sCMOS camera. This yields an order of magnitude reduction in detector cost compared to conventional techniques, whilst also providing robustness to the effects of ambient light and an improved signal-to-noise ratio during in vitro experiments. We demonstrate a GPU-accelerated holographic demodulation system capable of processing the incoming data (79.4 M pixels per second) in real-time, and a novel Fourier domain model of diffuse correlation spectroscopy which permits the direct recovery of flow parameters from the measured data. Our detection and modelling strategy are rigorously validated by modulating the Brownian component of an optical tissue phantom, demonstrating absolute measurements of the Brownian diffusion coefficient in excellent agreement with conventional methods. We further demonstrate the feasibility of our system through in vivo measurement of pulsatile flow rates measured in the human forearm.


Conflict of interest statement

The authors declare no conflicts of interest.

Figures

Fig. 1.
Fig. 1.
Semi-infinite geometry reflection mode model and notation used in DCS measurements. Adapted from [20].
Fig. 2.
Fig. 2.
Schematic representation of our off-axis HPSD system. A continuous wave (CW) laser source is split into a reference arm and a sample arm in a fibre-coupled beamsplitter (BS). The reference arm is frequency shifted by a pair of acousto-optic modulators (AOM1 and AOM2). Light is collected from the sample in a reflectance mode geometry through the aperture of a liquid light guide. The two arms are recombined off-axis in a cube BS.
Fig. 3.
Fig. 3.
(a) Camera plane hologram, HC, formed using DC subtraction temporal filtering. (b) Arbitrary logarithmic representation of a reconstructed intensity hologram, HR. The two heterodyne gain terms, S±Δω, are masked by the dotted circles (which are a conjugate pair), the shot noise mask, N, is depicted by the dashed circle. (c) The thin grey solid line shows the value of the diagonal white dashed line that has been superimposed on HR, averaged over ±5 pixels in ky. The thick dashed black line shows the average shot noise value of all the pixels in HC for this particular image reconstruction.
Fig. 4.
Fig. 4.
Integrated system architecture and data streaming via a highly parallel GPU-accelerated demodulation pathway. The control board synchronises experiments, holograms are relayed from the camera to the workstation’s system memory, and custom CUDA kernels implement the holographic demodulation process.
Fig. 5.
Fig. 5.
4-phase IRF detection and validation against the IRF model for the first and second heterodyne terms (τe=9.6 ms, fs=29.8 Hz, Nf=4).
Fig. 6.
Fig. 6.
Application of (a) conventional DCS mixed model fitting and (b) holographic DCS mixed model fitting to data acquired using an intralipid phantom. Magnified views are shown in Fig. 7.
Fig. 7.
Fig. 7.
Magnified views of Fig. 6 show that the mixed model fits the data better than either the Brownian model or the convective model alone, for both (a) conventional DCS and (b) holographic DCS.
Fig. 8.
Fig. 8.
Fitting holographic DCS data to our Fourier domain DCS model (grey error bars and grey solid line), which is at least two orders of magnitude wider than the IRF (black dashed line). The black dotted line represents synthetic data produced by forward modelling in the Fourier domain with the Db value acquired from a conventional DCS setup.
Fig. 9.
Fig. 9.
Fitting of measured data to native domain decorrelation models, for (a) conventional DCS collection and (d) holographic DCS collection. Model fitting in the complementary domain following numerical Fourier transform of measured data, for (b) holographic DCS collection and (c) conventional DCS collection. Due to noise in the measured data, DCS model fitting in the native domain is preferable to numerical transform and fitting in the complementary domain.
Fig. 10.
Fig. 10.
The distribution of Db values for both conventional DCS and holographic DCS over a temperature range in an optical tissue phantom using native domain mixed model fitting. Model fits to the Stokes-Einstein equation and extracted intralipid particle radii are also shown for all three data sets.
Fig. 11.
Fig. 11.
The relationship between SNRS1 and the radius of the demodulation mask at various Δf values for holographic DCS, the linear scaling targets are shown by the dotted lines.
Fig. 12.
Fig. 12.
Simulated data, used in Experiment 4 to aid selection of appropriate detuning frequencies. The solid lines show the range of power spectra that we expect to encounter (using Db values acquired from conventional DCS data collection). The dotted lines simulate the effects of IRF broadening on the expected power spectra. The measured power spectra are then sampled where we expect to encounter the greatest measured change over the cardiac cycle (these sample points are depicted by the circles on each of the measured power spectra).
Fig. 13.
Fig. 13.
Db time series for contact forearm measurements acquired at 10.8 Hz, using both holographic DCS and conventional DCS. The dashed horizontal lines represent the mean Db value for each time series.

References

    1. Buckley E. M., Parthasarathy A. B., Grant P. E., Yodh A. G., Franceschini M. A., “Diffuse correlation spectroscopy for measurement of cerebral blood flow: future prospects,” Neurophotonics 1(1), 011009 (2014).10.1117/1.NPh.1.1.011009 - DOI - PMC - PubMed
    1. Durduran T., Choe R., Baker W. B., Yodh A. G., “Diffuse optics for tissue monitoring and tomography,” Rep. Prog. Phys. 73(7), 076701 (2010).10.1088/0034-4885/73/7/076701 - DOI - PMC - PubMed
    1. Elson D. S., Li R., Dunsby C., Eckersley R., Tang M. X., “Ultrasound-mediated optical tomography: A review of current methods,” Interface Focus 1(4), 632–648 (2011).10.1098/rsfs.2011.0021 - DOI - PMC - PubMed
    1. Rudin M., Molecular Imaging: Basic Principles and Applications in Biomedical Research (Imperial College Press, 2013), 2nd ed.
    1. Dietsche G., Ninck M., Ortolf C., Li J., Jaillon F., Gisler T., “Fiber-based multispeckle detection for time-resolved diffusing-wave spectroscopy : characterization and application to blood flow detection in deep tissue,” Appl. Opt. 46(35), 8506–8514 (2007).10.1364/AO.46.008506 - DOI - PubMed

LinkOut - more resources