. 2020 Nov 13:10:595892.
doi: 10.3389/fonc.2020.595892. eCollection 2020.

Enteric Glia Play a Critical Role in Promoting the Development of Colorectal Cancer

Affiliations

Enteric Glia Play a Critical Role in Promoting the Development of Colorectal Cancer

Robert Yuan et al. Front Oncol. .

Abstract

Enteric glia are a distinct population of peripheral glial cells in the enteric nervous system that regulate intestinal homeostasis, epithelial barrier integrity, and gut defense. Given these unique attributes, we investigated the impact of enteric glia depletion on tumor development in azoxymethane/dextran sodium sulfate (AOM/DSS)-treated mice, a classical model of colorectal cancer (CRC). Depleting GFAP+ enteric glia resulted in a profoundly reduced tumor burden in AOM/DSS mice and additionally reduced adenomas in the ApcMin /+ mouse model of familial adenomatous polyposis, suggesting a tumor-promoting role for these cells at an early premalignant stage. This was confirmed in further studies of AOM/DSS mice, as enteric glia depletion did not affect the properties of established malignant tumors but did result in a marked reduction in the development of precancerous dysplastic lesions. Surprisingly, the protective effect of enteric glia depletion was not dependent on modulation of anti-tumor immunity or intestinal inflammation. These findings reveal that GFAP+ enteric glia play a critical pro-tumorigenic role during early CRC development and identify these cells as a potential target for CRC prevention.

Keywords: ApcMin/+; azoxymethane/dextran sodium sulfate; colorectal cancer; enteric glia; enteric nervous system.


Figures

Figure 1
Figure 1
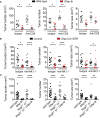
Enteric glia depletion reduces tumor burden in AOM/DSS mice. (A, B) Analysis of tumors in wild-type and Gfap-tk AOM/DSS mice treated with ganciclovir (n = 7–10 mice per group; pooled from two independent experiments) (A) and of non-depleted control AOM/DSS mice and enteric-glia-depleted Gfap-Cre iDTR AOM/DSS mice (n = 8–12 mice per group; pooled from two independent experiments) (B). Representative colonoscopy images are shown, with tumors marked by a +. Data are presented as mean ± SEM. P < 0.05 = *; P < 0.001 = ***, Mann-Whitney U test.
Figure 2
Figure 2
Reduction in tumor burden following enteric glia depletion does not depend on CD8+ T cells, NK cells, or total lymphocytes. (A) Analysis of tumors in wild-type and Gfap-tk AOM/DSS mice treated with ganciclovir and isotype or anti-CD8α depleting antibody for nine weeks following induction (n = 4–6 mice per group). (B) Analysis of tumors in non-depleted control AOM/DSS mice and enteric-glia-depleted Gfap-Cre iDTR AOM/DSS mice treated with isotype or anti-NK1.1 depleting antibody starting from induction (n = 7–13 mice per group). (C) Analysis of tumors in wild-type, Gfap-tk, Rag2-/- γc-/-, and Rag2-/- γc-/- Gfap-tk AOM/DSS mice treated with ganciclovir starting from induction (n = 10–18 mice per group; data pooled from two independent experiments). Data are presented as mean ± SEM. P < 0.05 = *; P < 0.01 = **; P < 0.001 = ***; P < 0.0001 = ****, Mann-Whitney U test.
Figure 3
Figure 3
Enteric glia depletion does not affect colitis severity. (A–E) Disease activity index scores (A), body weights (B), neutrophil absolute counts in the distal colon (C), colon lengths (D), histopathology scores (E), and hematoxylin and eosin images of the distal colon (F) for non-depleted control mice and enteric-glia-depleted Gfap-Cre iDTR mice undergoing acute DSS-induced colitis [n = 8–9 mice per group (A–D); n = 6–7 mice per group (E, F); representative of three experiments (A, B, D)]. Scale bar = 50 μm. (G) Analysis of tumors in various Gfap-Cre conditional knockout mice induced with AOM/DSS (n = 7–9 mice per group (Stat3fl/fl); n = 9–11 mice per group (Myd88fl/fl); n = 14–19 mice per group (Ifngr1fl/fl); n = 17–18 mice per group (Relafl/fl); representative of three independent experiments (Myd88fl/fl); pooled from two independent experiments (Ifngr1fl/fl); pooled from three independent experiments (Relafl/fl)). Data are presented as mean ± SEM.
Figure 4
Figure 4
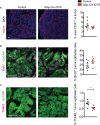
Tumors from enteric-glia-depleted mice and non-depleted control mice exhibit similar properties. (A) Representative immunofluorescence images of CD31 (red) and DAPI (blue) in tumors from non-depleted control AOM/DSS mice and enteric-glia-depleted Gfap-Cre iDTR AOM/DSS mice (n = 5–7 mice per group). Quantification is shown on the right. (B, C) Representative immunofluorescence images of EpCAM (green) and BrdU (magenta) (B) or TUNEL (magenta) (C) in tumors from non-depleted control AOM/DSS mice and enteric-glia-depleted Gfap-Cre iDTR AOM/DSS mice (n = 6–7 mice per group). Quantification is shown on the right. Scale bars are 100 μm. Data are presented as mean ± SEM. P < 0.05 = *, Mann-Whitney U test.
Figure 5
Figure 5
Enteric glia are important during early tumor development. (A, B) Analysis of tumors in wild-type and Gfap-tk AOM/DSS mice treated with ganciclovir starting from week four (n = 10–12 mice per group; pooled from two independent experiments) (A) or starting from week ten (n = 4–5 mice per group; representative of two independent experiments) (B). (C, D) Total number of dysplastic lesions (C) and the number of lesions at each stage of tumor development (D) in the distal colon of non-depleted control AOM/DSS mice and enteric-glia-depleted Gfap-Cre iDTR AOM/DSS mice (n = 10–14 mice per group). (E) Analysis of tumors in the small intestines (left) and colons (right) of ApcMin/+ and ApcMin/+ Gfap-tk mice treated with ganciclovir (n = 15 mice per group; pooled from three independent experiments). Data are presented as mean ± SEM. P < 0.05 = *; P < 0.01 = **; P < 0.001 = ***; Mann-Whitney U test.

References

    1. Gulbransen BD, Sharkey KA. Novel functional roles for enteric glia in the gastrointestinal tract. Nat Rev Gastroenterol Hepatol (2012) 9(11):625–32. 10.1038/nrgastro.2012.138 - DOI - PubMed
    1. Neunlist M, Rolli-Derkinderen M, Latorre R, Van Landeghem L, Coron E, Derkinderen P, et al. Enteric glial cells: recent developments and future directions. Gastroenterology (2014) 147(6):1230–7. 10.1053/j.gastro.2014.09.040 - DOI - PubMed
    1. Furness JB. The enteric nervous system and neurogastroenterology. Nat Rev Gastroenterol Hepatol (2012) 9(5):286–94. 10.1038/nrgastro.2012.32 - DOI - PubMed
    1. Wood JD. Enteric Nervous System: Neuropathic Gastrointestinal Motility. Digest Dis Sci (2016) 61(7):1803–16. 10.1007/s10620-016-4183-5 - DOI - PubMed
    1. Rao M, Nelms BD, Dong L, Salinas-Rios V, Rutlin M, Gershon MD, et al. Enteric glia express proteolipid protein 1 and are a transcriptionally unique population of glia in the mammalian nervous system. Glia (2015) 63(11):2040–57. 10.1002/glia.22876 - DOI - PMC - PubMed