. 2020 Nov 12:8:579190.
doi: 10.3389/fpubh.2020.579190. eCollection 2020.

Analysis of COVID-19 Cases' Spatial Dependence in US Counties Reveals Health Inequalities

Affiliations

Analysis of COVID-19 Cases' Spatial Dependence in US Counties Reveals Health Inequalities

T Saffary et al. Front Public Health. .

Abstract

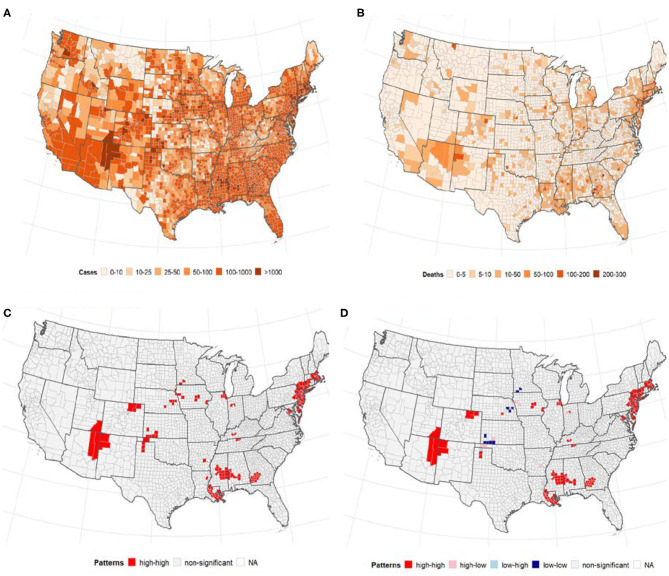
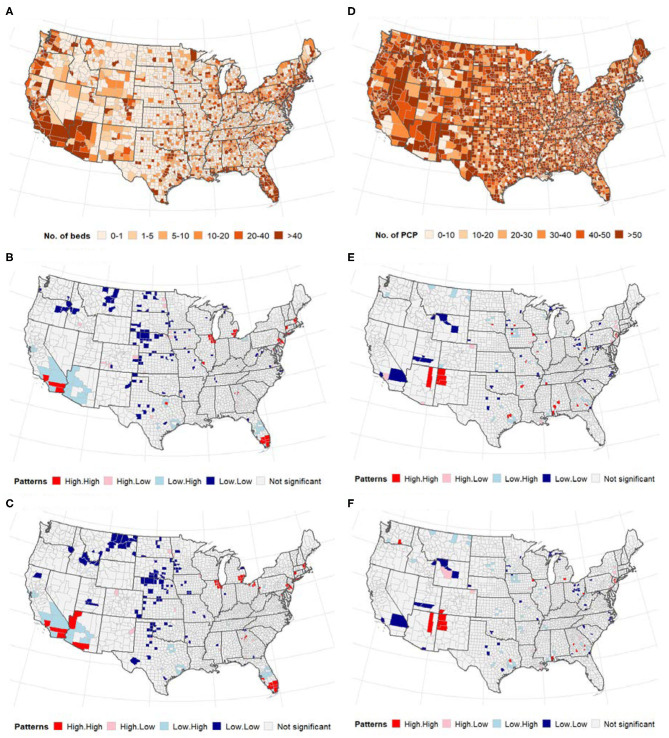
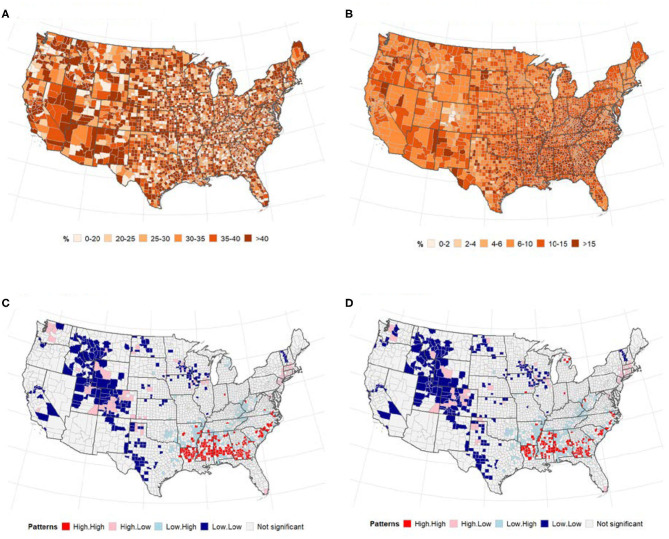
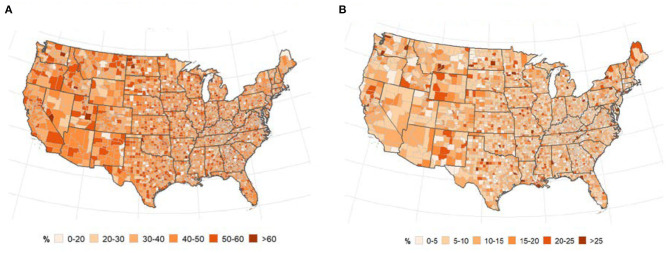
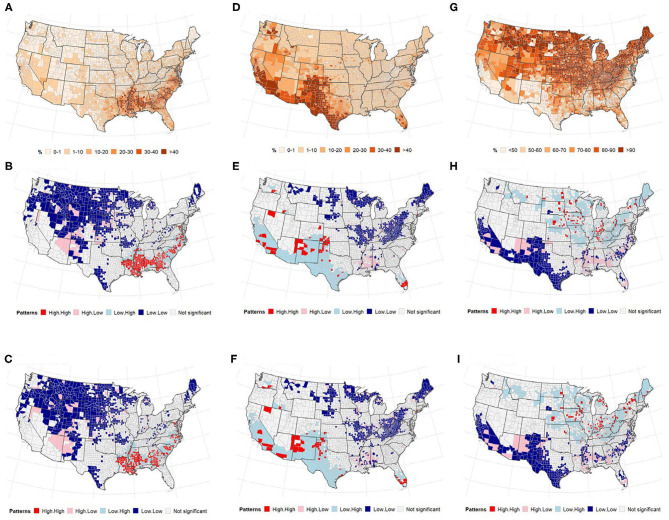
On March 13, 2020, the World Health Organization (WHO) declared the 2019 coronavirus disease (COVID-19) caused by the novel coronavirus SARS-CoV2 a pandemic. Since then the virus has infected over 9.1 million individuals and resulted in over 470,000 deaths worldwide (as of June 24, 2020). Here, we discuss the spatial correlation between county population health rankings and the incidence of COVID-19 cases and COVID-19 related deaths in the United States. We analyzed the spread of the disease based on multiple variables at the county level, using publicly available data on the numbers of confirmed cases and deaths, intensive care unit beds and socio-demographic, and healthcare resources in the U.S. Our results indicate substantial geographical variations in the distribution of COVID-19 cases and deaths across the US counties. There was significant positive global spatial correlation between the percentage of Black Americans and cases of COVID-19 (Moran I = 0.174 and 0.264, p < 0.0001). A similar result was found for the global spatial correlation between the percentage of Black American and deaths due to COVID-19 at the county level in the U.S. (Moran I = 0.264, p < 0.0001). There was no significant spatial correlation between the Hispanic population and COVID-19 cases and deaths; however, a higher percentage of non-Hispanic white was significantly negatively spatially correlated with cases (Moran I = -0.203, p < 0.0001) and deaths (Moran I = -0.137, p < 0.0001) from the disease. This study showed significant but weak spatial autocorrelation between the number of intensive care unit beds and COVID-19 cases (Moran I = 0.08, p < 0.0001) and deaths (Moran I = 0.15, p < 0.0001), respectively. These findings provide more detail into the interplay between the infectious disease and healthcare-related characteristics of the population. Only by understanding these relationships will it be possible to mitigate the rate of spread and severity of the disease.

Keywords: COVID-19; coronavirus; health rankings; neighborhood; spatial autocorrelation.


Figures

Figure 1
Figure 1
The number of confirmed cases of COVID-19 and deaths per 100, 000 population by US county. Note: Visual effects may be distorted due to the large area of US counties in the West compared to the East. (A) Cases/100,000 population. (B) Deaths/100,000 population. (C) Univariate LISA cases/100,000. (D) Univariate LISA deaths/100,000.
Figure 2
Figure 2
(Top) Distribution of the number of ICU beds (A) and PCPs (D) across US counties; (middle and bottom) Bivariate LISA map between ICU beds/PCPs and COVID-19. (A–C) ICU beds, (D–F) PCPs. The high-high and low-low areas represent spatial clusters, while high-low, and low-high represent discordant patterns. (A) Number of intensive care units (ICU) beds. (B) Cases vs. ICU beds. (C) Deaths vs. ICU beds. (D) Primary care physicians (PCP)/10,000 population. (E) Cases vs. physicians. (F) Deaths vs. physicians.
Figure 3
Figure 3
Relationships between adult obesity (right), diabetes (left) and number of COVID-19 cases (and deaths). Spatial distribution of (A) adult obesity and (B), diabetes. LISA map for spatial dependence between adult diabetes and COVID-19 cases/deaths (B,C). (A) % of adults with BMI > 30. (B) % of adults aged 20 and above with diagnosed diabetes. (C) Cases vs. diabetes. (D) Deaths vs. diabetes.
Figure 4
Figure 4
Spatial distribution of flu vaccination (A) and uninsured population (B). (A) % of annual medicare enrollees having an annual flu vaccination, overall and subgroups. (B) % of people under age 65 without insurance.
Figure 5
Figure 5
(Top) Percentage of population, (middle and bottom) LISA map for spatial dependence between race, and COVID-19 incidence. (A–C) non-Hispanic Black or African American (D–F), Hispanic. (A) % non-Hispanic Black or african american. (B) Cases vs. Blacks. (C) Deaths vs. Blacks. (D) % of population that is Hispanic. (E) Cases vs. Hispanic. (F) Deaths vs. Hispanic. (G) % of population that is non-Hispanic White. (H) Cases vs. White. (I) Deaths vs. White.

References

    1. Li Q. An outbreak of NCIP (2019-nCoV) infection in China—Wuhan, Hubei province, 2019-2020. China CDC Wkly. (2020) 2:79–80. 10.46234/ccdcw2020.022 - DOI - PMC - PubMed
    1. Zhu N, Zhang D, Wang W, Li X, Yang B, Song J, et al. A novel coronavirus from patients with pneumonia in China, 2019. N Engl J Med. (2020) 382:727–33. 10.1056/NEJMoa2001017 - DOI - PMC - PubMed
    1. Yi Y, Lagniton PN, Ye S, Li E, Xu RH. COVID-19: what has been learned and to be learned about the novel coronavirus disease. Int J Biol Sci. (2020) 16:1753–66. 10.7150/ijbs.45134 - DOI - PMC - PubMed
    1. World Health Organization WHO Director-General's opening remarks at the media briefing on COVID-19- 11 March 2020. Geneva: WHO; (2020).
    1. Pak A, Adegboye OA, Adekunle Ai, Rahman KM, McBryde ES, Eisen DP. Economic consequences of the COVID-19 outbreak: the need for epidemic preparedness. Front Public Health. (2020) 8:241. 10.3389/fpubh.2020.00241 - DOI - PMC - PubMed