. 2020 Nov 13:8:609430.
doi: 10.3389/fcell.2020.609430. eCollection 2020.

Positive Feedback Stimulation of Ccnb1 and Mos mRNA Translation by MAPK Cascade During Mouse Oocyte Maturation

Affiliations

Positive Feedback Stimulation of Ccnb1 and Mos mRNA Translation by MAPK Cascade During Mouse Oocyte Maturation

Lan-Rui Cao et al. Front Cell Dev Biol. .

Abstract

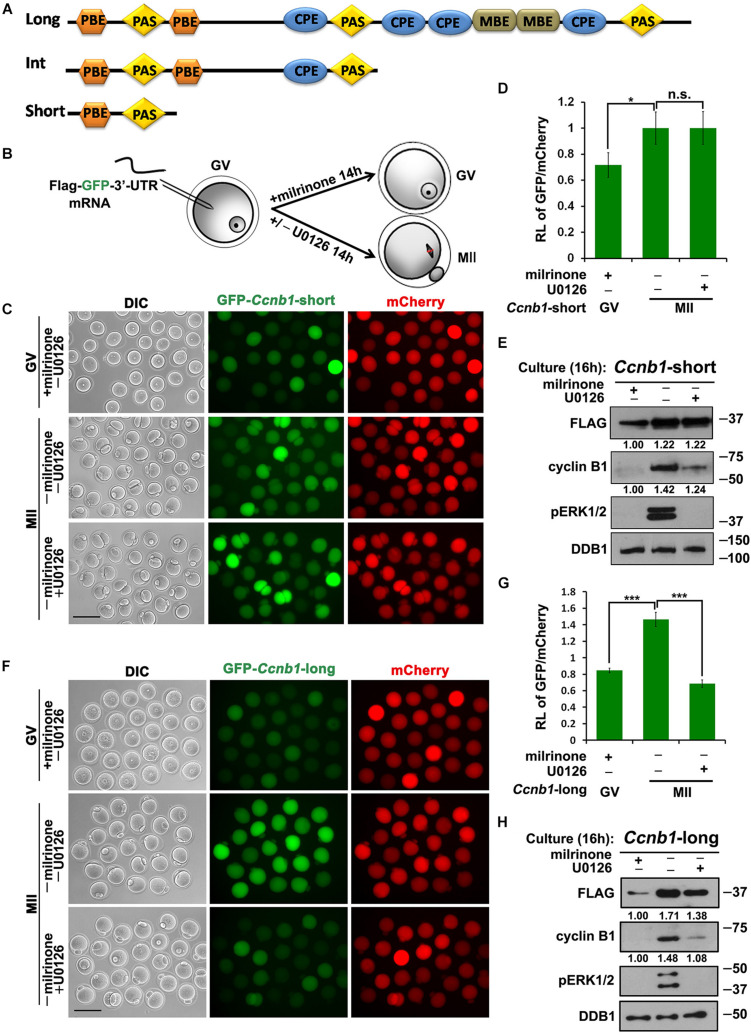
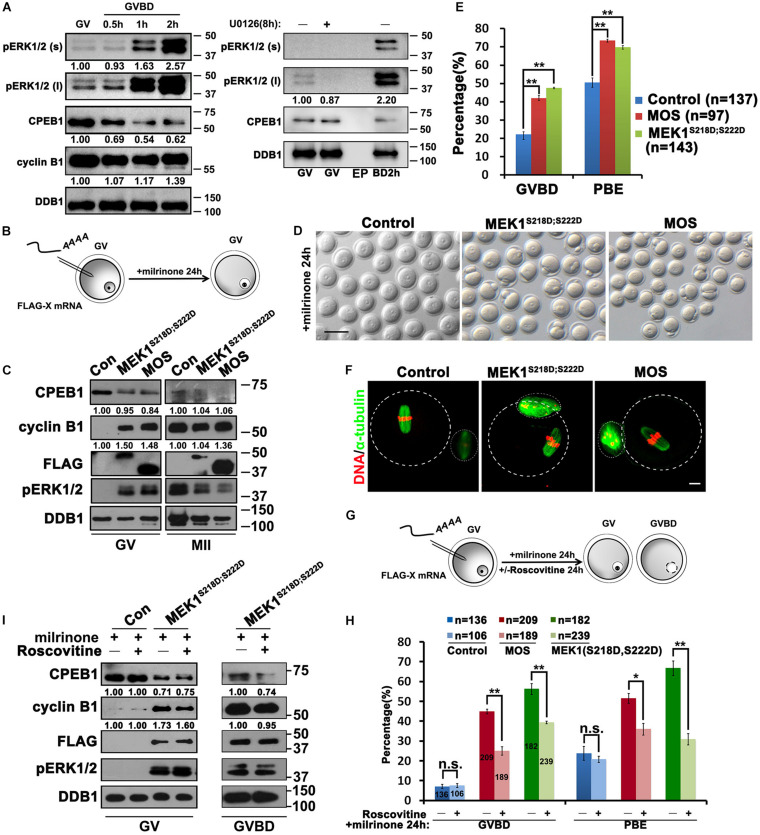
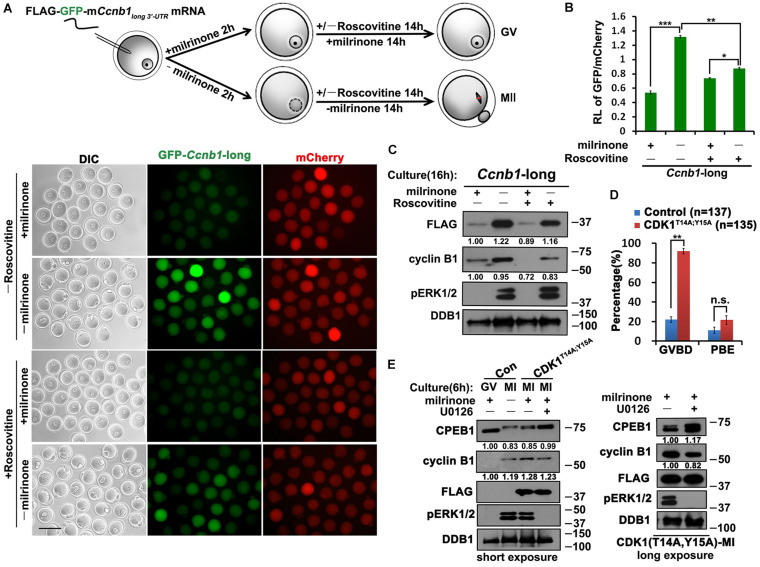
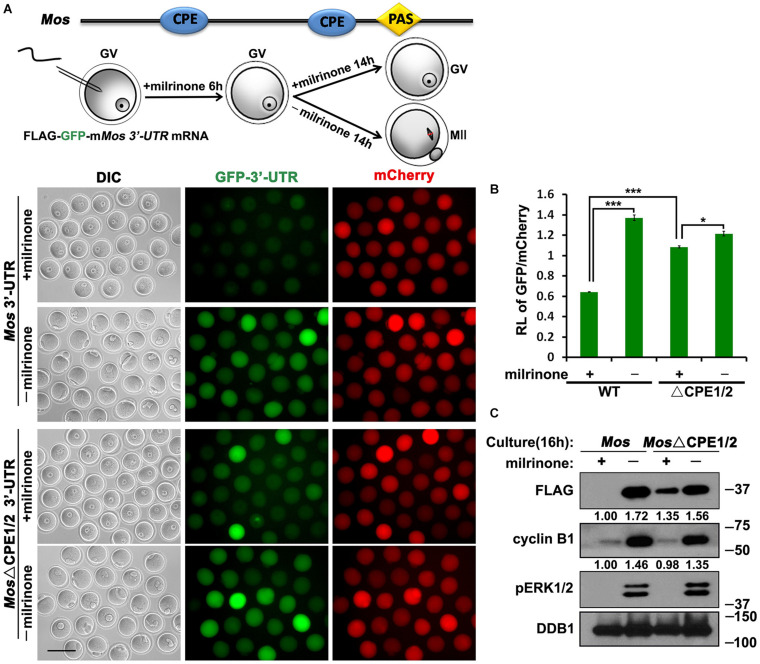
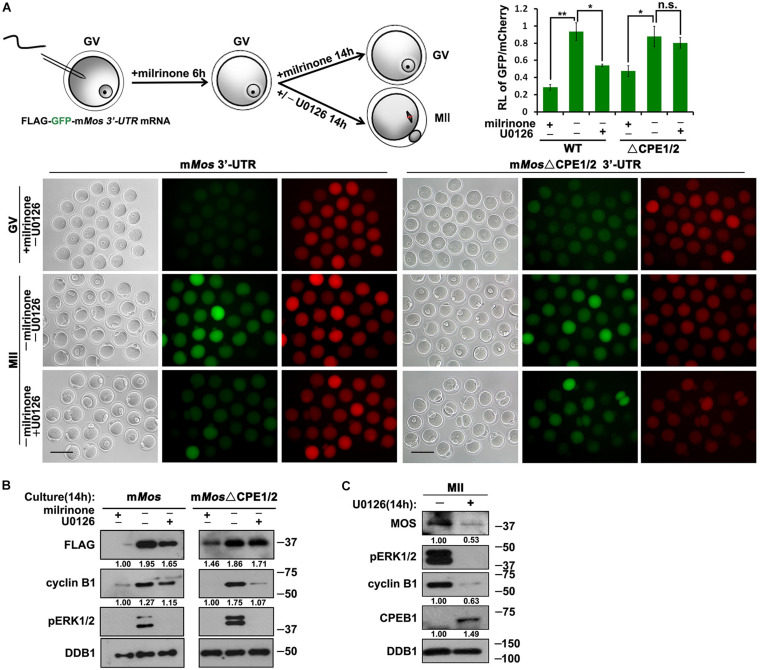
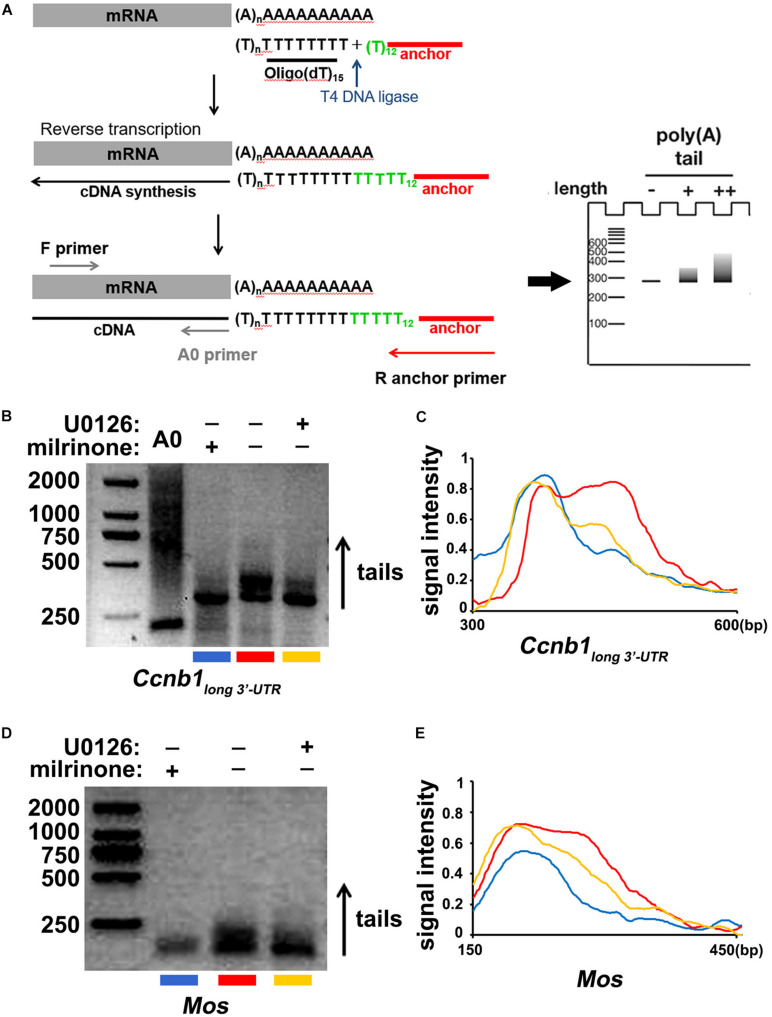
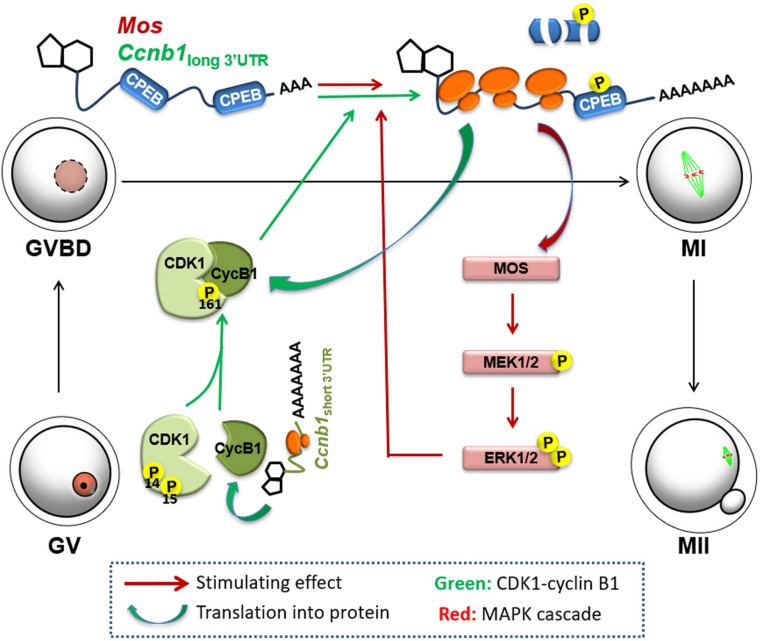
In mammalian species, both the maturation promoting factor (MPF) and the mitogen-activated protein kinase (MAPK) cascade play critical roles in modulating oocyte meiotic cell-cycle progression. MPF is a critical heterodimer composed of CDK1 and cyclin B1. Activation of MPF and ERK1/2 requires the activation of maternal Ccnb1 and Mos mRNAs translation, respectively. The phosphorylation and degradation of CPEB1 that triggered by ERK1/2 is a principal mechanism of activating maternal mRNA translation. However, the interplay of these two key kinases in mediating mammalian translational activation of cytoplasmic mRNAs during oocyte maturation is unclear. We prove evidence that the translational activation of Ccnb1 transcripts containing a long 3'-UTR during meiotic resumption works in an ERK1/2-dependent way. A low level of ERK1/2 activation was detected prior to meiotic resumption. Precocious activation of MAPK signaling in germinal vesicle stage oocytes promotes the translation of Ccnb1 mRNA and meiotic maturation. Inhibition or precocious activation of CDK1 activity has an appreciable effect on the translation of Ccnb1 mRNA, suggesting that both kinases are required for Ccnb1 mRNA translational activation. CDK1 triggers phosphorylation, but not degradation, of CPEB1 in oocytes; the degradation of CPEB1 was only triggered by ERK1/2. Moreover, the translational activation of Mos mRNA is regulated by ERK1/2 and cytoplasmic polyadenylation elements too. Taken together, the cooperation and positive feedback activation of ERK1/2 and CDK1 lead to the fine-tuning of mRNA translation and cell-cycle progression during mouse oocyte maturation.

Keywords: 3′-UTR; cell cycle; kinase; mRNA translation; oogenesis; polyadenylation.


Figures

FIGURE 1
FIGURE 1
Translational activation of maternal Ccnb1 mRNAs with short and long 3′-UTRs. (A) Schematic representation of three different forms of Ccnb1 transcripts with distrinct lengths of 3′-UTRs in mouse oocyte. Relative positions of cis-elements are indicated. (B) An illustration of microinjection and treatments to oocytes in subsequent experiments. (C,E) Fluorescence microscopy (C) and western blot analysis (E) results revealing the expression levels of Flag-Gfp-Ccnb1short 3′–UTR mRNA in oocytes with different U0126 (20 μM) treatment. DDB1 was used for a control. Numbers under blot bands indicate the intensity of each band. For each set of data, more than 80 oocytes were observed. Scale bar: 100 μm. (D) The ratio of the GFP and mCherry fluorescence signals intensity in (C). Data were analyzed by mean ± SEM: *P < 0.05. (F,H) Fluorescence microscopy (F) and western blot analysis (H) data revealing the expression of Flag-Gfp-Ccnb1long 3′–UTR reporter mRNA in oocytes with or without U0126. For each set of data, more than 80 oocytes were gathered. Scale bar: 100 μm. (G) The ratio of the GFP and mCherry fluorescence signals intensity in (F). n.s. indicates non-significant. DDB1 was used for a control. Numbers under blot bands indicate the intensity of each band. Data were analyzed by mean ± SEM: ***P < 0.001.
FIGURE 2
FIGURE 2
Activation of ERK1/2 promotes the translation of Ccnb1 mRNA and induces meiotic maturation. (A) Western blot analysis results revealing the ERK1/2 phosphorylation and CPEB1 levels at the appointed time points behind meiotic recovery. For each set of data, 100 oocytes were gathered and loaded. DDB1 was used for a control. (B) An illustration of microinjection and treatments to oocytes in (C–F). (C) Western blot analysis results revealing contents of indicated proteins in oocytes microinjected with mRNAs encoding MOS or constitutively active MEK (MEK1S218D;S222D). One hundred oocytes were gathered and loaded in each lane. Numbers under blot bands indicate the intensity of each band. (D–F) Representative images (D), GVBD and PB1 emission (PBE) rates (E), and (F) immunofluorescence staining results of α-tubulin of oocytes in (C). DDB1 was used for a control. Numbers under blot bands indicate the intensity of each band. The accurate number of oocytes analyzed is labeled (n). Data were analyzed by mean ± SEM: **P < 0.05. Dashed lines indicate the oocyte outline. Scale bar: 100 μm. (G) An illustration of microinjection and treatments to oocytes in (H,I). (H) GVBD and PBE rates in oocytes that overexpressed MOS or MEK1S218D;S222D by microinjection and further cultured in medium containing roscovitine (100 μM) for 24 h. The number of oocytes analyzed is labeled (n). Data were analyzed by mean ± SEM: *P < 0.05, **P < 0.01. n.s. indicates non-significant. (I) Western blot analysis results showing levels of indicated proteins in (G). For each set of data, 70 oocytes were gathered and loaded. DDB1 was used for a control. Numbers under blot bands indicate the intensity of each band.
FIGURE 3
FIGURE 3
Role of CDK1 in the translational activation of Ccnb1 mRNAs. (A) Fluorescence microscopy results revealing the expression levels of Flag-Gfp-Ccnb1long 3′–UTR mRNA in oocytes with different roscovitine (100 μM) treatment. For each set of data, 50 oocytes were gathered. Plotting scale: 100 μm. (B) Relative fluorescence intensity of GFP relative to mCherry in (A). Data were analyzed by mean ± SEM: *P < 0.05, **P < 0.01, ***P < 0.001. (C) Western blot analysis results revealing translational levels of the reporter mRNA as well as endogenous cyclin B1 in (A). For each set of data, 80 oocytes were gathered and loaded. (D) GVBD and PBE rates of oocytes microinjected with mRNAs encoding non-inhibitable CDK1 (T14A;Y15A) and cultured for 14 h. The accurate number of oocytes analyzed is labeled (n). DDB1 was used for a control. Numbers under blot bands indicate the intensity of each band. Data were analyzed by mean ± SEM: **P < 0.01. n.s. indicates non-significant. (E) Western blot analysis results showing levels of indicated proteins in oocytes overexpressed mRNAs encoding CDK1T14A;Y15A and cultured with different milrinone and U0126 (20 μM) treatment. For each set of data, 70 oocytes were gathered and loaded. DDB1 was used for a control. Numbers under blot bands indicate the intensity of each band.
FIGURE 4
FIGURE 4
Translational activation of Mos mRNA during meiotic maturation in mouse oocytes. (A,C) Fluorescence microscopy (A) and western blot analysis (C) results revealing the expression levels of Flag-GFP fused with Mos 3′-UTR or its CPE-mutated (ΔCPE) form. For each set of data, 70 oocytes were observed. Plotting scale: 100 μm. (B) The ratio of the GFP and mCherry fluorescence signals intensity in (A). Data were analyzed by mean ± SEM: *P < 0.05, ***P < 0.001. DDB1 was used for a control. Numbers under blot bands indicate the intensity of each band.
FIGURE 5
FIGURE 5
Roles of CDK1 and ERK1/2 in the translational activation of Mos mRNA. (A) Fluorescence microscopy and the ratio of the GFP and mCherry fluorescence signals intensity results showing Flag-GFP expression driven by WT and CPE-mutated Mos 3′-UTR with different U0126 (20 μM) treatment. For each set of data, 50 oocytes were gathered. Plotting scale: 100 μm. (B) Western blot analysis results revealing translational levels of the reporter mRNA as well as endogenous cyclin B1 in (A). For each set of data, 80 oocytes were gathered and loaded. DDB1 was used for a control. Numbers under blot bands indicate the intensity of each band. (C) Western blot analysis results revealing protein levels of endogenous MOS as well as phosphorylated ERK1/2 expression in mouse MII oocytes with different U0126 (20 μM) treatment. For each set of data, 300 oocytes were gathered and loaded. DDB1 was used for a control. Numbers under blot bands indicate the intensity of each band.
FIGURE 6
FIGURE 6
Cytoplasmic polyadenylation of Ccnb1 and Mos transcripts. (A) A schematic representation of the poly(A) tail assay (PAT) assay. (B) Data of the PAT assay revealing the length of Ccnb1 long 3′–UTR transcripts’ poly(A) tail in oocytes with different U0126 (20 μM) treatment. Conditions of PCR amplification had detailedly described in the section “Materials and Methods.” (C) Quantitative statistics of the PAT assay results in (B). The plane coordinate representing the floating length of the PCR products from a appointed point to the x-axis, measured relative signal intensity to the y-axis. (D) Results of the PAT assay revealing the length of Mos transcripts’ poly(A) tail in oocytes with different U0126 (20 μM) treatment. (E) Quantitative statistics of results in (D).
FIGURE 7
FIGURE 7
Mechanism of positive feedback stimulation of Ccnb1 and Mos mRNA translation by the MPF and MAPK cascade during mouse oocyte maturation. The short isoform of Ccnb1 is constitutively translated into cyclin B1 proteins in the GV stage-arrested oocytes, and form a pre-MPF with CDK1. At a threshold timepoint, the basal MPF and ERK1/2 activities trigger translational activation of the Ccnb1 long isoform and Mos mRNAs. Storage of MOS and cyclin B1 brings on a significant increase in CDK1 and ERK1/2 activity, thereby further boosting maternal mRNA translation, forming two entangled positive feedback loops (labeled red and green, respectively), eventually causing meiotic resumption and oocyte maturation.

References

    1. Baldin V., Cans C., Knibiehler M., Ducommun B. (1997). Phosphorylation of human CDC25B phosphatase by CDK1-cyclin A triggers its proteasome-dependent degradation. J. Biol. Chem. 272 32731–32734. 10.1074/jbc.272.52.32731 - DOI - PubMed
    1. Chen J., Melton C., Suh N., Oh J. S., Horner K., Xie F., et al. (2011). Genome-wide analysis of translation reveals a critical role for deleted in azoospermia-like (Dazl) at the oocyte-to-zygote transition. Genes Dev. 25 755–766. 10.1101/gad.2028911 - DOI - PMC - PubMed
    1. Chen L., Jiang J. C., Dai X. X., Fan H. Y. (2020). Function and molecular mechanism of mitogen-activated protein kinase (MAPK) in regulating oocyte meiotic maturation and ovulation. Sheng Li Xue Bao 72 48–62. - PubMed
    1. Chen Z., Gibson T. B., Robinson F., Silvestro L., Pearson G., Xu B., et al. (2001). MAP kinases. Chem. Rev. 101 2449–2476. 10.1021/cr000241p - DOI - PubMed
    1. Dai X. X., Jiang J. C., Sha Q. Q., Jiang Y., Ou X. H., Fan H. Y. (2019). A combinatorial code for mRNA 3’-UTR-mediated translational control in the mouse oocyte. Nucleic Acids Res. 47 328–340. 10.1093/nar/gky971 - DOI - PMC - PubMed