

A Prognostic Model of 15 Immune-Related Gene Pairs Associated With Tumor Mutation Burden for Hepatocellular Carcinoma
- PMID: 33282911
- PMCID: PMC7691640
- DOI: 10.3389/fmolb.2020.581354
A Prognostic Model of 15 Immune-Related Gene Pairs Associated With Tumor Mutation Burden for Hepatocellular Carcinoma
Abstract
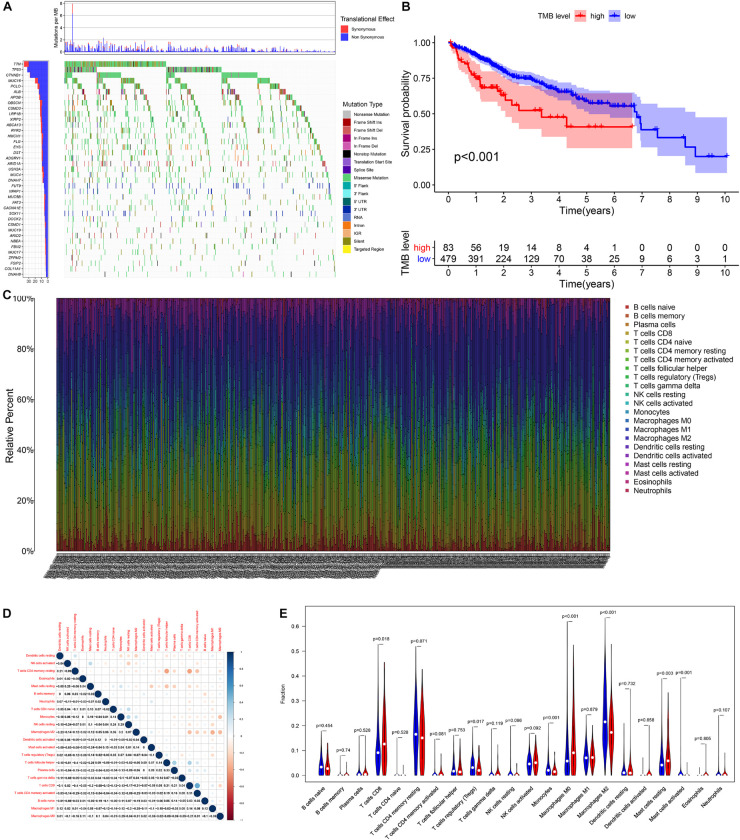
Introduction: Tumor mutation burden (TMB) is an emerging biomarker for immunotherapy of hepatocellular carcinoma (HCC), but its value for clinical application has not been fully revealed.
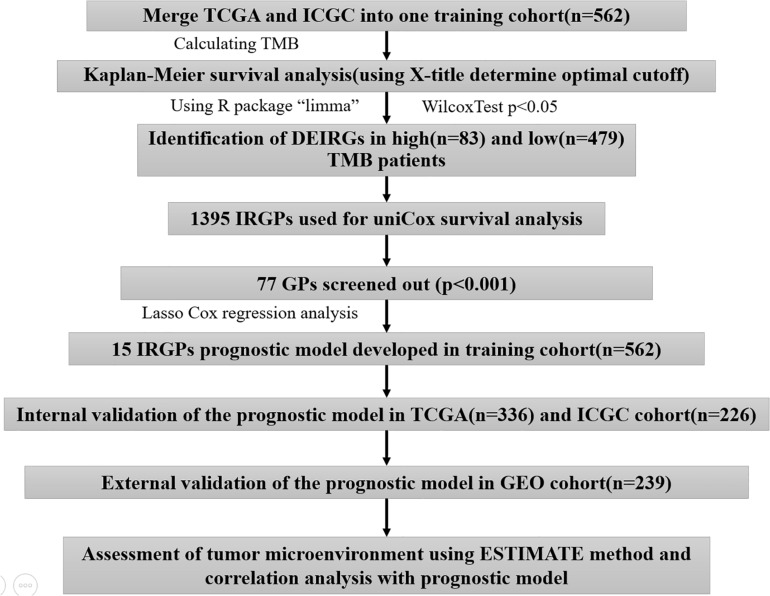
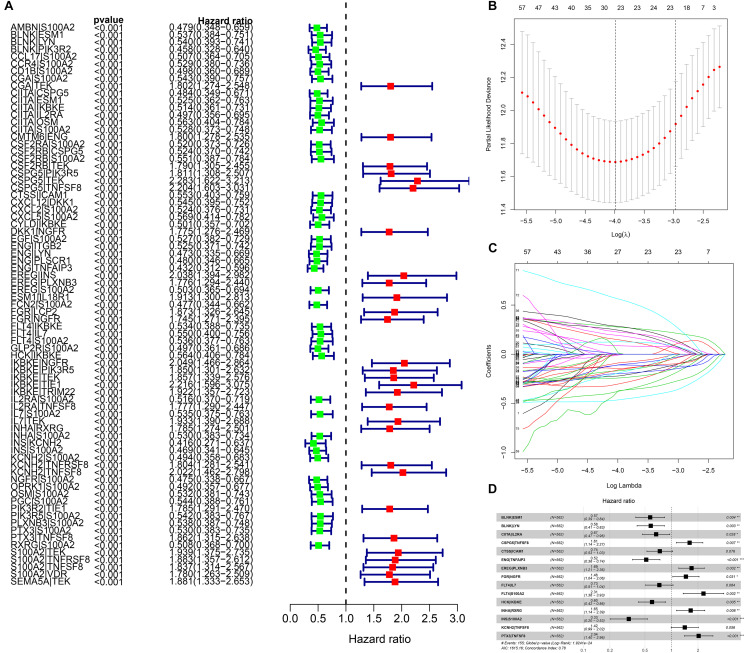
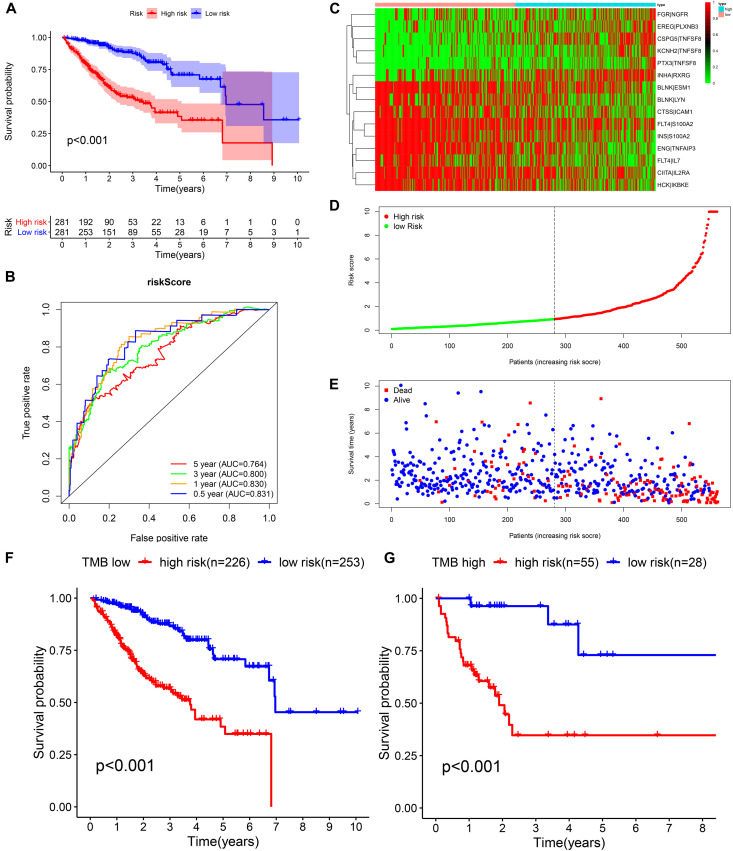
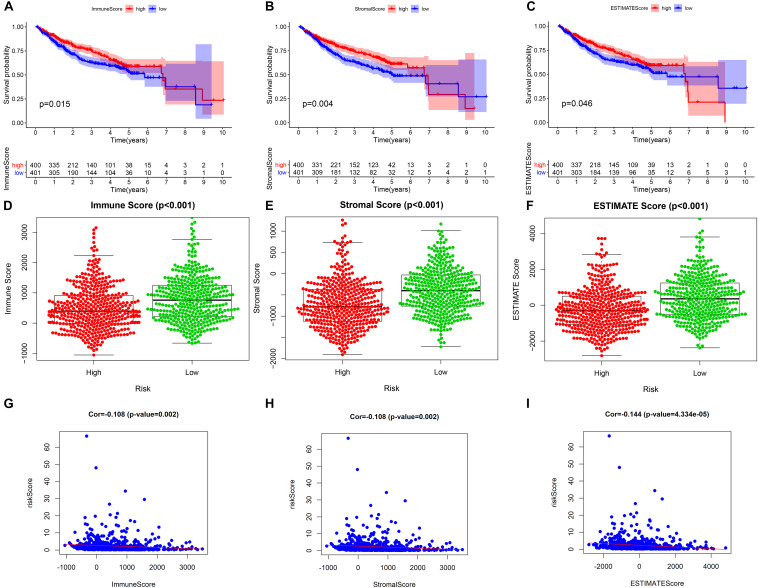
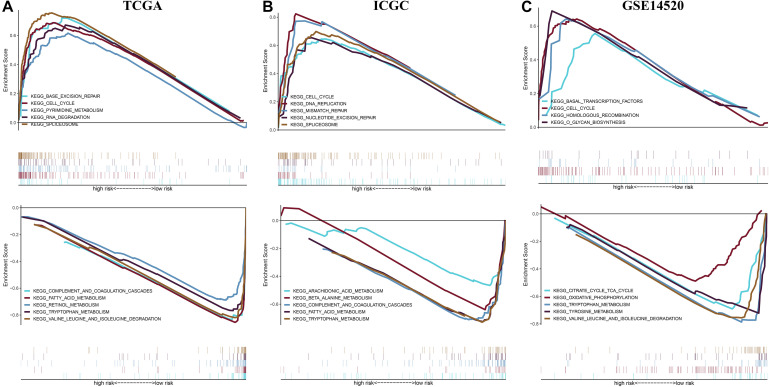
Materials and methods: We used the Wilcox test to identify the differentially expressed immune-related genes (DEIRGs) in groups with high and low TMB as well as screened the immune gene pairs related to prognosis using univariate Cox regression analysis. A LASSO Cox regression prognostic model was developed by combining The Cancer Genome Atlas Liver Hepatocellular Carcinoma (TCGA-LIHC) with the International Cancer Genome Consortium (ICGC) LIRI-JP cohort, and internal (TCGA, ICGC) and external (GSE14520) validation analyses were conducted on the predictive value of the model. We also explored the relationship between the prognostic model and tumor microenvironment via the ESTIMATE algorithm and performed clinical correlation analysis by the chi-square test, revealing its underlying molecular mechanism with the help of Gene Set Enrichment Analysis (GSEA).
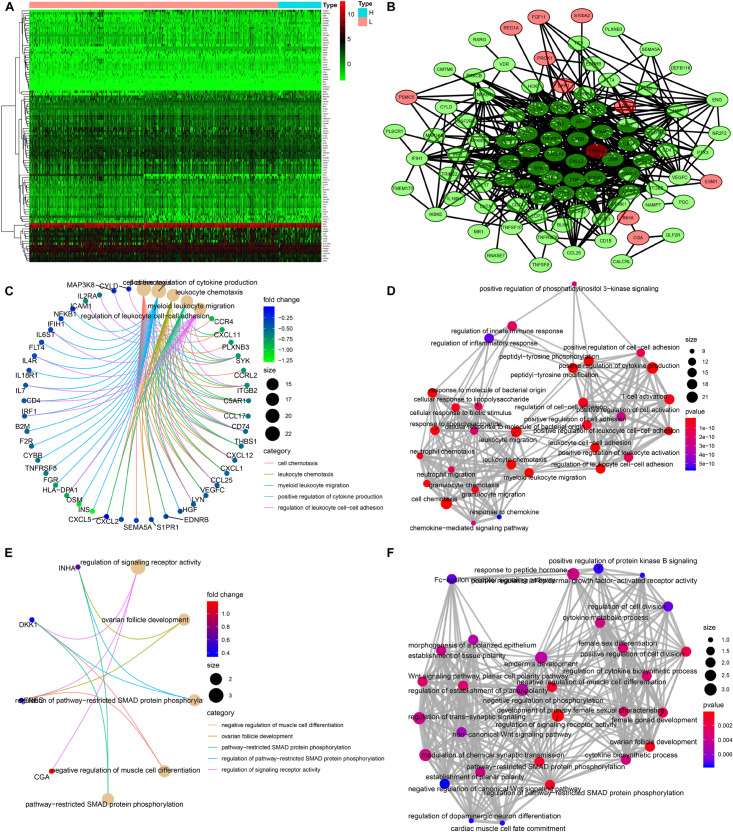
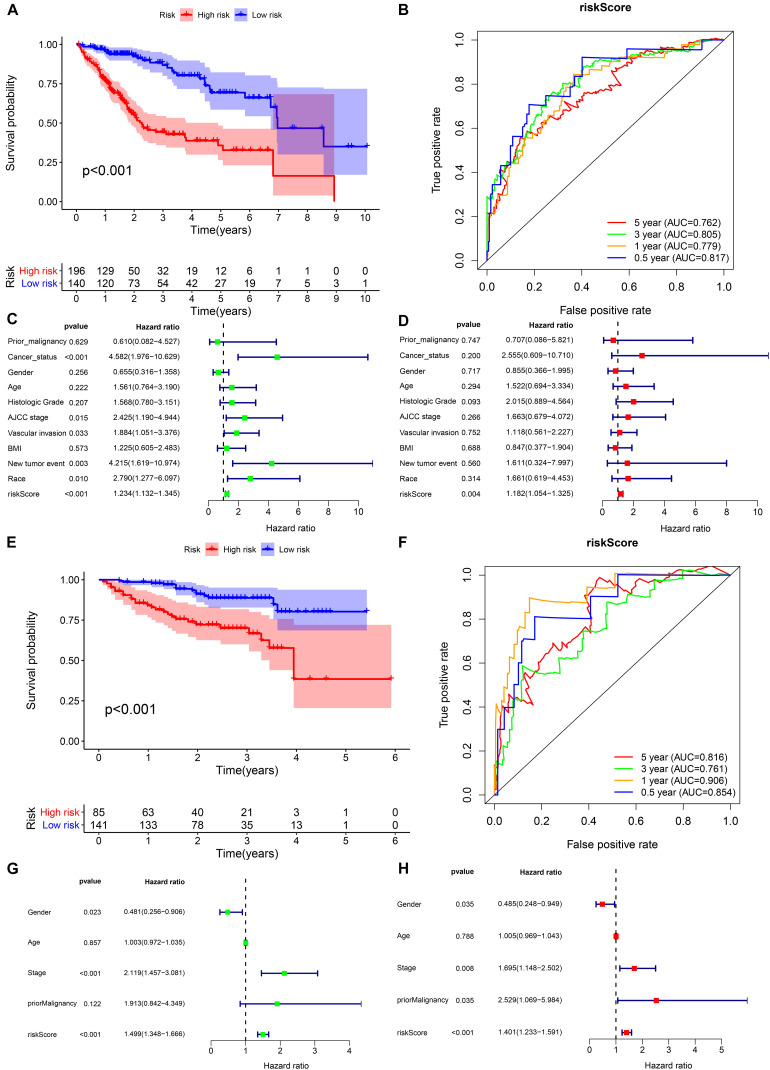
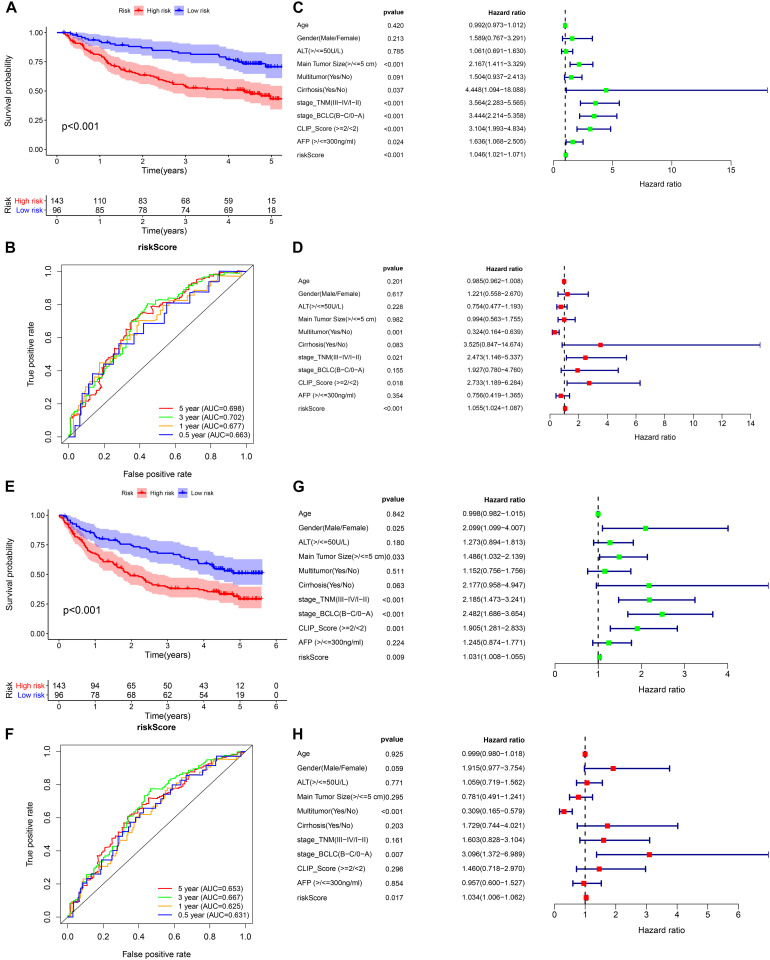
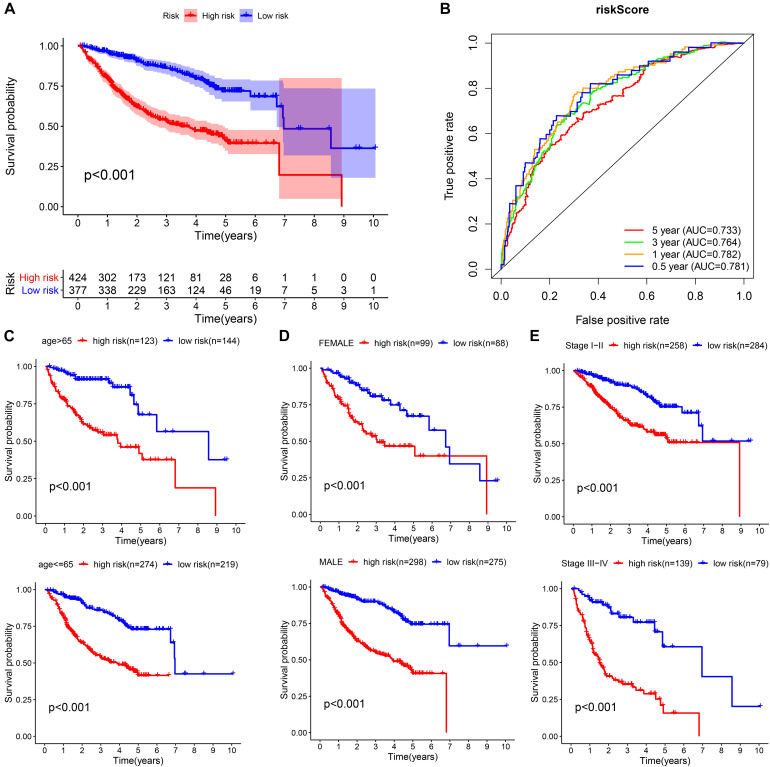
Results: The prognostic model consisting of 15 immune gene pairs showed high predictive value for short- and long-term survival of HCC in three independent cohorts. Based on univariate multivariate Cox regression analysis, the prognostic model could be used to independently predict the prognosis in each independent cohort. The immune score, stromal score, and estimated score values were lower in the high-risk group than in the low-risk group. As shown by the chi-square test, the prognostic model exhibited an obvious correlation with the tumor stage [American Joint Committee on Cancer tumor-node-metastasis (AJCC-TNM) (p < 0.001), Barcelona Clinic Liver Cancer (BCLC) (p = 0.003)], histopathological grade (p = 0.033), vascular invasion (p = 0.009), maximum tumor diameter (p = 0.013), and background of liver cirrhosis (p < 0.001). GSEA revealed that the high-risk group had an enrichment of many oncology features, including the cell cycle, mismatch repair, DNA replication, RNA degradation, etc.
Conclusion: Our research developed and validated a reliable prognostic model associated with TMB for HCC, which may help to further enrich the therapeutic targets of HCC.
Keywords: hepatocellular carcinoma; immune; prognostic; signature; tumor mutation burden.
Copyright © 2020 Huo, Wu and Zang.
Figures
Similar articles
-
Risk predictive model based on three immune-related gene pairs to assess prognosis and therapeutic sensitivity for hepatocellular carcinoma.World J Surg Oncol. 2022 Aug 5;20(1):252. doi: 10.1186/s12957-022-02681-4. World J Surg Oncol. 2022. PMID: 35932027 Free PMC article.
-
A novel signature incorporating lipid metabolism- and immune-related genes to predict the prognosis and immune landscape in hepatocellular carcinoma.Front Oncol. 2023 Jun 6;13:1182434. doi: 10.3389/fonc.2023.1182434. eCollection 2023. Front Oncol. 2023. PMID: 37346073 Free PMC article.
-
Identification and Validation of Ubiquitin-Specific Proteases as a Novel Prognostic Signature for Hepatocellular Carcinoma.Front Oncol. 2021 Feb 25;11:629327. doi: 10.3389/fonc.2021.629327. eCollection 2021. Front Oncol. 2021. PMID: 33718205 Free PMC article.
-
Establishment of a Necroptosis-Related Prognostic Signature to Reveal Immune Infiltration and Predict Drug Sensitivity in Hepatocellular Carcinoma.Front Genet. 2022 Jul 25;13:900713. doi: 10.3389/fgene.2022.900713. eCollection 2022. Front Genet. 2022. PMID: 35957699 Free PMC article.
-
Identification of a prognostic and therapeutic immune signature associated with hepatocellular carcinoma.Cancer Cell Int. 2021 Feb 10;21(1):98. doi: 10.1186/s12935-021-01792-4. Cancer Cell Int. 2021. PMID: 33568167 Free PMC article.
Cited by
-
Development and Validation of a Novel Metabolic-Related Signature Predicting Overall Survival for Pancreatic Cancer.Front Genet. 2021 May 28;12:561254. doi: 10.3389/fgene.2021.561254. eCollection 2021. Front Genet. 2021. PMID: 34122496 Free PMC article.
-
Comprehensive characterization of m6A methylation and its impact on prognosis, genome instability, and tumor microenvironment in hepatocellular carcinoma.BMC Med Genomics. 2022 Mar 8;15(1):53. doi: 10.1186/s12920-022-01207-x. BMC Med Genomics. 2022. PMID: 35260168 Free PMC article.
-
Significance of cuproptosis-related lncRNA signature in LUAD prognosis and immunotherapy: A machine learning approach.Thorac Cancer. 2023 Jun;14(16):1451-1466. doi: 10.1111/1759-7714.14888. Epub 2023 Apr 19. Thorac Cancer. 2023. PMID: 37076991 Free PMC article.
-
Identification of a Novel Four-Gene Signature Correlated With the Prognosis of Patients With Hepatocellular Carcinoma: A Comprehensive Analysis.Front Oncol. 2021 Mar 12;11:626654. doi: 10.3389/fonc.2021.626654. eCollection 2021. Front Oncol. 2021. PMID: 33777771 Free PMC article.
-
Development and Validation of a Robust Immune-Related Prognostic Signature for Gastric Cancer.J Immunol Res. 2021 Apr 30;2021:5554342. doi: 10.1155/2021/5554342. eCollection 2021. J Immunol Res. 2021. PMID: 34007851 Free PMC article.
References
-
- Alborelli I., Leonards K., Rothschild S. I., Leuenberger L. P., Savic Prince S., Mertz K. D., et al. (2020). Tumor mutational burden assessed by targeted NGS predicts clinical benefit from immune checkpoint inhibitors in non-small cell lung cancer. J. Pathol. 250 19–29. 10.1002/path.5344 - DOI - PMC - PubMed
LinkOut - more resources
Full Text Sources
Research Materials