. 2020 Dec;6(12):e05635.
doi: 10.1016/j.heliyon.2020.e05635. Epub 2020 Nov 30.

Proteins from SARS-CoV-2 reduce T cell proliferation: A mirror image of sepsis

Affiliations

Proteins from SARS-CoV-2 reduce T cell proliferation: A mirror image of sepsis

José Avendaño-Ortiz et al. Heliyon. 2020 Dec.

Erratum in

Abstract

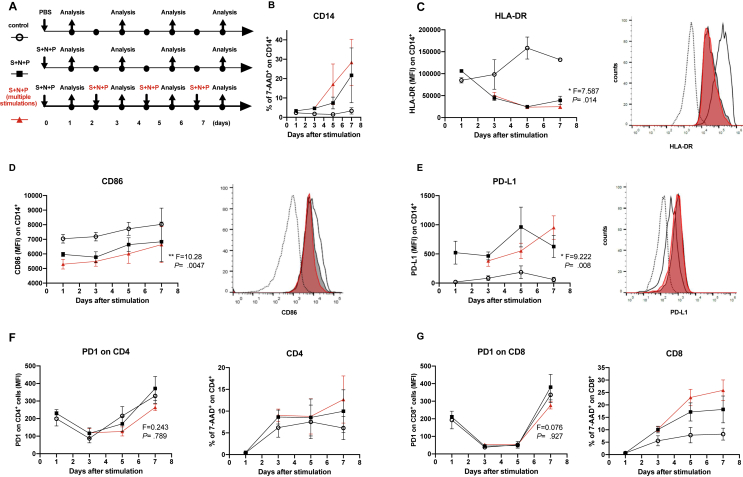
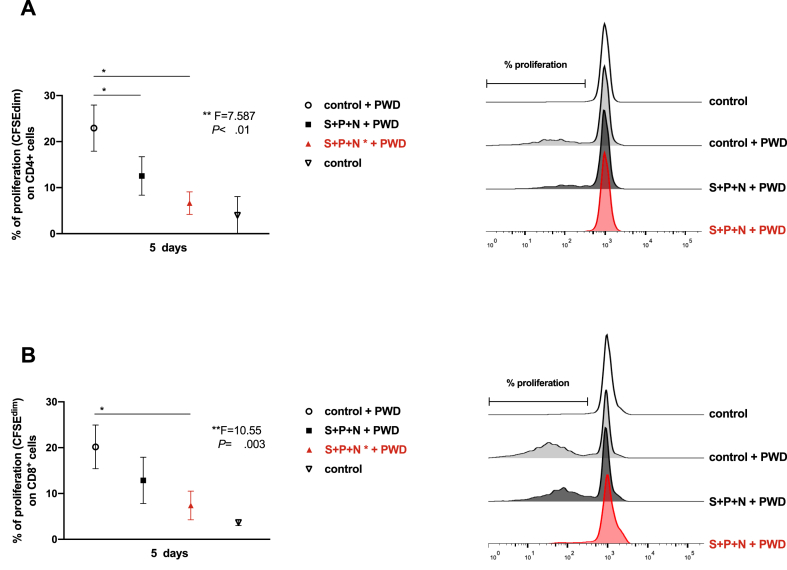
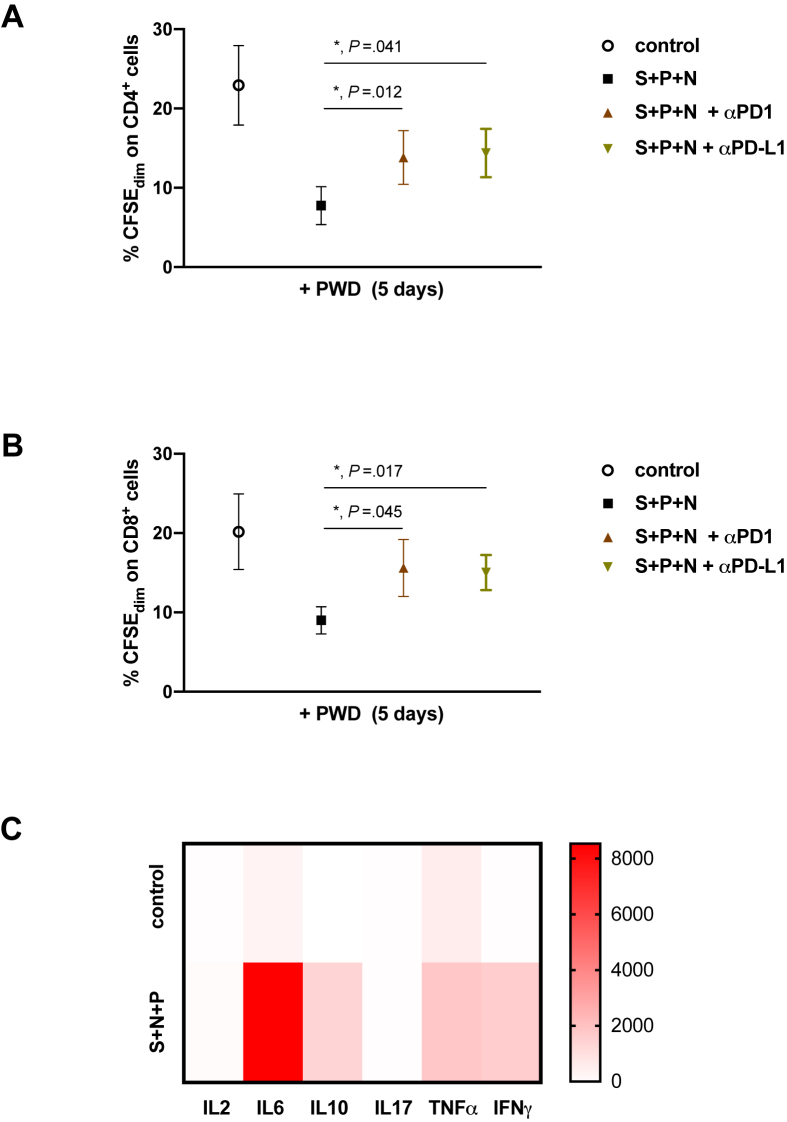
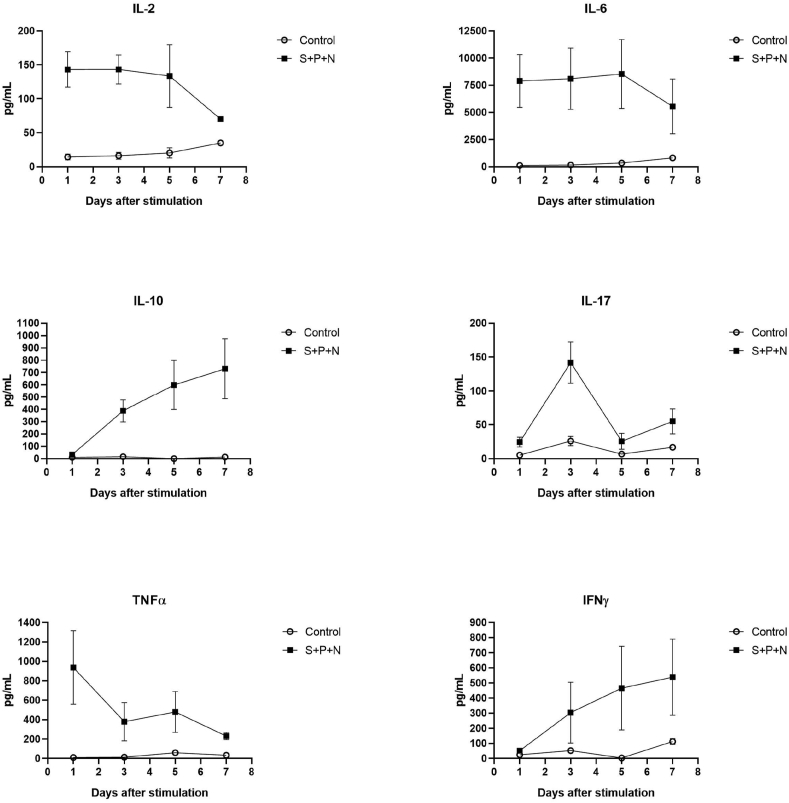
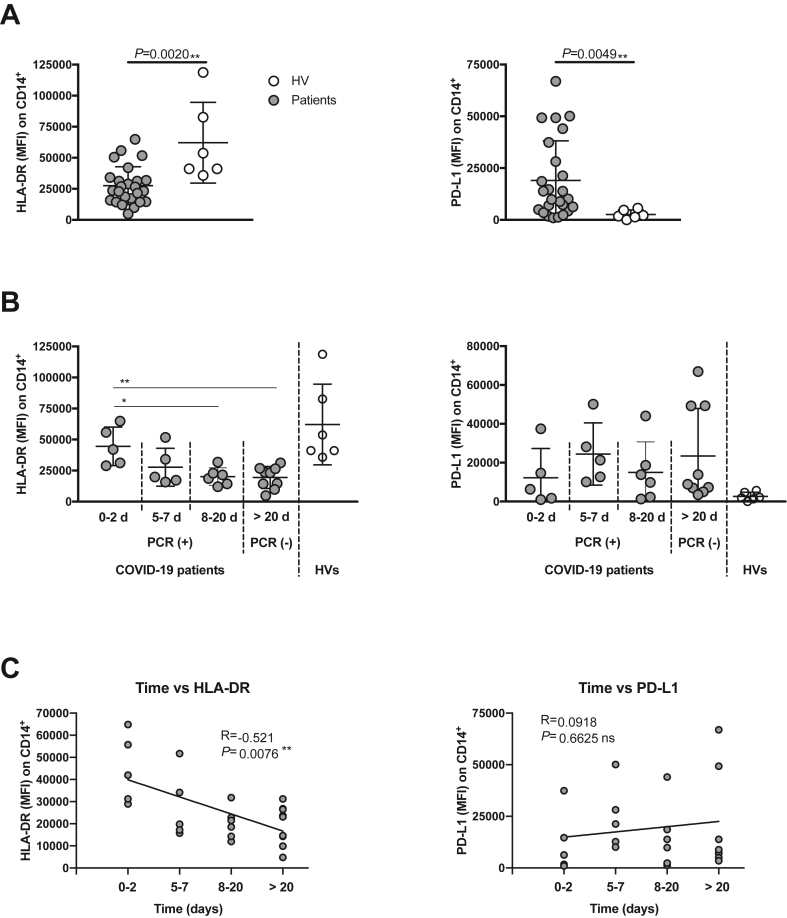
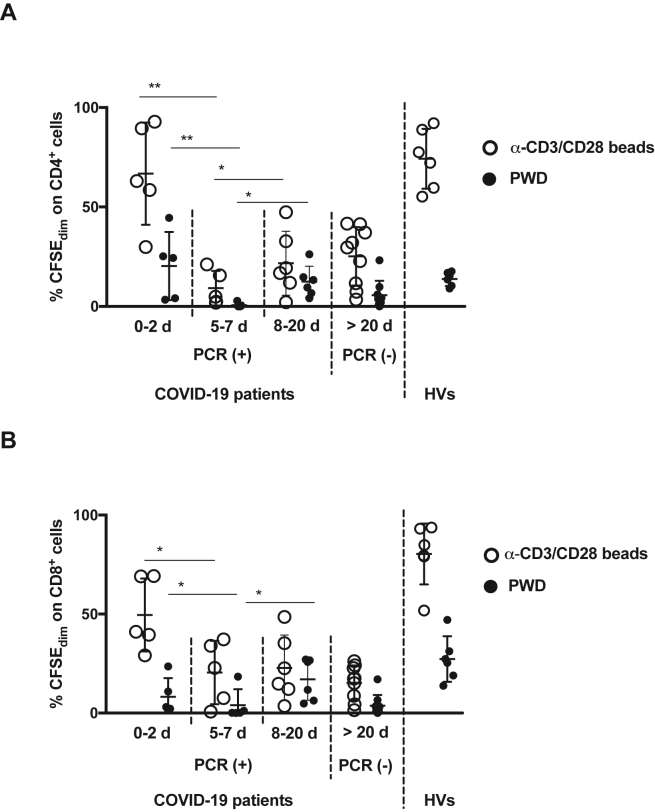
Increased cytokine levels, acute phase reactants and immune checkpoint expression changes have been described in patients with Coronavirus Disease 2019 (COVID-19). Here, we have reported a monocyte polarization towards a low HLA-DR and high PD-L1 expression after long exposure to proteins from SARS-CoV-2. Moreover, CD86 expression was also reduced over SARS-CoV-2 proteins exposure. Additionally, T-cells proliferation was significantly reduced after stimulation with these proteins. Eventually, patients with long-term SARS-CoV-2 infection also exhibited a significant blockade of T-cells proliferation.

Keywords: COVID19; Immune checkpoints; Immunology; Infectious disease; Inflammation; PD-L1/PD-1; Pathology; Sepsis; T cell exhaustion; T cell proliferation; Virology.


Conflict of interest statement

The authors declare no conflict of interest.

Figures

Figure 1
Figure 1
Proteins from SARS-CoV-2 polarize human monocytes towards an HLA-DRlowPD-L1high phenotype. (A) Experimental design. Peripheral blood mononuclear cells (PBMCs) from healthy volunteers were cultured for 7 days and stimulated once or every 48 h with a cocktail of proteins from the virus including S glycoprotein (250 ng/mL), N protein (250 ng/mL) and the Papain-like protease (P, 25 nM). (B) Viability of CD14+ cells were measured by 7-AAD staining of dead cells cultured following the experimental design (A) is shown. (C) Mean Fluorescence Intensity (MFI) expressions of HLA-DR on CD14+ cells are shown (left panel) (∗, p < 0.05, one-way ANOVA test), n = 5. A representative histogram overlay is shown, fluorescent minus one (FMO, dotted line), unstimulated control (empty), S + N + P (solid black), S + N + P multiple stimulations (solid red), right panel. (D) MFI expressions of CD86 on CD14+ cells are shown (left panel) (∗, p < 0.05, one-way ANOVA test), n = 5. A representative overlay is shown, fluorescent minus one (FMO, dotted line), unstimulated control (empty), S + N + P (solid black), S + N + P multiple stimulations (solid red), right panel. (E) MFI expressions of PD-L1 on CD14+ cells are shown (left panel) (∗, p < 0.05, one-way ANOVA test), n = 5. A representative overlay is shown, fluorescent minus one (FMO, dotted line), unstimulated control (empty), S + N + P (solid black), S + N + P multiple stimulations (solid red), right panel. (F and G, left panels) Expressions of PD-1 on CD4+ (F) and CD8+ (G) cells are shown. Viability of CD4+ (F) and CD8+ (G) cells are shown (right panels).
Figure 2
Figure 2
Long exposure to SARS-CoV-2 proteins reduces the T lymphocytes proliferative ability in vitro.PBMCs from healthy volunteers were labelled with CFSE, then cells were exposed or not (open circle) to S, N and P proteins for 5 days (solid black square) or multiple stimulations (Figure 1A) until 5 days (solid red triangle). Cells were also stimulated or not (open triangle) with Pokeweed (PWD, 2.5 μg/mL). (A) Percentage of proliferative CD4+ populations (CFSEdim), measured by flow cytometry, are shown (left panel) (∗, p < 0.05, Mann-Whitney t-test; ∗∗, p < 0.01, one-way ANOVA test), n = 5. A representative histogram overlay is shown (right panel). (B) Percentage of proliferative CD8+ populations, measured by flow cytometry, are shown (left panel) (∗, p < 0.05, Mann-Whitney t test; ∗∗, p < 0.01, one-way ANOVA test), n = 5. A representative histogram overlay is shown (right panel).
Figure 3
Figure 3
T-cells proliferation is recovered by PD-L1/PD-1 axis blockage. PBMCs from healthy volunteers were labelled with CFSE, then cells were exposed or not (open circle) to S, N and P proteins for 5 days (solid black square). Anti-PD-L1 (solid black triangle) or anti-PD-1 (solid grey inverted triangle) were added. All cultures were also stimulated with Pokeweed (PWD, 2.5 μg/mL). Percentage of proliferative (CFSEdim) CD4+ (A) and CD8+ (B) populations, measured by flow cytometry, are shown (∗, p < 0.05, paired t-test), n = 5. (C) An array analysis is shown for indicated cytokines, that were analyzed in the supernatant by Cytometric Bead Array (CBA) after stimulation with S, N and P proteins from SARS-CoV-2 (S + N + P) or not (control) of PBMCs from healthy volunteers for 5 days; n = 5.
Figure 4
Figure 4
SARS-CoV-2 proteins induce cytokine production. Peripheral blood mononuclear cells (PBMCs) from healthy volunteers were stimulated with SARS-CoV-2 proteins S glycoprotein (250 ng/mL), N protein (250 ng/mL) and the Papain-like protease (P, 25 nM). Levels of IL-2, IL-6, IL-10, IL-17, TNFα and INFγ in cell culture supernatants after 24, 72, 120 and 168 h are shown, n = 5.
Figure 5
Figure 5
Monocytes from COVID-19 patients have decreased HLA-DR and increased PD-L1 expression. (A) HLA-DR (left) and PD-L1 (right) expression on CD14+ cells from COVID-19 patients (n = 25) and HVs (n = 6). (B) COVID-19 patients were classified according their admission time. Their HLA-DR (left) and PD-L1 (right) expression on CD14+ cells are shown. (C) Spearman correlation between sample collection time collection from patient admission time and the expression of HLA-DR (left) and PD-L1 (right). ∗, p < 0.05; ∗∗, p < 0.01 Mann-Whitney t-test for (A) and (B) and Spearman correlation test in (C); MFI, Mean Fluorescence Intensity; R = Spearman r; vs, versus.
Figure 6
Figure 6
Patients exposed to SARS-CoV-2 exhibit a low rate of T-cells proliferation. Four groups of COVID-19 patients were recruited according to their length of hospital stay: 0–2 days (n = 5), 5–7 days (n = 5), 8–19 days (n = 6), or more than 20 days (n = 9). PBMCs were isolated from these and from healthy volunteers (HVs, n = 6), labelled with CFSE and stimulated with Pokeweed (PWD, 2.5 μg/mL, solid black circle) or anti CD3/CD28 beads (0.5 μL/well, open black circle) for 5 days. Percentage of proliferative CD4+ (A) and CD8+ (B) populations, measured by flow cytometry, are shown (∗, p < 0.05; ∗∗, p < 0.01 Mann-Whitney t-test). The RT-PCR status for SARS-CoV-2 infection at moment of blood recruitment for each group of patients are also shown.

References

    1. Astuti I. Null Ysrafil, Severe Acute Respiratory Syndrome Coronavirus 2 (SARS-CoV-2): an overview of viral structure and host response. Diabetes Metab. Syndr. 2020;14:407–412. - PMC - PubMed
    1. Borobia A.M., Carcas A.J., Arnalich F., Álvarez-Sala R., Monserrat-Villatoro J., Quintana M., Figueira J.C., Torres Santos-Olmo R.M., García-Rodríguez J., Martín-Vega A., Buño A., Ramírez E., Martínez-Alés G., García-Arenzana N., Núñez M.C., Martí-de-Gracia M., Moreno Ramos F., Reinoso-Barbero F., Martin-Quiros A., Rivera Núñez A., Mingorance J., Carpio Segura C.J., Prieto Arribas D., Rey Cuevas E., Prados Sánchez C., Rios J.J., Hernán M.A., Frías J., Arribas J.R. Null on behalf of the covid hulp working group, A cohort of patients with COVID-19 in a major teaching hospital in Europe. J. Clin. Med. 2020;9 - PMC - PubMed
    1. Zhou F., Yu T., Du R., Fan G., Liu Y., Liu Z., Xiang J., Wang Y., Song B., Gu X., Guan L., Wei Y., Li H., Wu X., Xu J., Tu S., Zhang Y., Chen H., Cao B. Clinical course and risk factors for mortality of adult inpatients with COVID-19 in Wuhan, China: a retrospective cohort study. Lancet. 2020;395:1054–1062. - PMC - PubMed
    1. Guan W.-J., Ni Z.-Y., Hu Y., Liang W.-H., Ou C.-Q., He J.-X., Liu L., Shan H., Lei C.-L., Hui D.S.C., Du B., Li L.-J., Zeng G., Yuen K.-Y., Chen R.-C., Tang C.-L., Wang T., Chen P.-Y., Xiang J., Li S.-Y., Wang J.-L., Liang Z.-J., Peng Y.-X., Wei L., Liu Y., Hu Y.-H., Peng P., Wang J.-M., Liu J.-Y., Chen Z., Li G., Zheng Z.-J., Qiu S.-Q., Luo J., Ye C.-J., Zhu S.-Y., Zhong N.-S. China medical treatment Expert group for covid-19, clinical characteristics of coronavirus disease 2019 in China. N. Engl. J. Med. 2020;382:1708–1720. - PMC - PubMed
    1. Chen T., Wu D., Chen H., Yan W., Yang D., Chen G., Ma K., Xu D., Yu H., Wang H., Wang T., Guo W., Chen J., Ding C., Zhang X., Huang J., Han M., Li S., Luo X., Zhao J., Ning Q. Clinical characteristics of 113 deceased patients with coronavirus disease 2019: retrospective study. BMJ. 2020;368:m1091. - PMC - PubMed