. 2020 Nov 1;4(11):e2020GH000263.
doi: 10.1029/2020GH000263. eCollection 2020 Nov.

A Geologically Based Indoor-Radon Potential Map of Kentucky

Affiliations

A Geologically Based Indoor-Radon Potential Map of Kentucky

William C Haneberg et al. Geohealth. .

Abstract

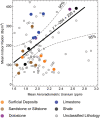
We combined 71,930 short-term (median duration 4 days) home radon test results with 1:24,000-scale bedrock geologic map coverage of Kentucky to produce a statewide geologically based indoor-radon potential map. The test results were positively skewed with a mean of 266 Bq/m3, median of 122 Bq/m3, and 75th percentile of 289 Bq/m3. We identified 106 formations with ≥10 test results. Analysis of results from 20 predominantly monolithologic formations showed indoor-radon concentrations to be positively skewed on a formation-by-formation basis, with a proportional relationship between sample means and standard deviations. Limestone (median 170 Bq/m3) and dolostone (median 130 Bq/m3) tended to have higher indoor-radon concentrations than siltstones and sandstones (median 67 Bq/m3) or unlithified surficial deposits (median 63 Bq/m3). Individual shales had median values ranging from 67 to 189 Bq/m3; the median value for all shale values was 85 Bq/m3. Percentages of values falling above the U.S. Environmental Protection Agency (EPA) action level of 148 Bq/m3 were sandstone and siltstone: 24%, unlithified clastic: 21%, dolostone: 46%, limestone: 55%, and shale: 34%. Mississippian limestones, Ordovician limestones, and Devonian black shales had the highest indoor-radon potential values in Kentucky. Indoor-radon test mean values for the selected formations were also weakly, but statistically significantly, correlated with mean aeroradiometric uranium concentrations. To produce a map useful to nonspecialists, we classified each of the 106 formations into five radon-geologic classes on the basis of their 75th percentile radon concentrations. The statewide map is freely available through an interactive internet map service.

Keywords: geohealth; geologic map; lung cancer; public health; radon; scientific communication.


Conflict of interest statement

The authors declare no conflicts of interest relevant to this study.

Figures

Figure 1
Figure 1
Radon potential of Kentucky by county, produced using 1993 U.S. Geological Survey and U.S. Environmental Protection Agency data.
Figure 2
Figure 2
Simplified geology of Kentucky showing the distribution of field‐mappable rock units classified according to stratigraphic position.
Figure 3
Figure 3
Aeroradiometric uranium concentration map of Kentucky. White areas within the map indicate urban areas over which data were not available. Data source: Phillips et al. (1993).
Figure 4
Figure 4
Locations of the 71,930 home radon test kits used as the basis for the Kentucky statewide indoor‐radon potential map.
Figure 5
Figure 5
Histogram and normal distribution defined using the sample mean and standard deviation of 71,930 log‐transformed home radon test results used for the Kentucky statewide indoor‐radon potential map.
Figure 6
Figure 6
Distribution of indoor‐radon concentrations from homes built on 20 typical bedrock and surficial deposits in Kentucky. The all‐sample distribution of 71,930 points is shown at the bottom of the plot for comparison. Lithologic abbreviations used in the formation names are Ss: sandstone, Slt: siltstone, Dol: dolostone, Ls: limestone, Sh: shale. WHO: World Health Organization action level. EPA: U.S. Environmental Protection Agency action level.
Figure 7
Figure 7
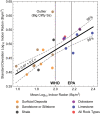
Mean versus standard deviation of indoor‐radon concentrations in homes built on 20 typical types of bedrock and surficial deposits in Kentucky, with the all‐sample distribution (red) shown for comparison. Dashed lines show the 95% mean confidence bands for the solid black best fit line. WHO: World Health Organization action level. EPA: U.S. Environmental Protection Agency action level.
Figure 8
Figure 8
Mean indoor‐radon test kit radon concentrations versus mean aeroradiometric uranium concentrations for statewide indoor‐radon potential map units. Colored circles represent the 20 monolithologic units shown in Figure 7. Gray circles represent the remaining maps units, which were not classified according to lithology. Regression line and 95% mean confidence bands are for the 20 monolithologic units.
Figure 9
Figure 9
Geologically based indoor‐radon potential map of Kentucky. Map category breaks were converted from local customary units of pCi/L (1 pCi/L = 37 Bq/m3) and rounded upward to the nearest 10 Bq/m3 to simplify the map legend.

References

    1. Al‐Zoughool, M. , & Krewski, D. (2009). Health effects of radon: A review of the literature. International Journal of Radiation Biology, 85, 57–69. 10.1080/09553000802635054 - DOI - PubMed
    1. American Cancer Society (2019). Cancer facts and figures 2019. Atlanta, GA: American Cancer Society; Retrieved from https://www.cancer.org/content/dam/cancer‐org/research/cancer‐facts‐and‐...
    1. Anderson, W. H. , Sparks, T. N. , & Weisenfluh, G. A. (2004). Completion of the first phase of the Kentucky digital geologic mapping program In Digital mapping techniques '04—Workshop proceedings (U.S. Geological Survey Open‐File Report 2004–1451). Washington, DC: U.S. Geological Survey; Retrieved from https://pubs.usgs.gov/of/2004/1451/anderson/index.html
    1. Barros, N. , Steck, D. J. , & Field, R. W. (2016). Utility of short‐term basement screening radon measurements to predict year‐long residential radon concentrations on upper floors. Radiation Protection Dosimetry, 171, 405–413. 10.1093/rpd/ncv416 - DOI - PMC - PubMed
    1. Barros, N. G. , Steck, D. J. , & Field, R. W. (2014). A comparison of winter short‐term and annual average radon measurements in basements of a radon‐prone region and evaluation of further radon testing indicators. Health Physics, 106, 535–544. 10.1097/HP.0000000000000004 - DOI - PMC - PubMed

LinkOut - more resources