

An organoid-derived bronchioalveolar model for SARS-CoV-2 infection of human alveolar type II-like cells
- PMID: 33283287
- PMCID: PMC7883112
- DOI: 10.15252/embj.2020105912
An organoid-derived bronchioalveolar model for SARS-CoV-2 infection of human alveolar type II-like cells
Abstract
Severe acute respiratory syndrome coronavirus 2 (SARS-CoV-2) causes coronavirus disease 2019 (COVID-19), which may result in acute respiratory distress syndrome (ARDS), multiorgan failure, and death. The alveolar epithelium is a major target of the virus, but representative models to study virus host interactions in more detail are currently lacking. Here, we describe a human 2D air-liquid interface culture system which was characterized by confocal and electron microscopy and single-cell mRNA expression analysis. In this model, alveolar cells, but also basal cells and rare neuroendocrine cells, are grown from 3D self-renewing fetal lung bud tip organoids. These cultures were readily infected by SARS-CoV-2 with mainly surfactant protein C-positive alveolar type II-like cells being targeted. Consequently, significant viral titers were detected and mRNA expression analysis revealed induction of type I/III interferon response program. Treatment of these cultures with a low dose of interferon lambda 1 reduced viral replication. Hence, these cultures represent an experimental model for SARS-CoV-2 infection and can be applied for drug screens.
Keywords: COVID-19; SARS-CoV-2; airway organoids; bronchioalveolar-like; pneumocytes.
© 2021 The Authors. Published under the terms of the CC BY NC ND 4.0 license.
Conflict of interest statement
H.C. is inventor on patents held by the Royal Netherlands Academy of Arts and Sciences that cover organoid technology. H.C.’s full disclosure is given at
Figures
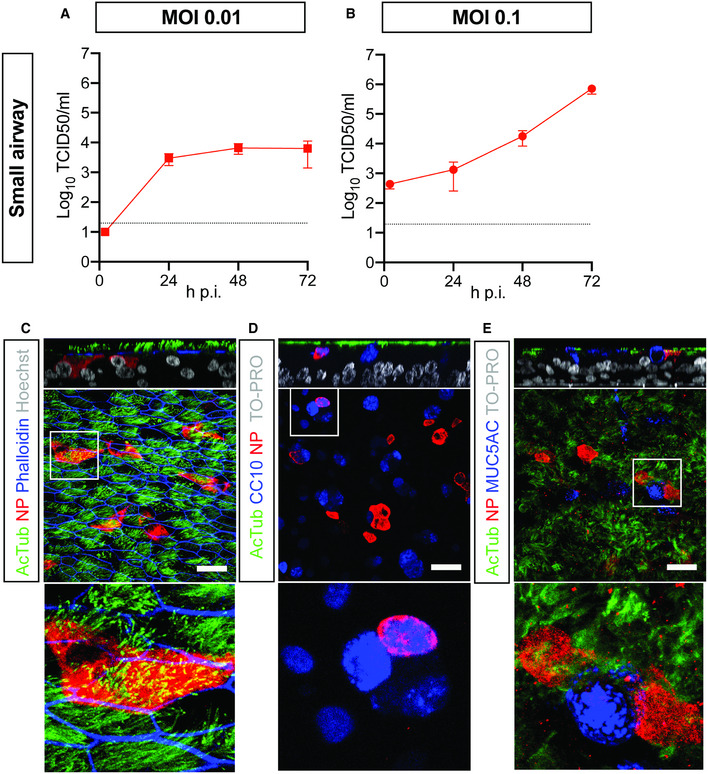
- A, B
Infectious virus titers can be observed by virus titrations on VeroE6 cells of apical washes at 2, 24, 48, and 72 h after infection at MOI 0.01 (A) or 0.1 (B) with SARS‐CoV‐2 (red). The dotted line indicates the lower limit of detection. Error bars represent SEM. N = 4. H p.i. = hours post‐infection.
- C–E
Immunofluorescent staining of SARS‐CoV‐2 infected differentiated small airway cultures. Nucleoprotein (NP) stains viral capsid (red), which colocalized with the ciliated cell marker AcTUB (green; (C, D, E)) and club cell marker CC10 (blue; (D)). Phalloidin was included to stain actin (blue; (C)). Goblet cells are identified by MUC5AC (blue; (E)). Scale bars indicate 50 μm.

- A
Immunofluorescent staining of fetal lung bud tip progenitor organoids grown in expansion medium co‐expressing stem cell markers Sox2 (green) and Sox9 (red). Phalloidin (white) was used to stain actin.
- B
Immunofluorescent staining of rare HTII‐280 + type II pneumocytes (green) in a subpopulation of fetal lung bud tip progenitor organoids grown in expansion medium.
- C
Schematic of the 2D air–liquid interface bronchioalveolar‐like model.
- D–I
Differentiated lung bud tip organoids at air–liquid interface in co‐culture with donor‐specific human fetal lung fibroblasts. After 14 days of differentiation at air–liquid interface, cells express alveolar type I (HOPX, green, (D); HTI‐56, green, (E)), type II cells (HTII‐280, green, (F); LPCAT1, green, (G); SFTPC (SPC), green, (H)), and basal cell (TP63 (P63), green, (I)) markers in areas containing one cell layer. Dotted lines indicate the barrier between multilayered and single‐layered epithelium.
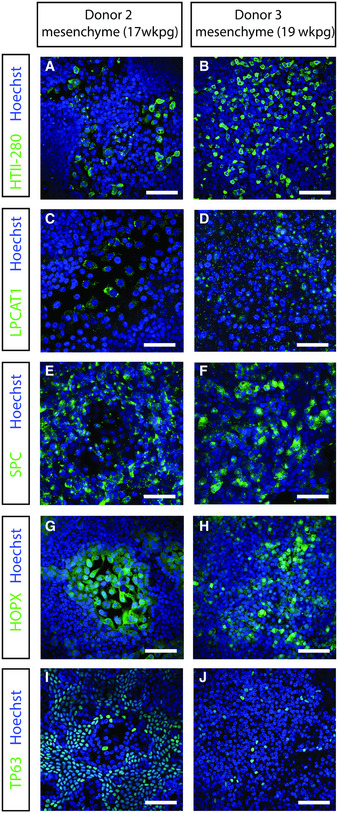
- A–J
Immunofluorescent staining of HTII‐280 (A, B), LPCAT1 (C, D), SPC (E, F), HOPX (G, H), and TP63 (I, J) after 2 weeks of differentiation at air–liquid interface in the presence of mesenchyme in the basal compartment of the Transwell. Nuclei are stained with Hoechst (blue). Scale bars represent 50 μm.
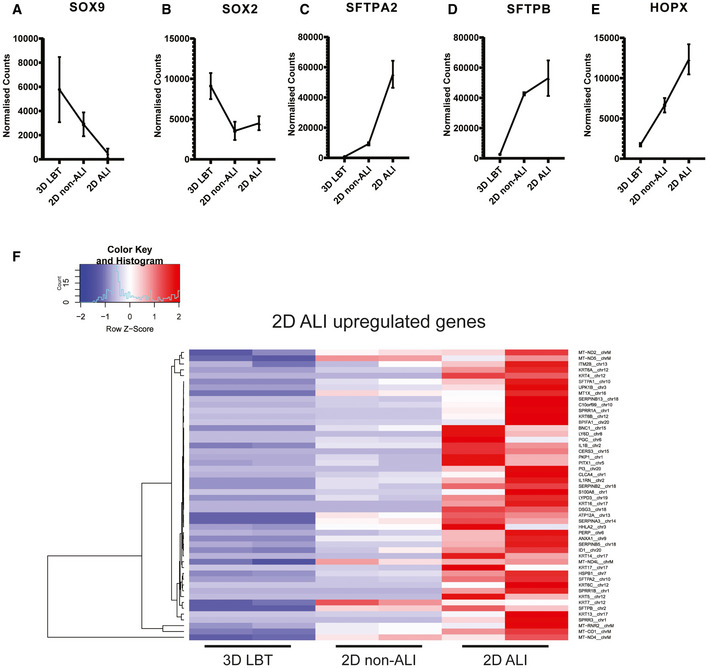
- A–E
Line graphs indicating normalized read count of 3D lung bud tip organoids (3D LBT), airway organoids on transwell system with apical medium (2D non‐ALI), and 2D bronchioalveolar‐like air–liquid cultures (2D ALI). n = 2 and error bars represent stdev. (A, B) Graphs depicting fetal bud tip progenitor markers SOX9 and SOX2. (C, D) Graphs depicting ATII markers SFTPA2 and SFTPB. (E) Graphs depicting ATI marker HOPX.
- F
Heatmaps depicting top 50 enriched genes in 2D bronchioalveolar‐like air–liquid cultures (2D ALI) compared to 3D lung bud tip organoids (3D LBT). N = 2 of 3D LBT, airway organoids on transwell system with apical medium (2D non‐ALI), and 2D ALI. Colored bars represent Z‐scores of log2‐transformed values.
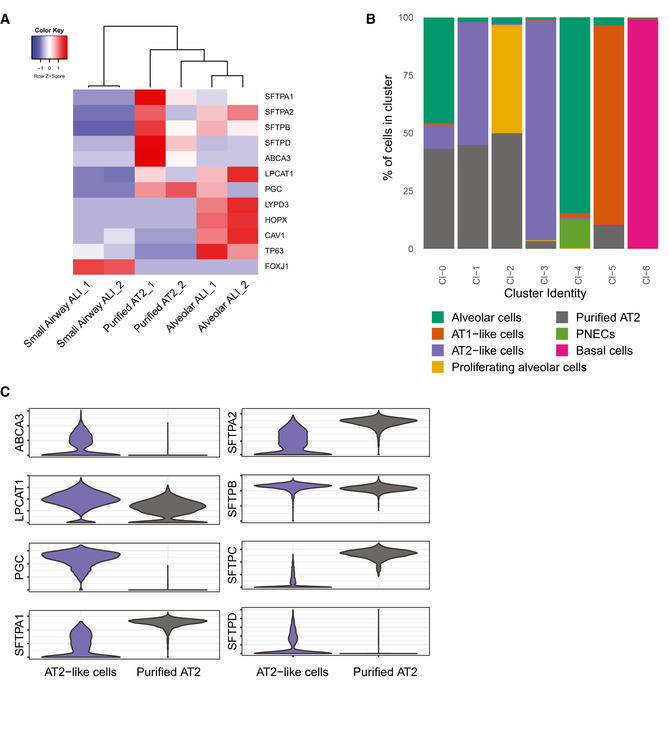
Heatmaps depicting marker genes in 2D small airway air–liquid cultures (small airway ALI), bronchioalveolar‐like air–liquid cultures (alveolar ALI), and published dataset of purified AT2 cells (purified AT2). Colored bars represent Z‐scores of log2‐transformed values.
Barplot indicating percentage of annotated cells within a cluster. Color represents annotated cell identity. Combined current dataset and of GSM2855485 are presented. Indicated annotation is based on separate clustering. Published dataset GSM2855485 is annotated as “Purified AT2”.
Violin plots visualizing expression levels of marker genes for AT2 cells. AT2‐like cells comprise cells annotated as AT2‐like cells in current dataset (clusters 0 and 2). Purified AT2 cells are from published dataset GSM2855485.
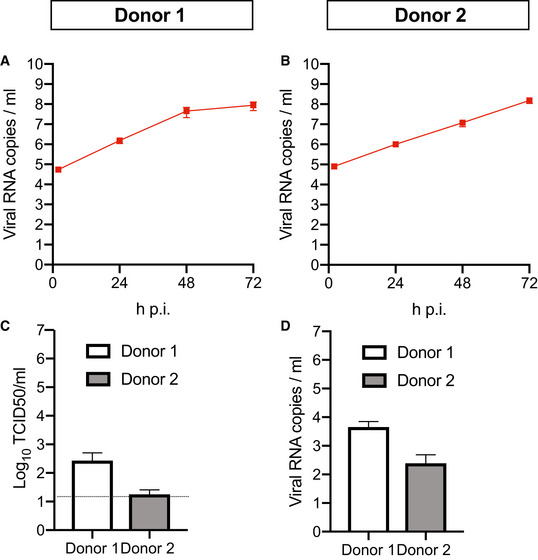
- A, B
Viral SARS‐CoV‐2 RNA titers of apical washes at 2, 24, 48, and 72 h after infection at MOI 0.1 for donor 1 (A) and donor 2 (B).
- C, D
Infectious virus titers as observed by virus titrations on VeroE6 cells (C) and qRT–PCR (D) in basal compartments. The dotted line indicates the lower limit of detection.
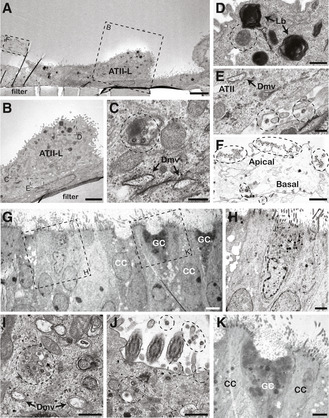
- A–F
Pulmonary alveolar type II‐like (ATII‐L) cells were found in the 2D bronchioalveolar‐like culture (A, B). The early infection of the ATII‐L cell (C) is recognizable by the double‐membranes vesicles (Dmv) and virus particles (circles). (D) Next to the lamellar bodies (Lb), the ATII‐L also contained a lysosomal compartment with internal virus particles (circle). Extracellular virus particles were found in the intercellular space between the ATI‐L and ATII‐L cells (E), albeit at low concentration. Dashed circles indicate viral particles outside of the cell. The remnants of a dead detached cell (F) mainly showed apical‐shed virus particles (in areas marked by dotted lines), whereas the basal side was relatively free of virus particles.
- G–K
Ciliated cells (CC; (H)) and goblet cells (GC; (K)) are visible in the cross section through the 2D small airway culture after 8 weeks of differentiation. SARS‐CoV‐2 replication (I) and virus shedding (J) were found to be associated particularly with ciliated cells, whereas no infections were found in goblet cells (K). Dashed circles indicate viral particles inside and outside the cell.
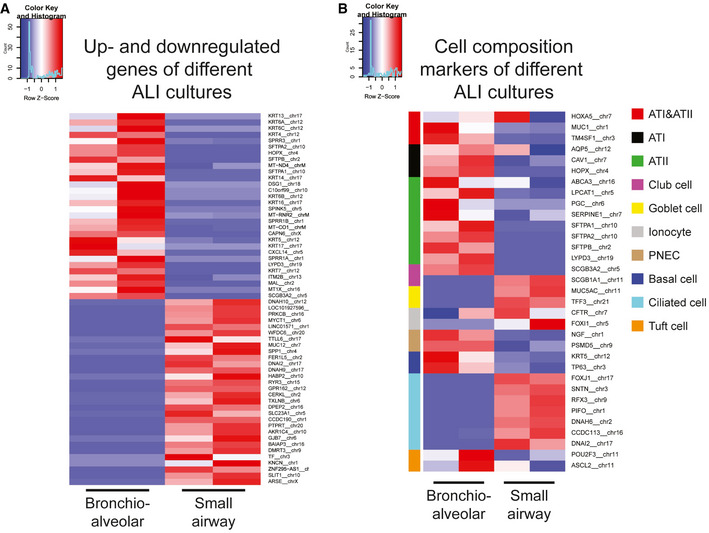
Heatmaps depicting top 30 up‐ and downregulated genes in 2D bronchioalveolar‐like air–liquid cultures (bronchioalveolar) compared to small airway air–liquid interface cultures (small airway). Colored bars represent Z‐scores of log2‐transformed values.
Heatmaps depicting pulmonary cell type marker genes in 2D bronchioalveolar‐like air–liquid cultures (bronchioalveolar) and small airway air–liquid interface cultures (small airway). Color‐coded bars indicate which cell type is marked by the presented gene. Colored bars represent Z‐scores of log2‐transformed values.
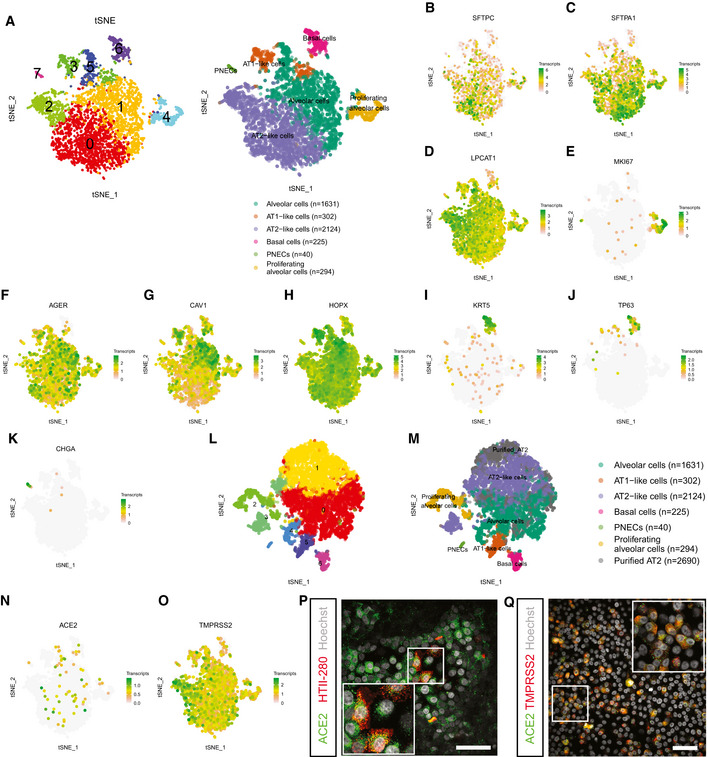
- A
t‐SNE maps showing clustering based on differentially expression analysis and highlighting cell type identification of bronchioalveolar cultures based on cell makers. Each color represents a cluster or different cell type. Number indicates number of cells in cluster identified as cell type presented.
- B–K
t‐SNE maps highlighting the expression of marker genes for each of the cell types. Transcript counts are given in a Log2 scale.
- L
t‐SNE map showing clustering based on differentially expression analysis including dataset from (A) and published dataset of GSM2855485. Each color represents a single cluster.
- M
t‐SNE map showing clustering of (L) with annotation of cell types. Cell type annotation is transferred from (A), and published dataset GSM2855485 is annotated as “Purified AT2”. Number indicates number of cells in cluster identified as cell type presented.
- N, O
t‐SNE maps highlighting the expression of SARS‐CoV‐2 entry receptors ACE2 (N) and TMPRSS2 (O). Transcript counts are given in a Log2 scale.
- P
Differentiated bronchioalveolar cultures express SARS‐CoV‐2 entry receptor ACE2 (green) on ATII‐like cells marked by HTII‐280 (red). Nuclei are stained with Hoechst and shown in white. Scale bar indicates 50 μm.
- Q
Bronchioalveolar cultures co‐express both entry receptors ACE2 (green) and TMPRSS2 (red). Nuclei are stained with Hoechst and shown in white. Scale bar indicates 50 μm.
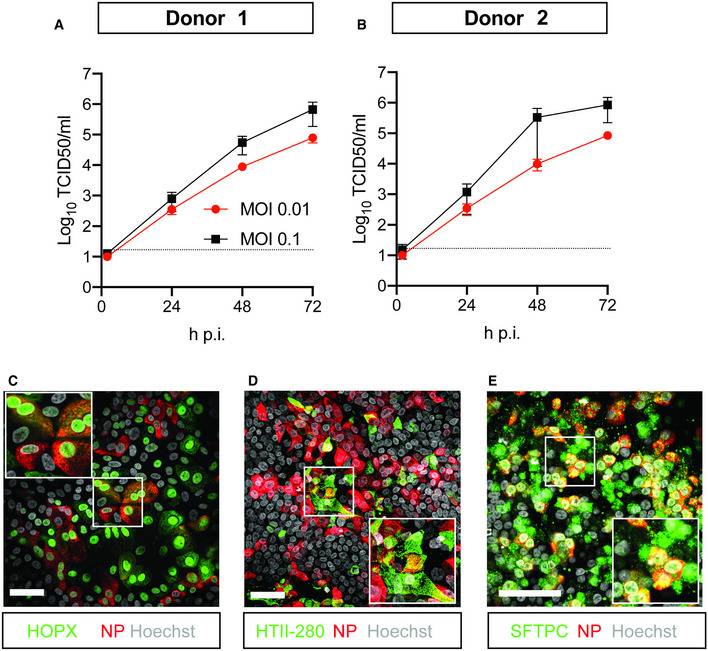
- A, B
Infectious virus titers can be observed by virus titrations on VeroE6 cells of apical washes at 2, 24, 48, and 72 h after infection of bronchioalveolar‐like cells from donor 1 (A) and donor 2 (B) at MOI 0.01 (red) or 0.1 (black) with SARS‐CoV‐2. The dotted line indicates the lower limit of detection. Error bars represent SEM. N = 4 for all except donor 2 MOI 0.1, which is N = 3. H p.i. = hours post‐infection.
- C–E
Immunofluorescent staining of SARS‐CoV‐2‐infected differentiated bronchioalveolar‐like cultures. Nucleoprotein (NP) stains viral capsid (red), which colocalized with HOPX (C), HTII‐280 (D), and SFTPC (E). Scale bars indicate 50 μm. Nuclei are stained with Hoechst and shown in white (C‐E).
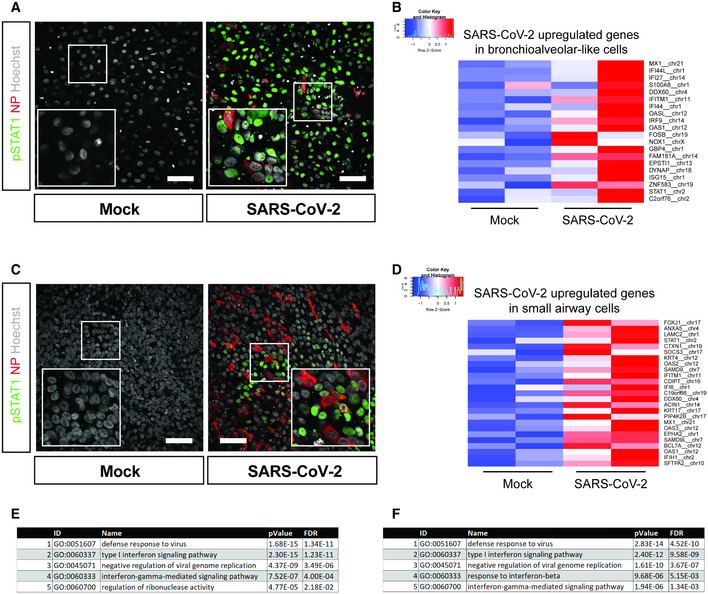
pSTAT1 translocation in mock and SARS‐CoV‐2‐infected bronchioalveolar‐like cells visualized in green. Scale bars indicate 50 μm. Nucleoprotein (NP) stains viral capsid (red). Nuclei are stained with Hoechst (white). Scale bar indicates 50 µm.
Heatmaps depicting top 20 enriched genes based on adjusted P‐value in bronchioalveolar‐like cells after SARS‐CoV‐2 infection. Colored bars represent Z‐scores of log2‐transformed values.
pSTAT1 translocation in mock and SARS‐CoV‐2‐infected small airway cells visualized in green. Nucleoprotein (NP) stains viral capsid (red). Nuclei are stained with Hoechst (white). Scale bar indicates 50 μm.
Heatmaps depicting top 25 enriched genes based on adjusted p‐value and log2 fold changes in small airway cells after SARS‐CoV‐2 infection. Colored bars represent Z‐scores of log2‐transformed values.
GO term enrichment analysis for biological processes of the 20 most significantly up‐regulated genes upon SARS‐CoV‐2 infected in bronchioalveolar‐like cells. P‐values were determined using PANTHER Overrepresentation Test.
GO term enrichment analysis for biological processes of the 25 most significantly up‐regulated genes upon SARS‐CoV‐2 infected in small airway cells. P‐values were determined using PANTHER Overrepresentation Test.
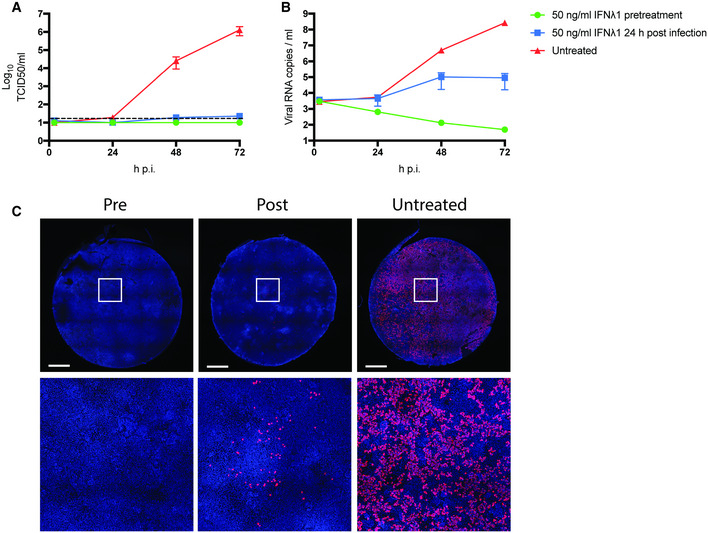
- A, B
SARS‐CoV‐2 replication shown as infectious virus titers (A) and viral RNA copies (B) in apical washes at 2, 24, 48, and 72 h after infection at MOI 0.1. Cultures were either pretreated with 50 ng/ml IFN lambda 1 in the basal compartment 2 h prior to the infection (green), at 24 h p.i. or left untreated. The dotted line indicates the lower limit of detection. Error bars represent SEM. N = 2. H p.i. = hours post‐infection.
- C
Whole well immunofluorescent staining of representative cultures in (A) and (B) using an anti‐NP antibody (red). Nuclei are stained with Hoechst (blue). Scale bar indicates 1 mm.
References
Publication types
MeSH terms
Substances
Associated data
- Actions
- Actions
Grants and funding
LinkOut - more resources
Full Text Sources
Other Literature Sources
Medical
Molecular Biology Databases
Miscellaneous
