. 2021 Mar 15;60(12):6724-6732.
doi: 10.1002/anie.202015340. Epub 2021 Feb 12.

Embedment of Quantum Dots and Biomolecules in a Dipeptide Hydrogel Formed In Situ Using Microfluidics

Affiliations

Embedment of Quantum Dots and Biomolecules in a Dipeptide Hydrogel Formed In Situ Using Microfluidics

Yue Li et al. Angew Chem Int Ed Engl. .

Abstract

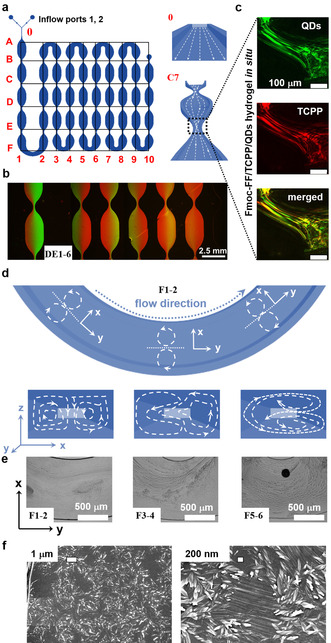
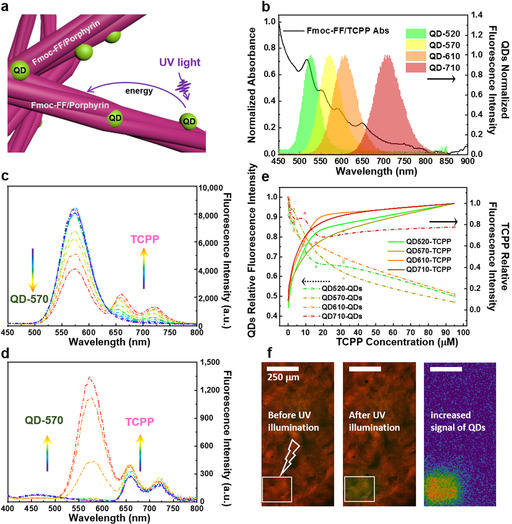
As low-molecular-weight hydrogelators, dipeptide hydrogel materials are suited for embedding multiple organic molecules and inorganic nanoparticles. Herein, a simple but precisely controllable method is presented that enables the fabrication of dipeptide-based hydrogels by supramolecular assembly inside microfluidic channels. Water-soluble quantum dots (QDs) as well as premixed porphyrins and a dipeptide in dimethyl sulfoxide (DMSO) were injected into a Y-shaped microfluidic junction. At the DMSO/water interface, the confined fabrication of a dipeptide-based hydrogel was initiated. Thereafter, the as-formed hydrogel flowed along a meandering microchannel in a continuous fashion, gradually completing gelation and QD entrapment. In contrast to hydrogelation in conventional test tubes, microfluidically controlled hydrogelation led to a tailored dipeptide hydrogel regarding material morphology and nanoparticle distribution.

Keywords: continuous-flow microfluidics; dipeptides; microchannel-confined assembly; nanostructures; supramolecular assembly.


Conflict of interest statement

The authors declare no conflict of interest.

Figures

Figure 1
Figure 1
a) Chemical structures of Fmoc‐FF, TCPP and TAPP. b) Continuous fabrication of a supramolecularly assembled hydrogel by microfluidics. c) Optical microscopy and d) fluorescence images of the dynamic DMSO/water interface (TCPP and Fmoc‐FF were predissolved in DMSO, QD‐520 were dispersed in water). Red indicates TCPP, green indicates QD‐520. e) Photograph of the microdevice employed in this study. f) Fluorescence microscopy image of the Fmoc‐FF/QD‐520/QD‐570/QD‐610/QD‐710 hydrogel formed in a microdevice and illuminated at 365 nm. g) Hydrogel remaining on the glass substrate after removal of the PDMS cover. h) Selected surface topography image of the Fmoc‐FF/TCPP/QD‐520 hydrogel shown in (g).
Figure 2
Figure 2
a) Co‐assembly of the dipeptide and porphyrins. b, c) UV/Vis spectra of the Fmoc‐FF hydrogel, the porphyrins dissolved in DMSO (as the monomer), the porphyrins in water (as aggregates), and the Fmoc‐FF/porphyrin hydrogels (images of TCPP in DMSO solution, TCPP/Fmoc‐FF co‐assembled hydrogel, TAPP in DMSO solution, and TAPP/Fmoc‐FF co‐assembled hydrogel are shown as inserts). d) Emission spectra of Fmoc‐FF hydrogel, TCPP dissolved in DMSO (as the monomer), TCPP in water (as aggregates), and Fmoc‐FF/porphyrin co‐assembled hydrogels with different concentrations of Fmoc‐FF (fluorescence microscopy image of Fmoc‐FF/TCPP co‐assembled hydrogel fabricated by microfluidics after removing the PDMS cover is shown as an insert). e) SEM images of Fmoc‐FF hydrogels at different magnifications, and Fmoc‐FF/TCPP and Fmoc‐FF/TAPP hydrogels with increasing concentrations of TCPP and TAPP of 32, 632, and 1897 mM (from left to right). All scale bars denote 200 nm.
Figure 3
Figure 3
a–e) TEM images of Fmoc‐FF hydrogel (a), Fmoc‐FF/TCPP hydrogel (b), and Fmoc‐FF/TCPP/QD‐520 hydrogels with different concentrations of QD‐520 in water as fabricated by microfluidics (c–e). f) Fluorescence spectra of Fmoc‐FF/TCPP/QDs bulk hydrogels and QDs dispersed in water. g, h) Rheological characterization of Fmoc‐FF/TCPP/QD‐520 bulk hydrogels with different concentrations of QD‐520 (g), and Fmoc‐FF/TCPP bulk hydrogels with different concentrations of TCPP (h). All scale bars denote 100 nm.
Figure 4
Figure 4
a) 2D geometric architecture of microchannels. Right: Illustration of flow direction in the microfluidic device. b) Fluorescence microscopy images of region DE1‐6 labeled in (a); green corresponds to QD‐520 in water, and red to TCPP in DMSO. c) After 3 days and removal of the PDMS cover, CLSM images were recorded of the Fmoc‐FF/TCPP/QD‐520 hydrogel at the narrow position in region C7. d) Illustration of region F1‐2 in (a). Below: Flow direction in microchannels corresponding to positions above. [29a] e) Optical microscopy images of different positions shown in (a), showing dynamic flow and mixing of water and DMSO. f) SEM images of Fmoc‐FF formed in situ in region F1‐2 in (a).
Figure 5
Figure 5
a) SEM images of Fmoc‐FF/TCPP/QDs assembled in different regions of the microfluidic device. b) Normalized emission spectra of QDs dispersed in water, Fmoc‐FF/QDs hydrogel fabricated by microfluidics (MF), and Fmoc‐FF/QDs hydrogels fabricated without microfluidics from the same reaction volume of 100 μL. c) Emission peaks from fitting curves in (b). To collect hydrogel samples at 100, 50, and 25 % of the total length of the outflow channel, tubing was inserted into the flow cell at position B10, B5, or B3 labeled in (a).
Figure 6
Figure 6
a) Energy transfer in Fmoc‐FF/porphyrin/QDs hydrogels. b) Absorbance spectra of Fmoc‐FF/TCPP hydrogel and emission spectra of quantum dots. c) Emission spectra of Fmoc‐FF/TCPP/QD‐570 hydrogel excited at 270 nm with a fixed concentration of Fmoc‐FF and QD‐570 while increasing the concentration of TCPP. d) Emission spectra of Fmoc‐FF/TCPP/QD‐570 hydrogel excited at 270 nm with a fixed concentration of Fmoc‐FF and TCPP while increasing the concentration of QD‐570. e) Fluorescence signal of QD‐520, QD‐570, QD‐610, and QD‐710 against concentrations of TCPP in hybrid hydrogels. f) CLSM images of the Fmoc‐FF/TCPP/QD‐570 hydrogel collected from the microfluidic device. Images were merged by the red signal of TCPP (acceptor) and the green signal of QD‐570 (donor). By bleaching the acceptor, an increase in the green signal is observed.

References

    1. None
    1. Yan X., Zhu P., Li J., Chem. Soc. Rev. 2010, 39, 1877–1890; - PubMed
    1. Hauser C. A., Zhang S., Chem. Soc. Rev. 2010, 39, 2780–2790; - PubMed
    1. Sun B., Tao K., Jia Y., Yan X., Zou Q., Gazit E., Li J., Chem. Soc. Rev. 2019, 48, 4387–4400. - PMC - PubMed
    1. Basavalingappa V., Guterman T., Tang Y., Nir S., Lei J., Chakraborty P., Schnaider L., Reches M., Wei G., Gazit E., Adv. Sci. 2019, 6, 1900218. - PMC - PubMed

Publication types

LinkOut - more resources