Meta-Analysis
. 2020 Dec;128(12):126001.
doi: 10.1289/EHP6181. Epub 2020 Dec 7.

Understanding the Impact of Rainfall on Diarrhea: Testing the Concentration-Dilution Hypothesis Using a Systematic Review and Meta-Analysis

Affiliations
Meta-Analysis

Understanding the Impact of Rainfall on Diarrhea: Testing the Concentration-Dilution Hypothesis Using a Systematic Review and Meta-Analysis

Alicia N M Kraay et al. Environ Health Perspect. 2020 Dec.

Abstract

Background: Projected increases in extreme weather may change relationships between rain-related climate exposures and diarrheal disease. Whether rainfall increases or decreases diarrhea rates is unclear based on prior literature. The concentration-dilution hypothesis suggests that these conflicting results are explained by the background level of rain: Rainfall following dry periods can flush pathogens into surface water, increasing diarrhea incidence, whereas rainfall following wet periods can dilute pathogen concentrations in surface water, thereby decreasing diarrhea incidence.

Objectives: In this analysis, we explored the extent to which the concentration-dilution hypothesis is supported by published literature.

Methods: To this end, we conducted a systematic search for articles assessing the relationship between rain, extreme rain, flood, drought, and season (rainy vs. dry) and diarrheal illness.

Results: A total of 111 articles met our inclusion criteria. Overall, the literature largely supports the concentration-dilution hypothesis. In particular, extreme rain was associated with increased diarrhea when it followed a dry period [incidence rate ratio (IRR)=1.26; 95% confidence interval (CI): 1.05, 1.51], with a tendency toward an inverse association for extreme rain following wet periods, albeit nonsignificant, with one of four relevant studies showing a significant inverse association (IRR=0.911; 95% CI: 0.771, 1.08). Incidences of bacterial and parasitic diarrhea were more common during rainy seasons, providing pathogen-specific support for a concentration mechanism, but rotavirus diarrhea showed the opposite association. Information on timing of cases within the rainy season (e.g., early vs. late) was lacking, limiting further analysis. We did not find a linear association between nonextreme rain exposures and diarrheal disease, but several studies found a nonlinear association with low and high rain both being associated with diarrhea.

Discussion: Our meta-analysis suggests that the effect of rainfall depends on the antecedent conditions. Future studies should use standard, clearly defined exposure variables to strengthen understanding of the relationship between rainfall and diarrheal illness. https://doi.org/10.1289/EHP6181.


Figures
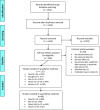
Figure 1 is a flow diagram depicting four elements, namely, Included, Eligibility, Screening, and Identification. The flow diagram has six steps. Step 1: Records identified through database searching (lowercase n equals 1521). Step 2: Records after duplicates removed (lowercase n equals 1234). Step 3: Records screened (lowercase n equals 1234) including excluded records (lowercase n equals 1074). Step 4: Full-text articles assessed for eligibility (lowercase n equals 166) in which full-text articles were excluded (lowercase n equals 55), including No outcome data are 12, No exposure data are 14, No main effect is 1, No primary data, insufficient data reported, or duplicate data source are 15, Selection bias is 1, and Publication type or date are 13. Step 5: Studies included in qualitative synthesis (lowercase n equals 111), including Flood (lowercase n equals 26, lowercase a equals 765), Drought (lowercase n equals 1, lowercase a equals 1), Rain (lowercase n equals 51, lowercase a equals 351), Heavy rain (lowercase n equals 19, lowercase a equals 744), and Season (lowercase n equals 37, lowercase a equals 103). Step 6: Studies included in quantitative synthesis (lowercase n equals 60), including Flood (lowercase n equals 14, lowercase a equals 699), Rain (lowercase n equals 15, lowercase a equals 84), Heavy Rain (lowercase n equals 13, lowercase a equals 364), and Season (lowercase n equals 24, lowercase a equals 62).
Figure 1.
PRISMA Diagram of study search and analysis. In the diagram, “n” is the number of studies and “a” is the number of associations. Some studies measured multiple climate variables such that the number of studies listed for each exposure category may not add up to the total number of studies included in the qualitative and quantitative synthesis. All eligible studies were included in the qualitative (descriptive) synthesis, but only associations deemed comparable for the meta-analysis (regression analysis) were included in the quantitative synthesis. Figure design based on Moher et al. 2009.
Figures 2A, 2B, 2C, and 2D are maps with latitude, ranging from negative 50 to 50 in increments of 50 and longitude, ranging from negative 100 to 200 in increments of 100 for number of associations, including 0, 100, 200, and 300.
Figure 2.
Map of associations and studies included in the qualitative synthesis for (A) extreme rain, (B) flood, (C) rain, and (D) season. Each point corresponds to a study. The one study and association with the climatic exposure of drought was located in Tuvalu and is excluded from the map.

References

    1. Abu M, Codjoe SNA. 2018. Experience and future perceived risk of floods and diarrheal disease in urban poor communities in Accra, Ghana. Int J Environ Res Public Health 15(12): 2830, PMID: 30545071, 10.3390/ijerph15122830. - DOI - PMC - PubMed
    1. Alexander KA, Heaney AK, Shaman J. 2018. Hydrometeorology and flood pulse dynamics drive diarrheal disease outbreaks and increase vulnerability to climate change in surface-water-dependent populations: a retrospective analysis. PLoS Med 15(11):e1002688, PMID: 30408029, 10.1371/journal.pmed.1002688. - DOI - PMC - PubMed
    1. Aminharati F, Dallal MMS, Ehrampoush MH, Dehghani-Tafti A, Yaseri M, Memariani M, et al. 2018. The effect of environmental parameters on the incidence of Shigella outbreaks in Yazd province, Iran. Water Supply 18(4):1388–1395, 10.2166/ws.2017.205. - DOI
    1. Anim-Baido I, Narh CA, Oddei D, Brown CA, Enweronu-Laryea C, Bandoh B, et al. 2016. Giardia lamblia infections in children in Ghana. Pan Afr Med J 24:217, PMID: 27800072, 10.11604/pamj.2016.24.217.8012. - DOI - PMC - PubMed
    1. Anthonj C, Diekkrüger B, Borgemeister C, Kistemann T. 2019. Health risk perceptions and local knowledge of water-related infectious disease exposure among Kenyan wetland communities. Int J Hyg Environ Health 222(1):34–48, PMID: 30262389, 10.1016/j.ijheh.2018.08.003. - DOI - PubMed

Publication types

MeSH terms