Review
. 2021 Feb 1;320(2):E191-E207.
doi: 10.1152/ajpendo.00405.2020. Epub 2020 Dec 7.

Bilirubin as a metabolic hormone: the physiological relevance of low levels

Affiliations
Review

Bilirubin as a metabolic hormone: the physiological relevance of low levels

Justin F Creeden et al. Am J Physiol Endocrinol Metab. .

Abstract

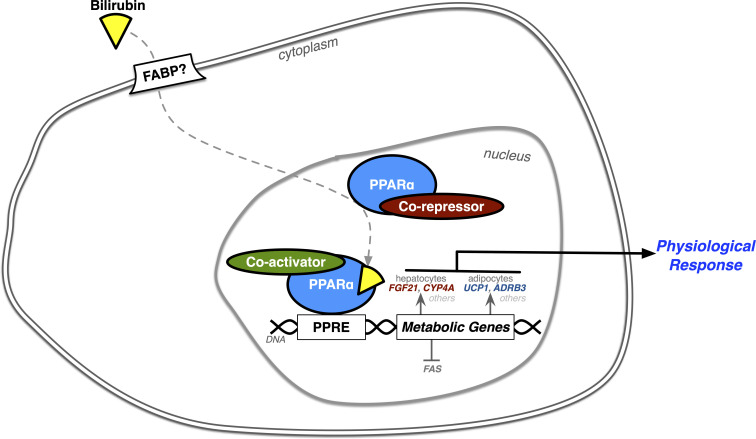
Recent research on bilirubin, a historically well-known waste product of heme catabolism, suggests an entirely new function as a metabolic hormone that drives gene transcription by nuclear receptors. Studies are now revealing that low plasma bilirubin levels, defined as "hypobilirubinemia," are a possible new pathology analogous to the other end of the spectrum of extreme hyperbilirubinemia seen in patients with jaundice and liver dysfunction. Hypobilirubinemia is most commonly seen in patients with metabolic dysfunction, which may lead to cardiovascular complications and possibly stroke. We address the clinical significance of low bilirubin levels. A better understanding of bilirubin's hormonal function may explain why hypobilirubinemia might be deleterious. We present mechanisms by which bilirubin may be protective at mildly elevated levels and research directions that could generate treatment possibilities for patients with hypobilirubinemia, such as targeting of pathways that regulate its production or turnover or the newly designed bilirubin nanoparticles. Our review here calls for a shift in the perspective of an old molecule that could benefit millions of patients with hypobilirubinemia.

Keywords: HO-1; PPARalpha; bilirubin nanoparticles; heme oxygenase; hypobilirubinemia.


Conflict of interest statement

T.D.H. and D.E.S. have submitted patents on bilirubin and obesity related disorders. The other authors have nothing to declare.

Figures

None
Graphical abstract
Figure 1.
Figure 1.
Bilirubin pathway and diseases associated with hypobilirubinemia. As red blood cells undergo hemolysis, intermediate heme molecules (red spheres) are released. Heme is catabolized in reticuloendothelial cells to produce biliverdin (green spheres), which is reduced to unconjugated bilirubin (yellow spheres). Unconjugated bilirubin may enter adipose tissue or the liver to control adiposity. Bilirubin is conjugated in the liver (brownish-yellow spheres) before being excreted to the intestine and further processed by the gut microbiome to urobilinoids and stercobilin. Some urobilinoids can be reabsorbed by the hepatic portal vein and then processed by the kidney to urobilinogen and excreted in the urine. Bilirubin nanoparticle therapies may be used to treat diseases associated with hypobilirubinemia such as cardiovascular disease (red outlined icon), fatty liver disease (yellow outlined icon), obesity (gray outlined icon), and insulin-resistant type 2 diabetes (purple outlined icon). The graphical illustration was developed by Matthew Hazzard at the University of Kentucky College of Medicine.
Figure 2.
Figure 2.
Bilirubin generation and metabolism. When red blood cells undergo hemolysis, they release heme (red oval), which is catabolized into biliverdin (green oval), iron (Fe), and carbon monoxide (CO) through an enzymatic reaction involving molecular oxygen (O2), NADPH, and heme oxygenase (HO). Biliverdin is then reduced to bilirubin by the biliverdin reductase (BVR) enzyme. This process may be reversed (dotted line) by reactive oxygen species (ROS) reconversion of bilirubin to biliverdin. Lastly, uridine diphosphate glucuronosyltransferase 1A1 (UGT1A1) conjugates bilirubin to its water-soluble form, allowing it to be excreted into the bile.
Figure 3.
Figure 3.
Bilirubin ranges and diseases. A: double-headed arrow approximates the range of patient serum bilirubin concentrations and provides indicators of levels at which the labeled disease or biological activity may be realized. Movement from left to right along the line corresponds with increased serum bilirubin concentrations. Serum bilirubin concentrations between 2 and 10 µM are considered to be “hypobilirubinemia.” Obesity, NAFLD, and stroke are associated with hypobilirubinemia with serum bilirubin concentrations <10 µM. Serum bilirubin concentrations >14–40 µM may be the result of exercise. This is also the concentration (EC50 = 9.0 µM) at which bilirubin acts as a hormone, directly binding to the transcription factor peroxisome proliferator-activated receptor alpha (PPARα) and increasing downstream fat-burning mechanisms (B). Gilbert’s syndrome is associated with serum bilirubin concentrations between 18 and 58 µM. As serum bilirubin concentrations approach 200 µM, patients begin to manifest visible jaundice with no pathology. This is also when bilirubin begins to act on the G-protein-coupled receptor (GPCR) MRGPRX4 (EC50 = 145.9 µM), increasing downstream itch-receptor mechanisms. As serum bilirubin concentrations approach 300 µM, pathological jaundice manifests. Higher bilirubin concentrations are caused by type 2 and type 1 Crigler–Najjar syndrome that can cause kernicterus.
Figure 4.
Figure 4.
Bilirubin’s hormonal signaling activates peroxisome proliferator-activated receptor alpha (PPARα) gene transcription. Bilirubin enters the cell via an uptake system, which might occur via a fatty acid-binding protein (FABP). Then, within the cell, bilirubin binds PPARα, causing a shift in corepressor proteins to coactivators to activate transcriptional control of genes. The bilirubin-bound PPARα increases occupancy at PPAR response elements (PPREs) in gene promoters to increase FGF21 and CYP4A or decrease FAS gene expression in hepatocytes, and, in adipocytes, to activate UCP1 and ADRB3 gene transcription. The bilirubin-PPARα control of gene responses leads to whole body physiological responses.
Figure 5.
Figure 5.
Bilirubin enhances metabolic function in adipocytes. Lean humans have higher bilirubin levels (yellow hexagons) compared with obese individuals. Biliverdin (BV) conversion by biliverdin reductase A (BVRA) to bilirubin or delivery of bilirubin nanoparticles (BRNP) activates peroxisome proliferator-activated receptor alpha (PPARα). The higher bilirubin levels lead to the activation of PPARα in white adipose tissue (WAT). Bilirubin binds directly to PPARα, increasing the transcription of fat-burning genes Cpt1, Ucp1, and Adrb3 and enhancing the number of mitochondria. Together, these lower the number of intracellular lipids by β-oxidation of fatty acids. As patients become obese, serum bilirubin concentrations are lower, leading to lipid accumulation and reduced PPARα activity and mitochondrial function. Yellow hexagons represent bilirubin. Green hexagons represent biliverdin. White circles represent lipids. Purple ovals represent the cell nucleus. Brown elongated ovals represent mitochondria, and those with a yellow haze indicating enhanced function. Silver spheres with a yellow haze in the nucleus represent bilirubin-bound PPARα in the lean, and black spheres with a blue haze are inactive PPARα in the obese. Double helices are DNA, and the arrow indicates PPARα target genes. The half-circle and the silhouette on the left represent healthy weighted WAT physiology. The half-circle on the right is for patients with obesity WAT physiology.
Figure 6.
Figure 6.
Hypothetical representation of bilirubin levels in civilization. The abscissa is a hypothetical representation of serum bilirubin concentrations in the general population. The ordinate represents the number of patients. Colored segments under the curve demonstrate serum bilirubin concentration ranges. The red area on the left side of the normal curve represents serum bilirubin concentrations between 1 and 5 µM. The orange area on the left side of the normal curve represents serum bilirubin concentrations that are between 5 and 10 µM. Together, these areas and their corresponding ranges represent hypobilirubinemic states and potential health concerns. The green space on the left side of the normal curve represents serum bilirubin concentrations that are between 10 and 25 µM. This area and its corresponding ranges also represent “normobilirubinemia.” The yellow area on the right side of the normal curve represents serum bilirubin concentrations that are between 25 and 50 µM. Although patients with serum bilirubin concentrations within this range may be metabolically healthy, it also represents mild hyperbilirubinemic states. The orange area on the right side of the yellow shaded area represents serum bilirubin concentrations that are between 50 and 100 µM. The red area on the far right side represents serum bilirubin concentrations that are “extreme hyperbilirubinemia” between 100 and 500 µM. Together, these two areas and their corresponding ranges represent severe hyperbilirubinemic states and potential health concerns. Note: this is a theoretical model that needs to be determined in the population.

References

    1. Hamoud AR, Weaver L, Stec DE, Hinds TD Jr.. Bilirubin in the Liver-Gut Signaling Axis. Trends Endocrinol Metab 29: 140–150, 2018. doi:10.1016/j.tem.2018.01.002. - DOI - PMC - PubMed
    1. Hinds TD Jr, Adeosun SO, Alamodi AA, Stec DE. Does bilirubin prevent hepatic steatosis through activation of the PPARalpha nuclear receptor? Medical Hypotheses 95: 54–57, 2016. doi:10.1016/j.mehy.2016.08.013. - DOI - PMC - PubMed
    1. Hinds TD Jr, Stec DE. Bilirubin safeguards cardiorenal and metabolic diseases: a protective role in health. Curr Hypertens Rep 21: 87, 2019. doi:10.1007/s11906-019-0994-z. - DOI - PMC - PubMed
    1. Hinds TD Jr, Stec DE. Bilirubin, a cardiometabolic signaling molecule. Hypertension 72: 788–795, 2018. [Erratum in Hypertension 72: e95, 2018]. doi:10.1161/HYPERTENSIONAHA.118.11130. - DOI - PMC - PubMed
    1. Vítek L. Bilirubin as a predictor of diseases of civilization. Is it time to establish decision limits for serum bilirubin concentrations? Arch Biochem Biophys 672: 108062, 2019. doi:10.1016/j.abb.2019.108062. - DOI - PubMed

Publication types