. 2020 Dec 7:9:e60047.
doi: 10.7554/eLife.60047.

Co-movement of astral microtubules, organelles and F-actin by dynein and actomyosin forces in frog egg cytoplasm

Affiliations

Co-movement of astral microtubules, organelles and F-actin by dynein and actomyosin forces in frog egg cytoplasm

James F Pelletier et al. Elife. .

Abstract

How bulk cytoplasm generates forces to separate post-anaphase microtubule (MT) asters in Xenopus laevis and other large eggs remains unclear. Previous models proposed that dynein-based, inward organelle transport generates length-dependent pulling forces that move centrosomes and MTs outwards, while other components of cytoplasm are static. We imaged aster movement by dynein and actomyosin forces in Xenopus egg extracts and observed outward co-movement of MTs, endoplasmic reticulum (ER), mitochondria, acidic organelles, F-actin, keratin, and soluble fluorescein. Organelles exhibited a burst of dynein-dependent inward movement at the growing aster periphery, then mostly halted inside the aster, while dynein-coated beads moved to the aster center at a constant rate, suggesting organelle movement is limited by brake proteins or other sources of drag. These observations call for new models in which all components of the cytoplasm comprise a mechanically integrated aster gel that moves collectively in response to dynein and actomyosin forces.

Keywords: ER; actin; cell biology; cytoplasm; dynein; mechanics; microtubule; physics of living systems; xenopus.


Conflict of interest statement

JP, CF, SF, MS, TM No competing interests declared

Figures

Figure 1.
Figure 1.. MTOC separation movement in Xenopus eggs and egg extract.
Panels A-C are fixed embryos, and panels D-F are in Xenopus egg extract. (A) Cartoon illustrating MTOC movement away from the CPC-positive midplane before astral microtubules (MTs) reach the cortex in Xenopus laevis eggs. MTs shown in cyan and CPC-positive interaction zone in magenta. Note the CPC is shown in the cartoon panels A and D, but not in the rest of the figure. (B,C) Anti-tubulin immunofluorescence of eggs fixed ~70 and ~85 min post-fertilization (pf). Diagonal lines connecting different eggs in panels B and C emphasize centrosome separation movement and the growing aster periphery. (B’,C’) Anti-LNPK (ER) immunofluorescence of the same eggs. (D) Cartoon illustrating aster separation movement in an extract system. MTs and CPC as in panel A. Asters were reconstituted from artificial microtubule organizing centers (MTOCs) in interphase Xenopus egg extracts. (E,F) MTOCs moved apart as asters grew and interacted with one another over time. Time is defined with respect to perfusing the sample and warming to 20°C, so the start of aster growth occurred soon after 0 min. (F’) A fraction of the ER became enriched around MTOCs, and (F’’) F-actin was disassembled locally along interaction zones.
Figure 1—figure supplement 1.
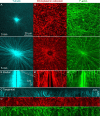
Figure 1—figure supplement 1.. Higher magnification imaging around MTOCs included signatures of both co-movement and relative movement of astral MTs, ER, and F-actin.
(Related to Figure 1, Video 1) (A) MTs imaged at near-speckle concentrations with tubulin-Alexa Fluor 647, ER labeled with DiI, and F-actin labeled with Lifeact-GFP. Images taken on a spinning disk confocal microscope with 60x objective. (B) Radial kymographs generated by averaging the intensity over 10° sectors originating at the MTOC. One end remained pinned at the MTOC, and the other end rotated with the average flow of ER, so features would remain in the sector, and the kymograph would highlight their radial movement. To guide the eye, the solid lines indicate the growing aster periphery (slope corresponds to 30 µm/min), and the dotted lines track with outward sliding of tubulin speckles away from the MTOC (slope corresponds to 3 µm/min). (C) Tangential kymographs generated along a circle centered on the MTOC, so moving features represent tangential displacement with respect to the MTOC.
Figure 2.
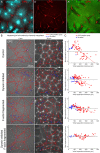
Figure 2.. MTOC separation movement in egg extract by dynein and actomyosin.
(A) The CPC localized to interaction zones between neighboring asters, blocking mutual interpenetration of MTs and disassembling F-actin locally. Time is defined with respect to perfusing the sample and warming to 20°C, so the start of aster growth occurred soon after 0 min. (B) Four aster growth reactions were followed in parallel under control vs inhibitor conditions. The first column in each condition shows an early time point, and the second column shows a time point 30 min later. MT growth was similar and CPC-positive interaction zones formed under all conditions (see Video 3). (C) Maximum speed of separation with respect to initial distance between the MTOCs. Red lines indicate linear fits to red points.
Figure 3.
Figure 3.. ER and F-actin move with MTs in separating asters.
(A,B) Asters grew until they reached their neighbors, formed interaction zones approximately equidistant between the MTOCs, then moved away from the interaction zones (see Video 2). MTOC trajectories are represented by contours colored from blue to yellow. Time is defined with respect to perfusing the sample and warming to 20°C, so the start of aster growth occurred soon after 0 min. (C) Intensity kymographs along the gray line shown in panels A and B, passing through the MTOCs marked with a white star. To show relative movement of the MTOCs, each row of the kymograph was computationally translated to keep stationary the midpoint between the MTOCs, where the interaction zone formed. Solid curves indicate the MTOCs, the dashed curve indicates the growing aster periphery, and the dash-dotted line indicates the interaction zone. (D) Velocity maps in the same frame of reference as in panel C. 2D flow fields were measured by particle image velocimetry (PIV), projected onto the line passing through the MTOCs, then the projected velocity of the midpoint between the MTOCs was subtracted, again to show movement relative to the interaction zone. A white color indicates stationary with respect to the midpoint, blue indicates moving to the left, and red to the right. PIV outliers were filtered and shown in beige. (E) Velocity of the MTOCs based on particle tracking, as well as the velocity of ER and F-actin in the neighborhood of the MTOCs based on PIV. (F) Velocity of ER with respect to the moving MTOCs, not with respect to the interaction zone as in panel D.
Figure 3—figure supplement 1.
Figure 3—figure supplement 1.. Higher magnification imaging around zones included signatures of both co-movement and relative movement of astral MTs, ER, and F-actin.
(Related to Figure 3, Video 4) (A) MTs labeled with tubulin-Alexa Fluor 647, ER labeled with DiI, and F-actin labeled with Lifeact-GFP. Images taken on a spinning disk confocal microscope with 60x objective. (B) Kymographs along the line indicated in panel A. (C) Velocity maps in the same frame of reference as panel B. Velocity maps represent the horizontal component of the velocity estimated by PIV. (D) Temporal montage of the box indicated in panel A’ showing an example of deformation of the ER. Time with respect to the start of the montage.
Figure 4.
Figure 4.. ER and F-actin move with MTs on coverslips functionalized with dynein.
(A) Coverslips were functionalized with an antibody against HOOK2, so the rigid coverslip substrate generated pulling forces on the astral MTs. (B) Circular oscillatory trajectory of the MTOC (see Video 5). (C) X coordinate of the MTOC. (D) Speed of the MTOC relative to the coverslip, including both X and Y components of motion. (E) Intensity kymographs along the horizontal line passing through the MTOC, indicated in panel B. (F) Velocity maps in the same frame of reference as in panel E. 2D velocity fields were measured by particle image velocimetry (PIV) then projected onto the horizontal line as in panel E. The MTOC position is shown as a black curve.
Figure 4—figure supplement 1.
Figure 4—figure supplement 1.. Characterization of the HOOK2 C-terminal peptide antibody.
(Related to Figures 4, 5 and 8) We performed immunoprecipitation-mass spectrometry (IP-MS) on Protein G Dynabeads functionalized with anti-HOOK2. In three repeat extracts, we measured three conditions: anti-HOOK2 in interphase extracts (columns 1 to 3), anti-HOOK2 in mitotic extracts (columns 4 and 5), and as negative control, random IgG in interphase (columns 6 through 8). HOOK2 conditions were normalized so the amount of HOOK2 was constant. Random IgG conditions were normalized to have the same IgG count as the average IgG count of the HOOK2 columns. Then for each protein, the sum across channels was normalized, so the abundance values represent relative enrichment across the eight channels. Abundances are shown on a log scale with base 2. We here show dynein subunits (blue), dynactin subunits (red), and other proteins known to interact with dynein-dynactin (yellow, green) that came down in the immunoprecipitations. The interaction between HOOK2 and the dynein-dynactin complex was stronger in interphase (left columns) than in mitosis (middle columns).
Figure 5.
Figure 5.. A small molecule is advected with moving asters.
(A) To track the flow of a small molecule within moving asters, MTOCs were functionalized with caged fluorescein. (B) Caged fluorescein, before uncaging. (B’) Astral MTs radiating from the MTOC filled the region. The aster was oscillating on a coverslip functionalized with anti-HOOK2 as in Figure 4. (C) Fluorescein, after uncaging. (D) Within tens of seconds, the fluorescein diffused away from the MTOC and approached the background intensity (see Video 7). 2D Gaussian fits to estimate the width and center of the fluorescein cloud. The bright MTOC was excluded from the Gaussian fit, so uncaged fluorescein that remained bound to the MTOC did not bias the fitted position. (E) Expansion of the fluorescein cloud width fit to a model of diffusion. (F) Several replicate trajectories of the MTOC (circle) and the center of the fluorescein cloud (plus).
Figure 5—figure supplement 1.
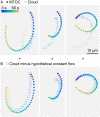
Figure 5—figure supplement 1.. Hypothetical constant flow permeating asters can improve registration between MTOC and center of fluorescein cloud.
(Related to Figure 5) (A) Trajectory of MTOC (circle) and center of the fluorescein cloud, within aster oscillating on HOOK2-functionalized coverslip, same as Figure 5F. (B) Trajectory of MTOC (circle) and center of the fluorescein cloud after computationally subtracting a constant flow (square). Flow direction and magnitude shown as a black arrow above each panel. The hypothetical constant flow was optimized to minimize the difference between the MTOC and cloud trajectories.
Figure 5—figure supplement 2.
Figure 5—figure supplement 2.. Separating asters exhibited saddle-shaped flow fields, consistent with advection of cytosol by moving asters.
(Related to Figure 5) (A,B) F-actin labeled with Lifeact-GFP, CPC labeled with anti-INCENP-Alexa Fluor 647, and MTs labeled with Tau-mCherry. (C) Differential interference contrast to visualize mitochondria and other small vesicles. (D) Flow fields of the DIC channel estimated by PIV exhibited a saddle shape, with flow along the interaction zone toward the midpoint between the asters. F-actin and MTs exhibited similar flow fields. Color represents direction (legend in upper right of first panel), and brightness represents velocity. Note that arrows are downsampled from full flow fields. Time with respect to warming the sample and the onset of aster polymerization.
Figure 6.
Figure 6.. Dynein-mediated organelle movement is restricted by F-actin.
(A) In control with intact F-actin, a small amount of ER became concentrated around the MTOC, but the majority of the ER and mitochondria remained distributed over the aster (see Video 8). The white arc indicates the growing aster periphery, and the box indicates the zoomed region in the lower panels. (A’) Average intensity with respect to distance from the MTOC over time, from black to gray. (B) When F-actin was fragmented with Cytochalasin D, a greater fraction of the ER was transported toward the MTOC, and a fraction of mitochondria was transported as well. Higher magnification: ER started to move when MTs indicated by growing +TIPs first grew into the cytoplasm, and ER and mitochondria co-localized with one another. (C) When dynein was inhibited with p150-CC1, the ER was not transported, neither toward nor away from the MTOC.
Figure 7.
Figure 7.. Dynein-mediated organelle movement is maximal on the aster periphery.
(A) Stationary asters were grown from isolated MTOCs. The growing aster periphery is indicated by a white arc, and the ER was largely distributed but slightly depleted just inside the growing aster periphery. The ER exhibited a change in texture from slightly coarser outside the aster to finer inside the aster (see Video 9). (B) Kymographs along a line extending away from the MTOC. The MTOC corresponds to the left column, and the growing aster periphery corresponds to the diagonal line where soluble tubulin is depleted upon incorporation into the growing aster. (C) Mass transport map for ER averaged over a quadrant, in the same frame of reference as the kymographs in panel B. Mass transport analysis is described in Figure 7—figure supplement 2. (D–F) Similar experiment with F-actin intact, in a different batch of extract that exhibited less organelle movement. (G–J) Similar experiment with F-actin fragmented by Cytochalasin D (see Video 10). (J) Average speed based on PIV, in the same frame of reference as panels H,I and averaged over a quadrant. PIV is not shown for control because movement was too slow to be reliably quantified.
Figure 7—figure supplement 1.
Figure 7—figure supplement 1.. Like other organelles, mitochondria exhibited a burst of organelle movement near the growing aster periphery.
(Related to Figures 6 and 7, Video 11) (A) F-actin was fragmented by Cytochalasin D. Microtubules were labeled with tubulin-Alexa Fluor 647, ER with DiD, and mitochondria with TMRE. (B) Kymographs along a line from the MTOC. (C) Mass transport map for ER and mitochondria averaged over a quadrant, in the same frame of reference as the kymographs in panel B. Mass transport analysis is described in Figure 7—figure supplement 2. (D) Average speed based on PIV, in the same frame of reference as panels B and C, and averaged over a quadrant. In all analysis methods, mitochondria behaved similar to acidic organelles and likewise exhibited a burst of movement at the growing aster periphery.
Figure 7—figure supplement 2.
Figure 7—figure supplement 2.. Explanation of flux analysis of organelle transport.
(Related to Figure 7) (A,B) Subsequent frames in a video to measure dynein-based flux of organelles along astral MTs. The flux analysis requires that the region of interest (ROI) contains the entire aster at all times, so there is no transport of organelles into or out of the ROI, just radial redistribution of organelles along astral MTs within the ROI. Images were flat field corrected, then normalized to constant total intensity to correct for photobleaching. (C) Kymograph of average organelle intensity in concentric rings away from the MTOC. Frames 31 (green, panel A) and 32 (purple, panel B) correspond to the rows of the kymograph indicated by horizontal dotted lines. The distance to the aster periphery at this time, indicated by the white dotted arc in panels A and B, is indicated by the vertical white dotted line. (D) Average organelle intensity in concentric rings away from the MTOC. (E) Total intensity in concentric rings away from the MTOC. The total intensity increases roughly linearly with the circumference. (F) Cumulative total intensity away from the MTOC. Zoomed inset shows where the cumulative total intensity at frame 32 most exceeds that at frame 31. (G) Flux of fluorescence intensity toward the MTOC, calculated as the cumulative total intensity at frame 32 minus that at frame 31. Flux was normalized to the percentage of the total fluorescence intensity moving across each bin edge (10 µm) per min. (H) Flux map in the same frame of reference as the kymograph in panel C. Panel G corresponds to the row indicated by the horizontal black dotted line.
Figure 7—figure supplement 3.
Figure 7—figure supplement 3.. Dextran was excluded in organelle-rich region within ~50 µm of MTOCs.
(Related to Figures 7 and 8, Video 13) (A) The growing +TIPs of MTs were labeled with EB1-GFP, the relative concentration of cytosol was inferred from 10 kDa dextran labeled with Alexa-Fluor 568, and organelles were visualized with differential interference contrast (DIC). Images taken 18.3 min after warming to 20°C and the onset of aster growth. (B,C) Intensity profiles away from the MTOC colored by time point. In the EB1 graph, the wavefront corresponds to the growing aster periphery. To correct for photobleaching, dextran profiles were normalized to the intensity at the point farthest from the MTOC.
Figure 8.
Figure 8.. Unlike organelles, artificial cargoes functionalized with dynein move at constant speed throughout asters.
(A) Artificial cargoes were functionalized with an antibody against the dynein adapter HOOK2, and negative control beads were functionalized with random antibody (see Video 12). (B) Max intensity projections of beads functionalized with anti-HOOK2 (red) or random antibody (green). (C) Trajectories of anti-HOOK2 and negative control beads relative to the MTOC. The growing aster is indicated by the blue region. Anti-HOOK2 beads started to be transported when they were engulfed by the growing aster. (D) Velocity distribution of anti-HOOK2 beads inside the aster. (E–H) Similar experiment with F-actin fragmented by Cytochalasin D.
Figure 9.
Figure 9.. Model for component flows during aster separation movement in frog eggs.
Within moving asters, all cytoplasmic networks move together, advecting cytosol. Near the aster periphery, organelles flow rapidly inwards while MTs flow outwards. Outside the aster, cytosol is displaced around asters and into the midplane by hydrodynamic forces.

Similar articles

Cited by

References

    1. Basant A, Glotzer M. Spatiotemporal regulation of RhoA during cytokinesis. Current Biology. 2018;28:R570–R580. doi: 10.1016/j.cub.2018.03.045. - DOI - PMC - PubMed
    1. Behrndt M, Salbreux G, Campinho P, Hauschild R, Oswald F, Roensch J, Grill SW, Heisenberg CP. Forces driving epithelial spreading in zebrafish gastrulation. Science. 2012;338:257–260. doi: 10.1126/science.1224143. - DOI - PubMed
    1. Carmena M, Wheelock M, Funabiki H, Earnshaw WC. The chromosomal passenger complex (CPC): from easy rider to the godfather of mitosis. Nature Reviews Molecular Cell Biology. 2012;13:789–803. doi: 10.1038/nrm3474. - DOI - PMC - PubMed
    1. Chambers R. Microdissection studies. II. The cell aster: a reversible gelation phenomenon. Journal of Experimental Zoology. 1917;23:483–505. doi: 10.1002/jez.1400230302. - DOI
    1. Cheng X, Ferrell JE. Spontaneous emergence of cell-like organization in Xenopus egg extracts. Science. 2019;366:631–637. doi: 10.1126/science.aav7793. - DOI - PMC - PubMed

Publication types