. 2021 Jul;74(1):148-163.
doi: 10.1002/hep.31676. Epub 2021 Jun 15.

Metabolic Landscape of the Mouse Liver by Quantitative 31 P Nuclear Magnetic Resonance Analysis of the Phosphorome

Affiliations

Metabolic Landscape of the Mouse Liver by Quantitative 31 P Nuclear Magnetic Resonance Analysis of the Phosphorome

Ganeko Bernardo-Seisdedos et al. Hepatology. 2021 Jul.

Abstract

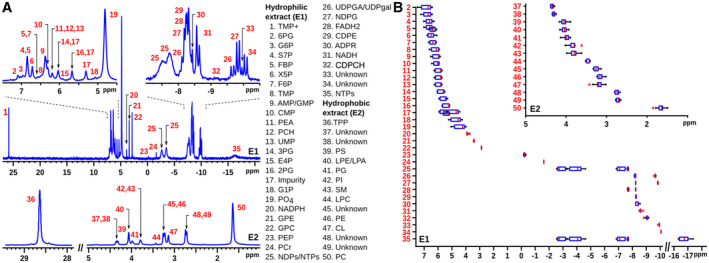
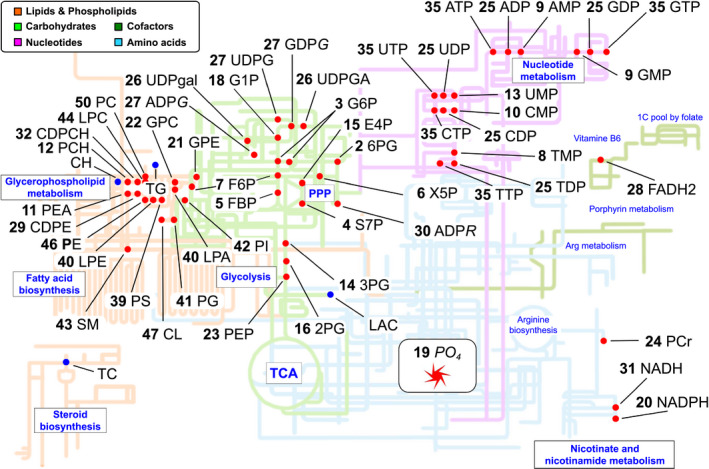
Background and aims: The liver plays a central role in all metabolic processes in the body. However, precise characterization of liver metabolism is often obscured by its inherent complexity. Phosphorylated metabolites occupy a prominent position in all anabolic and catabolic pathways. Here, we develop a 31 P nuclear magnetic resonance (NMR)-based method to study the liver "phosphorome" through the simultaneous identification and quantification of multiple hydrophilic and hydrophobic phosphorylated metabolites.

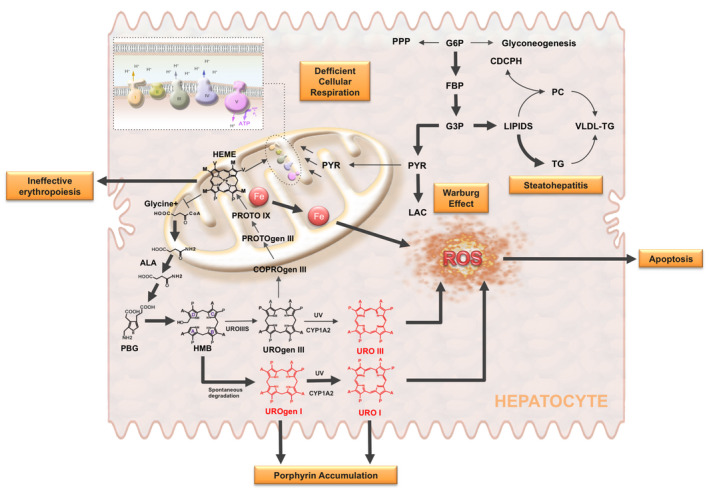
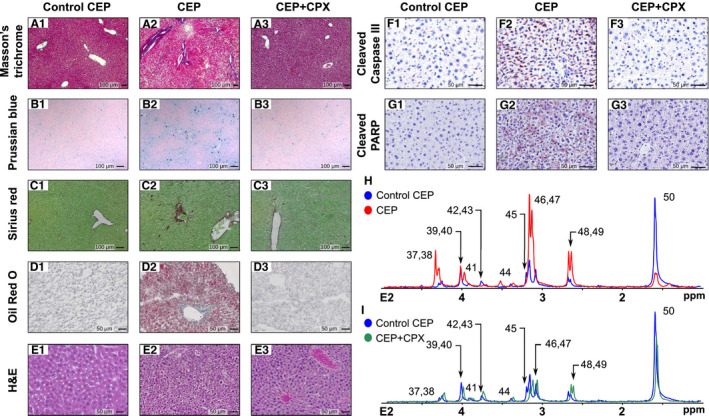
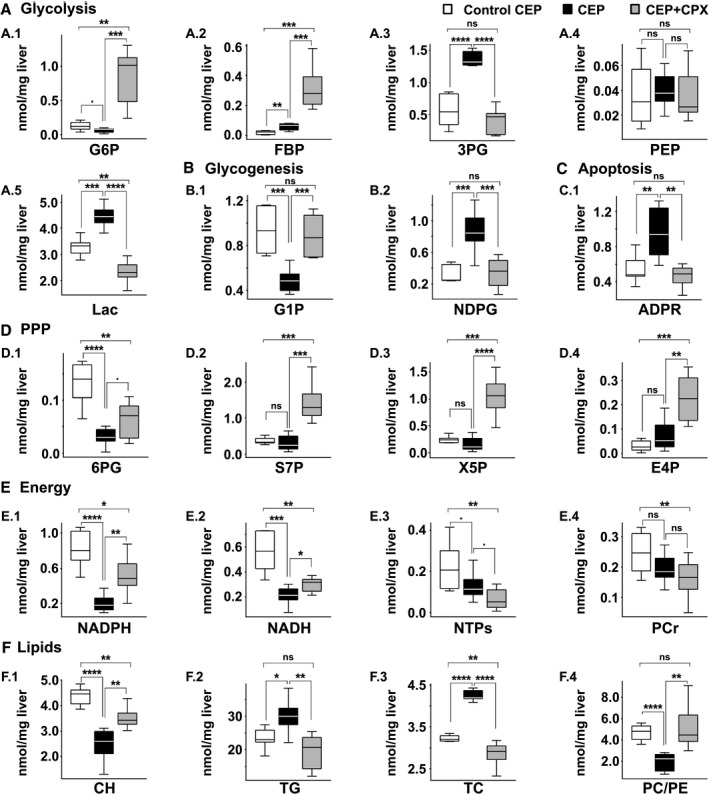
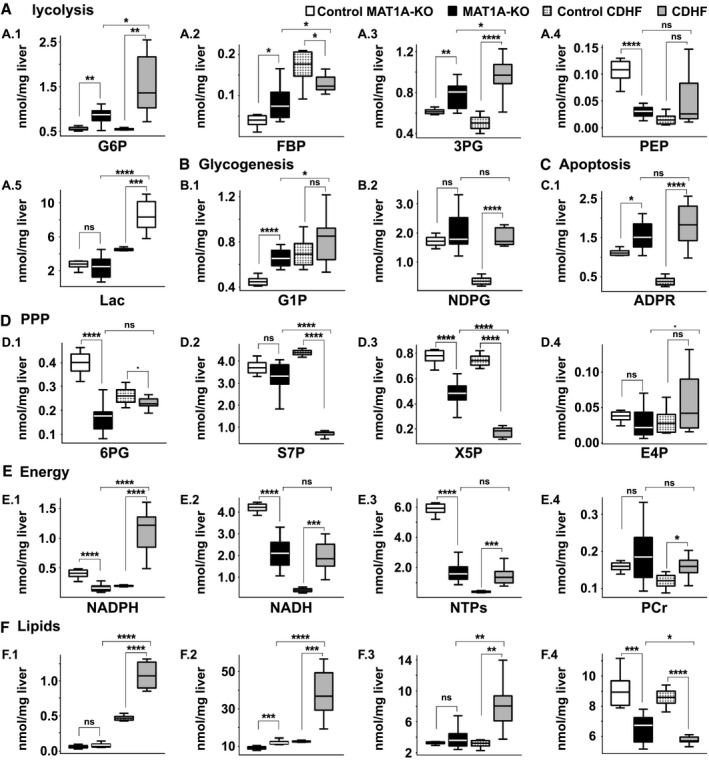
Approach and results: We applied this technique to define the metabolic landscape in livers from a mouse model of the rare disease disorder congenital erythropoietic porphyria (CEP) as well as two well-known murine models of nonalcoholic steatohepatitis: one genetic, methionine adenosyltransferase 1A knockout mice, and the other dietary, mice fed a high-fat choline-deficient diet. We report alterations in the concentrations of phosphorylated metabolites that are readouts of the balance between glycolysis, gluconeogenesis, the pentose phosphate pathway, the tricarboxylic acid cycle, and oxidative phosphorylation and of phospholipid metabolism and apoptosis. Moreover, these changes correlate with the main histological features: steatosis, apoptosis, iron deposits, and fibrosis. Strikingly, treatment with the repurposed drug ciclopirox improves the phosphoromic profile of CEP mice, an effect that was mirrored by the normalization of liver histology.

Conclusions: In conclusion, these findings indicate that NMR-based phosphoromics may be used to unravel metabolic phenotypes of liver injury and to identify the mechanism of drug action.


Figures

FIG. 1
FIG. 1
31P‐NMR spectroscopy of mouse liver extracts. E1 (E2) stands for the hydrophilic (lipophilic) extract. (A) A total of 50 different peaks are identified within the two extracts. For the abbreviation meanings, see Table 1. (B) Chemical shift variability of the different peaks was determined from a cohort of more than 50 spectra from liver samples. Abbreviation: NDPG, nucleoside diphosphate glucose.
FIG. 2
FIG. 2
Map of the phosphorylated metabolism. Metabolites measured in liver extracts are represented as red circles when measured. Phosphorome gives information on central metabolism (glycolysis, PPP, and the TCA cycle), glycogenesis, phospholipid, nucleotide, nicotinamide, and energy metabolism. Arg, arginine.
FIG. 3
FIG. 3
Porphyrin accumulation and oxidative stress in CEP. CEP is an autosomal recessive disorder of heme synthesis characterized by reduced activity of UROIIIS and the accumulation of nonphysiologic porphyrin metabolites (UROgen I and URO I). This results in ineffective erythropoiesis, iron deposition, mitochondrial dysfunction, and enhanced generation of reactive oxygen species (ROS), leading to the release of molecular danger signals triggering apoptosis in neighbor cells, probably erythroid cells. The diagram also shows the activation of glycolysis caused by mitochondrial dysfunction (Warburg effect) and how the excess of carbon units may be used for the various branching pathways that originate from glycolysis, like the de novo lipogenesis. This, together with the decrease of phosphatidylcholine (PC), which is required for VLDL synthesis and export, and the increased generation of ROS can explain the development of steatohepatitis in CEP mice. Abbreviations: ALA, aminolevulinate; COPROgen, coproporphyrinogen; CYP1A2, cytochrome P450 1A2; G3P, glyceraldehyde 3‐phosphate; HEME, heme group; HMB, hydroxymethylbilane; PGB, porphobilinogen; PROTO, protoporphyrin; PROTOgen, protoporphyrinogen; PYR, pyruvate; URO, uroporphyrin; UROgen, uroporphyrinogen; UV, ultraviolet radiation.
FIG. 4
FIG. 4
Impact of CEP condition in the phosphorome of mice liver and the recovery effect by CPX. (A‐G) Histology performed by (A) hematoxylin/eosin, (B) Prussian blue, (C) sirius red, (D) Oil Red O, (E) Masson's trichrome, (F) caspase‐3, or (G) PARP staining of control CEP (#.1) and CEP mice (#.2), with the latter also treated with CPX (#.3). CEP murine model (n = 7) shows steatosis with fibrosis, porphyrin deposits, and accumulation of erythroid cells clustering around sinusoids as well as apoptosis as compared with WT mice (n = 6). All these pathogenic features largely decrease after the administration of CPX (n = 7). (H,I) 31P spectra of lipophilic phase comparing WT (blue) peaks versuss CEP liver (red) and CEP liver treated with CPX (green). H&E, hematoxylin and eosin.
FIG. 5
FIG. 5
Metabolite quantification for the CEP model. Comparison of quantified metabolites (nmol/mg liver) between control CEP (white bars; n = 6), CEP (black bars; n = 7) and CEP treated with CPX (gray bars, n = 7). (A) Glycolysis, (B) Glycogenesis, (C) Apoptosis, (D) Pentose phosphate pathway, (E) Energy, (F) Lipids. P values of < 0.1, 0.05, 0.01, 0.001 and 0.0001 are represented by ·, *, **, *** and ****, respectively.
FIG. 6
FIG. 6
Metabolite quantification for validated NASH models. Comparison of quantified metabolites (nmol/mg liver) between control MAT1A‐KO (white bars; n = 6), MAT1A‐KO (black bars; n = 9), control CDHF (dotted gray bars; n = 6), and CDHF (gray bars; n = 9). (A) Glycolysis, (B) Glycogenesis, (C) Apoptosis, (D) Pentose phosphate pathway, (E) Energy, (F) Lipids. P values of < 0.1, 0.05, 0.01, 0.001 and 0.0001 are represented by ·, *, **, *** and ****, respectively.

References

    1. Wishart DS, Feunang YD, Marcu A, Guo AC, Liang K, Vázquez‐Fresno R, et al. HMDB 4.0: The human metabolome database for 2018. Nucleic Acids Res 2018;46:D608‐D617. 10.1093/nar/gkx1089. - DOI - PMC - PubMed
    1. Kanehisa M, Goto S. KEGG: Kyoto encyclopedia of genes and genomes. Nucleic Acids Res 2000;28:27‐30. 10.1093/nar/28.1.27. - DOI - PMC - PubMed
    1. Walsh CT, Tu BP, Tang Y. Eight kinetically stable but thermodynamically activated molecules that power cell metabolism. Chem Rev 2018;118:1460‐1494. 10.1021/acs.chemrev.7b00510. - DOI - PMC - PubMed
    1. Chang ML, Yang SS. Metabolic signature of hepatic fibrosis: From individual pathways to systems biology. Cells 2019;8:1423. 10.3390/cells8111423. - DOI - PMC - PubMed
    1. Anstee QM, Goldin RD. Mouse models in non‐alcoholic fatty liver disease and steatohepatitis research. Int J Exp Pathol 2006;87:1‐16. 10.1111/j.0959-9673.2006.00465.x. - DOI - PMC - PubMed

Publication types

MeSH terms