. 2020 Dec 7;65(22):225004.
doi: 10.1088/1361-6560/abb571.

Clinical translation of a new flat-panel detector for beam's-eye-view imaging

Affiliations

Clinical translation of a new flat-panel detector for beam's-eye-view imaging

T C Harris et al. Phys Med Biol. .

Abstract

Electronic portal imaging devices (EPIDs) lend themselves to beams-eye view clinical applications, such as tumor tracking, but are limited by low contrast and detective quantum efficiency (DQE). We characterize a novel EPID prototype consisting of multiple layers and investigate its suitability for use under clinical conditions. A prototype multi-layer imager (MLI) was constructed utilizing four conventional EPID layers, each consisting of a copper plate, a Gd2O2S:Tb phosphor scintillator, and an amorphous silicon flat panel array detector. We measured the detector's response to a 6 MV photon beam with regards to modulation transfer function, noise power spectrum, DQE, contrast-to-noise ratio (CNR), signal-to-noise ratio (SNR), and the linearity of the detector's response to dose. Additionally, we compared MLI performance to the single top layer of the MLI and the standard Varian AS-1200 detector. Pre-clinical imaging was done on an anthropomorphic phantom, and the detector's CNR, SNR and spatial resolution were assessed in a clinical environment. Images obtained from spine and liver patient treatment deliveries were analyzed to verify CNR and SNR improvements. The MLI has a DQE(0) of 9.7%, about 5.7 times the reference AS-1200 detector. Improved noise performance largely drives the increase. CNR and SNR of clinical images improved three-fold compared to reference. A novel MLI was characterized and prepared for clinical translation. The MLI substantially improved DQE and CNR performance while maintaining the same resolution. Pre-clinical tests on an anthropomorphic phantom demonstrated improved performance as predicted theoretically. Preliminary patient data were analyzed, confirming improved CNR and SNR. Clinical applications are anticipated to include more accurate soft tissue tracking.


Figures
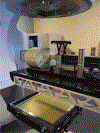
Figure 1
Figure 1
Multi-layer imager without its cover mounted on a TrueBeam. All measurements were taken with the imager in the same mount and housing as the standard EPID, as well as utilizing the same data chains.
Figure 2
Figure 2
Linear response of the detector and reference. Linear fit equations and their R2 shown for each plot, confirming the linear response of the multi-layer imager to dose.
Figure 3
Figure 3
a. 4 layer Las Vegas image with signal marked in red. Background is annulus around contrast circle. b. 1 layer image. c. Reference image. d. Contrast-to-noise ratio of the multi-layer imager in 4 and 1 layer configurations. There is a 1.8x increase in CNR between 1 and 4 layer modes. e The signal-to-noise ratio measurements. There is a doubling in SNR between 1 and 4 layer modes.
Figure 4
Figure 4
Modulation transfer function as a function of spatial frequency of the multi-layer imager in its two configurations and reference detector. There is a small loss of MTF relative to reference.
Figure 5
Figure 5
Normalized noise power spectrum as a function of spatial frequency of the multi-layer imager in its two configurations and reference detector. Noise performance is superior with the 4 layer MLI.
Figure 6
Figure 6
Detective quantum efficiency as a function of spatial frequency of the multi-layer imager in its two configuration and the reference detector. There is a 5.7x increase in DQE(0) of the 4 layer MLI over reference.
Figure 7
Figure 7
a. AP image of embedded tumor in thorax phantom on the 4 layer MLI, signal in tumor and background ROIs circled. Red lines mark where the radial profiles were taken. b. Right lateral image of the thorax phantom on the 4 layer MLI. Red lines mark where the profiles were taken. c. Measured contrast-to-noise ratio of the multi-layer imager in its two configurations and the reference detector. There is a 1.8x increase of CNR between the 1 layer and 4 layer MLI. d. Signal-to-noise ratio of the same group of detectors. There is a 1.9x increase of SNR between 1 layer and 4 layer MLI. e. Example of a sigmoidal fit for a profile across the bone/lung interface in figure 7b. The X position is given in pixel units with each pixel being 0.336 mm across.
Figure 8
Figure 8
a. Captured frame from a spine treatment in 4 layer mode. Areas used for signal and background marked. b. Matching frame from 1 layer mode, with signal and background areas marked. c. Measured contrast-to-noise ratio for the multi-layer imager in its two configurations. There is a 1.5x increase in CNR from 1 layer to 4 layer MLI. d. Measured signal-to-noise ratio for the MLI in its two configurations. There is a 2.0x increase in SNR from 1 layer to 4 layer MLI.
Figure 9
Figure 9
a. Example captured frame from a liver SBRT treatment in the multi-layer imager’s 4 layer mode. Fiducial is circled. Areas used for analysis are marked in red except for the fiducial itself, to aid the reader’s visibility. b. Matching frame from the MLI’s 1 layer mode. c. Measured contrast-to-noise ratio for the MLI’s 4 layer and 1 layer mode for the liver dome and the fiducial. There is ~1.9x increase in CNR for the 4 layer mode. d. Measured signal-to-noise ratio for the same regions of interest. There is a similar ~1.9 increase in the 4 layer mode’s SNR.
Figure 10
Figure 10
Average liver data from 40 sets of paired frames. Ratios of 4 layer to 1 layer contrast-to-noise ratio and signal-to-noise ratio for the liver dome to lung and for implanted fiducials to surrounding liver are shown, with the error bars representing one standard deviation. All ratio show ~1.9x increase in CNR and SNR for the 4 layer mode MLI over the 1 layer configuration.

References

    1. Antonuk LE. Electronic portal imaging devices: a review and historical perspective of contemporary technologies and research. Phys Med Biol. 2002; 47(6):R31–R65. - PubMed
    1. Antonuk L, Yorkston J, Boudry J, Longo M, Jimenez J, Street R. Development of hydrogenated amorphous silicon sensors for high energy photon radiotherapy imaging, IEEE Transactions on Nuclear Science. 1990; 37(2):165–170.
    1. Bakhtiari M, Kumaraswamy L, Bailey DW, de Boer S, Malhotra HK, Podgorsak MB. Using an EPID for patient-specific VMAT quality assurance. Med Phys. 2011; 38: 1366–1373. - PubMed
    1. Celi S, Costa E, Wessels C, Mazal A, Fourquet A and Francois P EPID based in vivo dosimetry system: clinical experience and results. Journal of Applied Clinical Medical Physics, 2016; 17: 262–276. - PMC - PubMed
    1. El-Mohri Y, Jee KW, Antonuk LE, Maolinbay M, Zhao Q. Determination of the detective quantum efficiency of a prototype, megavoltage indirect detection, active matrix flat-panel imager. Med Phys. 2001; 28(12):2538–2550. - PubMed

Publication types

MeSH terms