. 2020 Dec 7;16(12):e1009229.
doi: 10.1371/journal.pgen.1009229. eCollection 2020 Dec.

3D genome evolution and reorganization in the Drosophila melanogaster species group

Affiliations

3D genome evolution and reorganization in the Drosophila melanogaster species group

Nicole S Torosin et al. PLoS Genet. .

Abstract

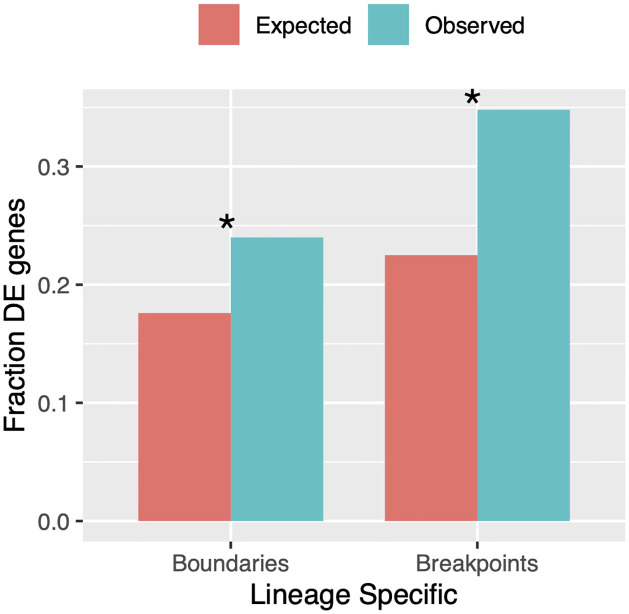
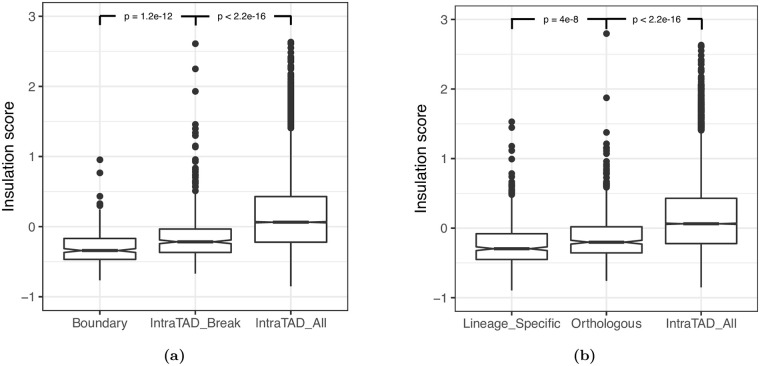
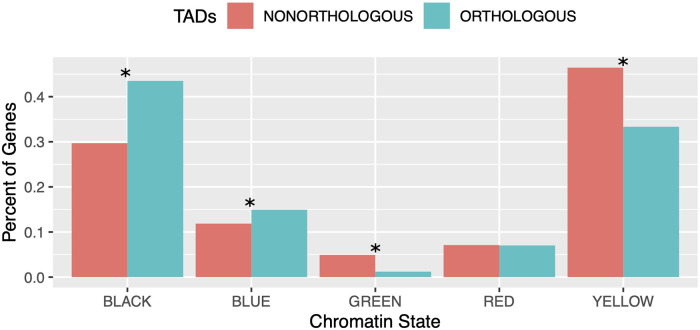
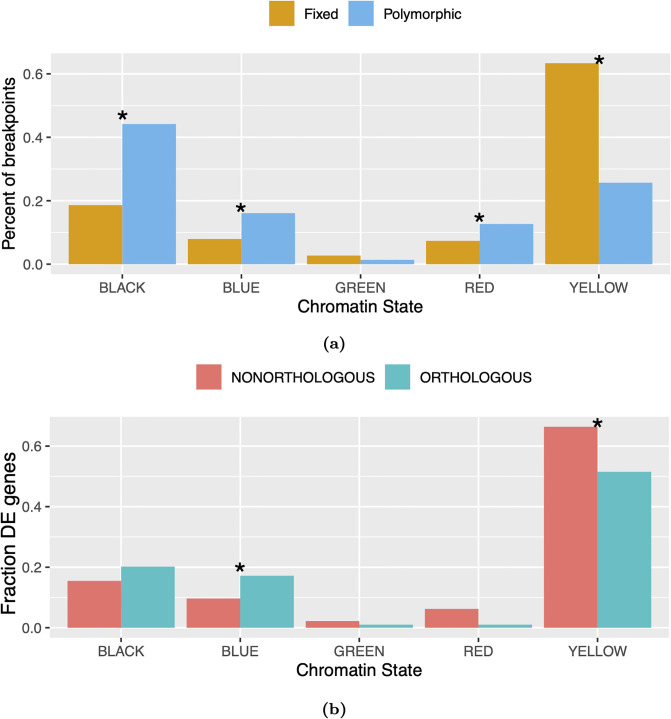
Topologically associating domains, or TADs, are functional units that organize chromosomes into 3D structures of interacting chromatin. TADs play an important role in regulating gene expression by constraining enhancer-promoter contacts and there is evidence that deletion of TAD boundaries leads to aberrant expression of neighboring genes. While the mechanisms of TAD formation have been well-studied, current knowledge on the patterns of TAD evolution across species is limited. Due to the integral role TADs play in gene regulation, their structure and organization is expected to be conserved during evolution. However, more recent research suggests that TAD structures diverge relatively rapidly. We use Hi-C chromosome conformation capture to measure evolutionary conservation of whole TADs and TAD boundary elements between D. melanogaster and D. triauraria, two early-branching species from the melanogaster species group which diverged ∼15 million years ago. We find that the majority of TADs have been reorganized since the common ancestor of D. melanogaster and D. triauraria, via a combination of chromosomal rearrangements and gain/loss of TAD boundaries. TAD reorganization between these two species is associated with a localized effect on gene expression, near the site of disruption. By separating TADs into subtypes based on their chromatin state, we find that different subtypes are evolving under different evolutionary forces. TADs enriched for broadly expressed, transcriptionally active genes are evolving rapidly, potentially due to positive selection, whereas TADs enriched for developmentally-regulated genes remain conserved, presumably due to their importance in restricting gene-regulatory element interactions. These results provide novel insight into the evolutionary dynamics of TADs and help to reconcile contradictory reports related to the evolutionary conservation of TADs and whether changes in TAD structure affect gene expression.


Conflict of interest statement

The authors have declared that no competing interests exist.

Figures

Fig 1
Fig 1. Models depicting possible TAD and boundary rearrangement scenarios.
Each model shows TAD contact domains (triangles) and boundaries (circles) in two hypothetical species. Model 1: chromosomal rearrangements occur at TAD boundaries, resulting in domains shuffling as intact units, represented by the purple and lilac TADs. Model 2: TAD boundaries remain conserved but TADs themselves are disrupted. In this example, an inversion whose breakpoints (jagged lines) occur within two separate TADs results in TAD reorganization, seen here as the two chimeric purple/lilac TADs. Model 3: both TADs and their boundaries evolve rapidly. The gain and loss of boundary elements (black star and ‘X’, respectively), leads to further TAD reorganization, beyond that observed in Model 2.
Fig 2
Fig 2. Hi-C contact maps and genome comparison.
A) D. melanogaster contact map; B) D. triauraria contact map. Contact maps show frequencies of pairwise 3D contacts, inferred from Hi-C data. Darker colors represent higher contact frequencies. Contact frequencies were visualized using Juicebox [39]. C) MUMmer dotplot depicting chromosomal rearrangements between D. melanogaster and D. triauraria. The promer utility from MUMmer [47] was used to visualize synteny between D. melanogaster and D. triauraria. Each dot corresponds to a one-to-one alignment between the two genomes. Red dots represent + /+ strand alignments and blue dots represent +/− strand alignments.
Fig 3
Fig 3. Visualization of orthologous and non-orthologous TADs.
A) Three orthologous, conserved TADs on Muller D between D. melanogaster (upper heatmap) and D. triauraria (lower heatmap). B) Non-orthologous, split TAD on Muller E between D. melanogaster (upper heatmap) and D. triauraria (lower heatmap). The black triangles on the contact matrices show the locations of TADs. The chromatin state annotations are based on Filion et. al. [53]. The chromatin classifications are as follows: BLACK: inactive, BLUE: Polycomb-repressed heterochromatin, GREEN: constitutive heterochromatin, RED: dynamic active, YELLOW: constitutive active. Orthologous genes are labeled by their FlyBase IDs and Hi-C matrices were generated by HiCExplorer. The grey blocks connecting matrices indicate syntenic regions. In B) gene tracks show that genes such as FBgb0038805, FBgn0038806, and FBgn0038814 are split between different TADs in D. triauraria and are in the reverse orientation compared to D. melanogaster.
Fig 4
Fig 4. Gene expression in orthologous versus non-orthologous TADs.
A) Genes within orthologous TADs are expressed at significantly reduced levels compared to non-orthologous TADs, consistent with Polycomb-repression (Wilcoxon test p = 6.7e–05) B) Orthologous TADs contain slightly fewer differentially-expressed (DE) genes compared to non-orthologous TADs (9.1% versus 10.5%), however this difference is not statistically significant (Fisher’s Exact Test p = 0.151). Differentially-expressed genes were identified using the DESeq2 R software package [52].
Fig 5
Fig 5. Differentially-expressed genes are enriched near locations where TADs are disrupted.
We calculated the fraction of differentially-expressed genes (DE) that lie within 10 kb of locations where TADs have been disrupted via chromosomal rearrangements or lineage-specific TAD boundaries. In both cases, we found significantly more differentially-expressed genes than expected by chance: Lineage-specific boundaries: observed: 24.0% [231], expected: 17.6% [170], hypergeometric p = 7.9e–8. Rearrangement breakpoints: observed: 34.8% [335], expected 22.5% [217], hypergeometric p = 2.6e–23.
Fig 6
Fig 6. TAD disruptions tend to occur at insulator-like regions.
We analyzed HiCExplorer insulation scores calculated for 5 kb bins across the D. melanogaster and D. triauraria genomes. A) We found that intra-TAD breakpoints tend to occur at genomic regions that have increased insulation relative to other intra-TAD bins: Wilcoxon test p < 2.2e–16, but significantly less insulation compared to TAD boundaries: Wilcoxon test p = 1.2e–12. B) We also examined lineage-specific boundaries and found that the genomic regions orthologous to lineage-specific boundaries show increased insulation relative to all intra-TAD 5 kb bins: Wilcoxon test p < 2.2e–16. However, lineage-specific boundaries have significantly increased insulation compared to the orthologous region in the other species, supporting their classification as lineage-specific: Wilcoxon test p = 4e–8. Note that more negative scores indicate more insulation. Full plot for B in S9 Fig.
Fig 7
Fig 7. Orthologous TADs are enriched for transcriptionally silent and Polycomb-repressed genes.
The bar plot shows the percent of genes in each chromatin state (defined by [53]) in orthologous versus non-orthologous TADs. Orthologous TADs are significantly enriched for the BLACK (inactive) and BLUE (Polycomb-repressed) chromatin states and significantly depleted of the GREEN and YELLOW chromatin states. Asterices * indicate significant differences as calculated by Fisher’s Exact Test (p-values: BLACK = 1.225e–25; BLUE = 4.322e–4; GREEN = 1.552e–15; YELLOW = 8.375e–23; RED = 0.398).
Fig 8
Fig 8. Evolutionary constraint of TADs by chromatin state.
A) To assess whether TAD subtypes are under different levels of evolutionary constraint, we compared the frequency of polymorphic versus fixed intra-TAD rearrangement breakpoints across chromatin states. We found that interspecies rearrangement breakpoints that disrupt TADs are significantly depleted from the BLACK, BLUE, and RED chromatin states, and significantly enriched in the YELLOW chromatin state. These results suggest that rearrangement breakpoints from BLACK, BLUE, and RED states are under purifying selection, while some of the rearrangements in YELLOW states may have been fixed due to positive selection. Asterices * indicate significant differences as calculated by Fisher’s Exact Test (p-values: BLACK = 5.118e–17; BLUE = 9.714e–5; GREEN = 0.136; YELLOW = 2.352e–29; RED = 0.005). B) Y-axis represents fraction of differentially-expressed (DE) genes assigned to each chromatin state. DE genes from the YELLOW chromatin state are more likely to be located in disrupted (i.e. nonorthologous) TADs compared to conserved (i.e. orthologous) TADs, whereas the opposite is true for genes from the BLUE chromatin state. Asterices * indicate significant differences as calculated by Fisher’s Exact Test (p-values: BLACK = 0.156; BLUE = 0.026; GREEN = 0.381; YELLOW = 0.004; RED = 0.123).

Similar articles

Cited by

References

    1. Lieberman-Aiden Erez, van Berkum Nynke L, Williams Louise, Imakaev Maxim, Ragoczy Tobias, Telling Agnes, Amit Ido, Lajoie Bryan R, Sabo Peter J, Dorschner Michael O, Sandstrom Richard, Bernstein Bradley, Bender M A, Groudine Mark, Gnirke Andreas, Stamatoyannopoulos John, Mirny Leonid A, Lander Eric S, and Dekker Job. Comprehensive mapping of long-range interactions reveals folding principles of the human genome. Science, 326(5950):289–293, October 2009. 10.1126/science.1181369 - DOI - PMC - PubMed
    1. Dixon Jesse R, Selvaraj Siddarth, Yue Feng, Kim Audrey, Li Yan, Shen Yin, Hu Ming, Liu Jun S, and Ren Bing. Topological domains in mammalian genomes identified by analysis of chromatin interactions. Nature, 485(7398):376–380, April 2012. 10.1038/nature11082 - DOI - PMC - PubMed
    1. Sexton Tom, Yaffe Eitan, Kenigsberg Ephraim, Bantignies Frédéric, Leblanc Benjamin, Hoichman Michael, Parrinello Hugues, Tanay Amos, and Cavalli Giacomo. Three-dimensional folding and functional organization principles of the Drosophila genome. Cell, 148(3):458–472, February 2012. 10.1016/j.cell.2012.01.010 - DOI - PubMed
    1. Schauer Tamás, Ghavi-Helm Yad, Sexton Tom, Albig Christian, Regnard Catherine, Cavalli Giacomo, Furlong Eileen Em, and Becker Peter B. Chromosome topology guides the drosophila dosage compensation complex for target gene activation. EMBO Rep., August 2017. 10.15252/embr.201744292 - DOI - PMC - PubMed
    1. Stadler Michael R, Haines Jenna E, and Eisen Michael B. Convergence of topological domain boundaries, insulators, and polytene interbands revealed by high-resolution mapping of chromatin contacts in the early Drosophila melanogaster embryo. Elife, 6, November 2017. 10.7554/eLife.29550 - DOI - PMC - PubMed

Publication types

LinkOut - more resources