. 2020 Dec 7;16(12):e1009130.
doi: 10.1371/journal.ppat.1009130. eCollection 2020 Dec.

Infection of human Nasal Epithelial Cells with SARS-CoV-2 and a 382-nt deletion isolate lacking ORF8 reveals similar viral kinetics and host transcriptional profiles

Affiliations

Infection of human Nasal Epithelial Cells with SARS-CoV-2 and a 382-nt deletion isolate lacking ORF8 reveals similar viral kinetics and host transcriptional profiles

Akshamal M Gamage et al. PLoS Pathog. .

Abstract

The novel coronavirus SARS-CoV-2 is the causative agent of Coronavirus Disease 2019 (COVID-19), a global healthcare and economic catastrophe. Understanding of the host immune response to SARS-CoV-2 is still in its infancy. A 382-nt deletion strain lacking ORF8 (Δ382 herein) was isolated in Singapore in March 2020. Infection with Δ382 was associated with less severe disease in patients, compared to infection with wild-type SARS-CoV-2. Here, we established Nasal Epithelial cells (NECs) differentiated from healthy nasal-tissue derived stem cells as a suitable model for the ex-vivo study of SARS-CoV-2 mediated pathogenesis. Infection of NECs with either SARS-CoV-2 or Δ382 resulted in virus particles released exclusively from the apical side, with similar replication kinetics. Screening of a panel of 49 cytokines for basolateral secretion from infected NECs identified CXCL10 as the only cytokine significantly induced upon infection, at comparable levels in both wild-type and Δ382 infected cells. Transcriptome analysis revealed the temporal up-regulation of distinct gene subsets during infection, with anti-viral signaling pathways only detected at late time-points (72 hours post-infection, hpi). This immune response to SARS-CoV-2 was significantly attenuated when compared to infection with an influenza strain, H3N2, which elicited an inflammatory response within 8 hpi, and a greater magnitude of anti-viral gene up-regulation at late time-points. Remarkably, Δ382 induced a host transcriptional response nearly identical to that of wild-type SARS-CoV-2 at every post-infection time-point examined. In accordance with previous results, Δ382 infected cells showed an absence of transcripts mapping to ORF8, and conserved expression of other SARS-CoV-2 genes. Our findings shed light on the airway epithelial response to SARS-CoV-2 infection, and demonstrate a non-essential role for ORF8 in modulating host gene expression and cytokine production from infected cells.


Conflict of interest statement

The authors declare no conflict of interest.

Figures

Fig 1
Fig 1. Expression of SARS-CoV-2 entry factors on primary nasal tissue and differentiated NECs.
Immunofluorescence staining for expression of ACE2 and TMPRSS2 on (A) primary nasal tissue, and (B) cross-section of NECs. ACE2 or TMPRSS2 staining in the relevant panels are represented in red, βIV-tubulin in green, and nuclear staining with DAPI in blue. Representative images from at least two independent stains are shown, at a magnification of 400x.
Fig 2
Fig 2. SARS-CoV-2 and Δ382 replication kinetics in NECs.
Virus particles released from the (A) apical and (B) basolateral surface of infected NECs, and (C) virus copy numbers detected in cell lysates, of infected NECs at each of the indicated time-points (n = 3–6). Each dot represents a different human-donor derived NEC. Data represented as mean ± SEM. Adjusted p-values derived from two-way ANOVA test with Sidak correction are indicated above each comparison.
Fig 3
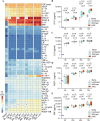
Fig 3. Cytokine secretion from NECs upon SARS-CoV-2 and Δ382 infection.
(A) Heat-map of average cytokine concentrations (pg/ml, log) detected at the indicated time-points and infection conditions. All cytokine values are averages of 6 independent donor-derived NECs, except for GRO-α and IL-11, which represent average values from 3 independent donor-derived NECs. # indicates cytokine(s) significantly secreted by NECs in the uninfected state (adjusted p-value < 0.01, two-way ANOVA test with Tukey correction and > 10 fold increase in cytokine signal compared to media only control). ** indicates cytokine(s) concentration significantly increased upon infection, compared to uninfected samples (adjusted p-value < 0.01, two-way ANOVA test with Tukey correction), nd: not done. Box and whiskers plot of cytokine concentrations (pg/ml, log) for (B) IP-10 (CXCL10), (C) IL-8, (D) MCP-1 and (E) MIF, at each of the indicated time-points and infection conditions (n = 6). Each dot represents a different human-donor derived NEC. Adjusted p-values derived from two-way ANOVA test with Tukey correction are indicated above each comparison.
Fig 4
Fig 4. Transcriptional response to SARS-CoV-2 infection from NECs.
(A) Venn diagram of shared or unique DEGs upon infection of NECs with wild-type SARS-CoV-2 at each of the indicated time-points. (B) Bubble-plot of top enriched Hallmark gene-sets upon infection of NECs with wild-type SARS-CoV-2. The color and size of each bubble is proportional to the adjusted p-value and the percentage of enriched genes from each gene-set, respectively. Only gene-sets with an adjusted p-value < 0.05 are shown (C) Heat-map of top 50 up-regulated DEGs observed at 8 h, 24h and 72 h after infection of NECs with wild-type SARS-CoV-2. Genes which correspond to Hallmark Interferon Alpha response, or Gene Ontology term Response to Type I Interferon are colored in red. (D) Volcano plot of genes at 72 h after infection of NECs with wild-type SARS-CoV-2. Significant DEGs with an adjusted p-value < 0.05 and log FC of at least 1.5 are indicated as maroon dots; all other DEGs are indicated as grey dots. The top 15 up-regulated genes by log FC are annotated, with interferon-stimulated genes annotated in red.
Fig 5
Fig 5. Comparison of transcriptional response to SARS-CoV-2 vs H3N2.
(A) H3N2 virus particles released from apical surface of infected NECs, at each of the indicated time-points (n = 3). Each dot represents a different human-donor derived NEC. Data represented as mean ± SEM. Dots in blue indicate data-points which were previously published by Tan KS et al [20]. (B) Bubble-plot of top enriched Hallmark gene-sets upon infection of NECs with H3N2. The corresponding bubble-plots for these same gene-sets upon SARS-CoV-2 infection are included for comparison. The color and size of each bubble is proportional to the adjusted p-value and the percentage of enriched genes from each gene-set, respectively. Only gene-sets with an adjusted p-value <0.05 are shown. (C) Heat-map of key up-regulated DEGs at 72 h after infection of NECs with H3N2, which are specific to Hallmark Inflammatory Response and Interferon Alpha response pathways. The corresponding heat maps for these same genes upon SARS-CoV-2 infection are included for comparison. (D) Percentage of LDH released from apical surface of NECs infected with SARS-CoV-2 wild-type, Δ382 or H3N2 at the indicated time-points. Each dot represents a different human-donor derived NEC. Data represented as mean ± SEM.
Fig 6
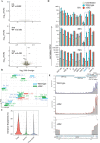
Fig 6
Similar gene expression profile upon NEC infection with SARS-CoV-2 and Δ382 (A) Volcano plot of DEGs at 8 h, 24 h and 72 h after infection of NECs with wild-type SARS-CoV-2 vs Δ382. Statistically significant DEGs (adjusted p-value < 0.05) are annotated. None of the DEGs have an adjusted p-value < 0.05 and log FC of at least 1.5. (B) PCA plot of transcriptomes from uninfected (ui), wild-type or Δ382 infected donor (dn)-derived NECs, according to gene-expression profiles (C) Percentage of variance explained by post-infection time-point, donor and virus strain for each expressed gene within the transcriptome dataset. (D) Normalized CPM values for SARS-CoV-2 genes detected at each of the indicated time-points from wild-type and Δ382 infected NECs (E) Coverage plot of viral transcripts from wild-type and Δ382 infected NECs at 72 hpi overlaid with the SARS-CoV-2 genome (top inset). Lower panel displays genomic region deleted in Δ382 for which transcript mapping is absent. Each tick represents 10bp on the SARS-CoV-2 genome. All coverage plots are representative images of merged coverage of all three biological replicates, sampled at 1% depth each.

References

    1. Li Q, Guan X, Wu P, Wang X, Zhou L, Tong Y, et al. Early transmission dynamics in Wuhan, China, of novel coronavirus–infected pneumonia. N Engl J Med. 2020. 10.1056/NEJMoa2001316 - DOI - PMC - PubMed
    1. Guan WJ, Ni ZY, Hu Y, Liang WH, Ou CQ, He JX, et al. Clinical Characteristics of Coronavirus Disease 2019 in China. N Engl J Med. 2020;382(18):1708–20. 10.1056/NEJMoa2002032 - DOI - PMC - PubMed
    1. Hu Y, Sun J, Dai Z, Deng H, Li X, Huang Q, et al. Prevalence and severity of corona virus disease 2019 (COVID-19): A systematic review and meta-analysis. J Clin Virol. 2020:104371 10.1016/j.jcv.2020.104371 - DOI - PMC - PubMed
    1. Fu L, Wang B, Yuan T, Chen X, Ao Y, Fitzpatrick T, et al. Clinical characteristics of coronavirus disease 2019 (COVID-19) in China: a systematic review and meta-analysis. J Infect. 2020. 10.1016/j.jinf.2020.03.041 - DOI - PMC - PubMed
    1. Sungnak W, Huang N, Bécavin C, Berg M, Queen R, Litvinukova M, et al. SARS-CoV-2 entry factors are highly expressed in nasal epithelial cells together with innate immune genes. Nat Med. 2020;26(5):681–7. 10.1038/s41591-020-0868-6 - DOI - PMC - PubMed

Publication types