

Novel computer-based assessments of everyday visual function in people with age-related macular degeneration
- PMID: 33284855
- PMCID: PMC7721163
- DOI: 10.1371/journal.pone.0243578
Novel computer-based assessments of everyday visual function in people with age-related macular degeneration
Abstract
Purpose: To test the hypothesis that the performance in novel computer-based tasks of everyday visual function worsens with disease severity in people with non-neovascular age-related macular degeneration.
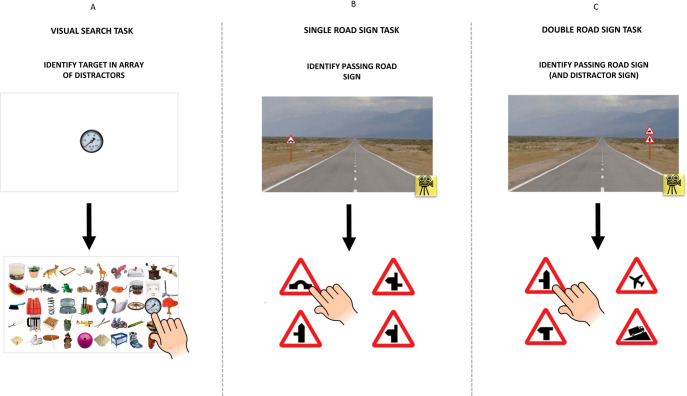
Methods: Participants with and without non-neovascular age-related macular degeneration (≥60 years, minimum logMAR binocular visual acuity 0.7) performed a series of standard visual function tests and two novel computer-based tasks. In a visual search task, participants had to locate an image of a single real-world object within an array of 49 distractor images. Next, in a series of simulated dynamic driving scenes, participants were asked to identify one or two approaching real-world road signs and then select these road signs from four options. Outcome measures were median response times and total correct responses.
Results: Forty-nine participants had no macular disease (n = 11), early/intermediate age-related macular degeneration (n = 16) or geographic atrophy (n = 22). Groups were age-similar with median (interquartile range) logMAR visual acuity of 0.00 (-0.08,0.12), 0.13 (-0.08,0.70) and 0.32 (0.12,0.70) respectively. Median (interquartile range) visual search response times were 1.9 (1.0,2.4), 1.8 (1.1,3.7) and 2.4 (1.2,6.0) seconds respectively. Median (interquartile range) road sign response times (single road signs) were 1.2 (0.4,1.7), 1.5 (0.9,2.8) and 1.8 (1.0,5.5) seconds respectively. Median (interquartile range) road sign response times (double road signs) were 1.7 (0.7,2.4), 2.3 (1.2,3.1) and 2.5 (1.7,6) seconds respectively. Participants with geographic atrophy recorded slower response times in all tasks and over 50% performed outside the normative limit for task performance. There were no significant differences between groups in total correct responses across all tasks.
Conclusions: In a novel computer-based assessment, people with increasing severity of age-related macular degeneration take longer to perform visual search of everyday objects and take longer to identify road signs than those with no age-related macular degeneration. These novel assessments could be useful as patient-relevant, secondary outcomes for clinical trials.
Conflict of interest statement
DPC is a consultant for Centervue and reports unrestricted grants from Roche UK, Santen UK, and Allergan UK and speaker fees from THEA, Bayer, Santen, and Allergan which are outside the submitted work. This study was funded as part of an unrestricted investigator-initiated research grant from Roche Products Ltd, UK, (https://www.roche.co.uk/) awarded to DPC. The funders had no role in study design, data collection and analysis, decision to publish, or preparation of the manuscript. This does not alter our adherence to PLOS ONE policies on sharing data and materials. The remaining authors report no competing interests.
Figures


References
-
- Minassian DC, Reidy A, Lightstone A, Desai P. The vast majority of people diagnosed with AMD have the ‘“dry”‘ form of the disease (early and intermediate AMD, and late AMD [geographic atrophy, GA]), for which there is no available treatment to arrest progressive loss of vision. British Journal of Ophthalmology. 2011. 10.1136/bjo.2010.195370 - DOI - PubMed
Publication types
MeSH terms
LinkOut - more resources
Full Text Sources
Medical
