

Performance Characteristics of Severe Acute Respiratory Syndrome Coronavirus 2 RT-PCR Tests in a Single Health System: Analysis of >10,000 Results from Three Different Assays
- PMID: 33285286
- PMCID: PMC7718779
- DOI: 10.1016/j.jmoldx.2020.11.008
Performance Characteristics of Severe Acute Respiratory Syndrome Coronavirus 2 RT-PCR Tests in a Single Health System: Analysis of >10,000 Results from Three Different Assays
Abstract
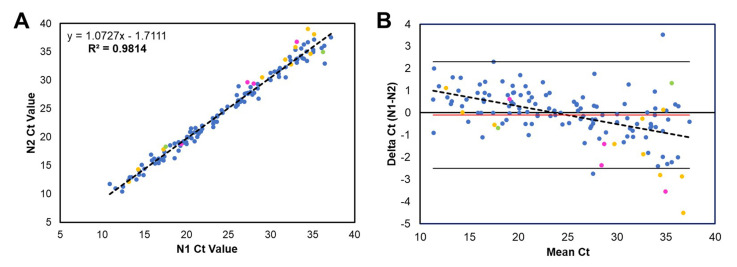
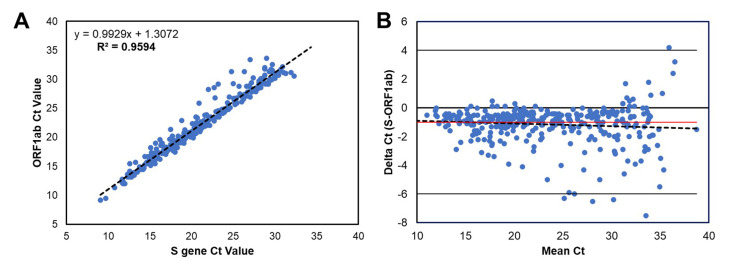
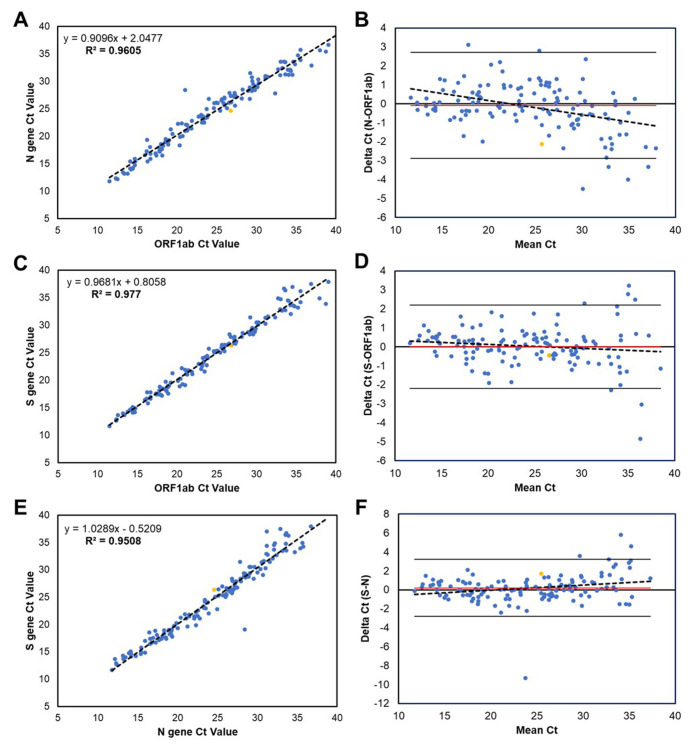
The current pandemic of severe acute respiratory syndrome coronavirus 2 (SARS-CoV-2) has resulted in the approval of numerous molecular diagnostic assays with various performance and technical capacities. There are limited data comparing performance among assays. We conducted a retrospective analysis of >10,000 test results among three widely used RT-PCR assays for coronavirus disease 2019 (CDC, Simplexa Direct, and TaqPath) to assess performance characteristics. We also retested remnant weakly positive specimens to assess analytical sensitivity. All assays had strong linear correlation and little bias among CT values for PCR targets. In patients with first-test negative results (n = 811), most (795, 98.0%) remained negative for all subsequent testing. Retesting of weakly positive specimens (CT > 30) showed sensitivities as follows: TaqPath (97.8%), CDC (91%), Simplexa (75.3%). Our analysis showed no performance difference among PCR targets within the same assay, suggesting a single target is sufficient for SARS-CoV-2 detection. Lower respiratory tract specimens had a higher negative predictive value (100%) than upper respiratory tract specimens (98%), highlighting the utility of testing lower respiratory tract specimens when clinically indicated. Negative predictive value did not increase on further repeated testing, providing strong evidence for discouraging unnecessary repeated testing for SARS-CoV-2.
Copyright © 2021 Association for Molecular Pathology and American Society for Investigative Pathology. Published by Elsevier Inc. All rights reserved.
Figures
References
-
- Chan J.F., Yuan S., Kok K.H., To K.K., Chu H., Yang J., Xing F., Liu J., Yip C.C., Poon R.W., Tsoi H.W., Lo S.K., Chan K.H., Poon V.K., Chan W.M., Ip J.D., Cai J.P., Cheng V.C., Chen H., Hui C.K., Yuen K.Y. A familial cluster of pneumonia associated with the 2019 novel coronavirus indicating person-to-person transmission: a study of a family cluster. Lancet. 2020;395:514–523. - PMC - PubMed
-
- Holshue M.L., DeBolt C., Lindquist S., Lofy K.H., Wiesman J., Bruce H., Spitters C., Ericson K., Wilkerson S., Tural A., Diaz G., Cohn A., Fox L., Patel A., Gerber S.I., Kim L., Tong S., Lu X., Lindstrom S., Pallansch M.A., Weldon W.C., Biggs H.M., Uyeki T.M., Pillai S.K. First case of 2019 novel coronavirus in the United States. N Engl J Med. 2020;382:929–936. - PMC - PubMed
-
- Corman V.M., Landt O., Kaiser M., Molenkamp R., Meijer A., Chu D.K., Bleicker T., Brünink S., Schneider J., Schmidt M.L., Mulders D.G., Haagmans B.L., van der Veer B., van den Brink S., Wijsman L., Goderski G., Romette J.L., Joanna Ellis J., Zambon M., Peiris M., Goossens H., Reusken C., Koopmans M.P. Drosten CDetection of 2019 novel coronavirus (2019-nCoV) by real-time RT-PCR. Euro Surveill. 2020;25:2000045. - PMC - PubMed
MeSH terms
LinkOut - more resources
Full Text Sources
Other Literature Sources
Medical
Miscellaneous
