. 2020 Apr 26;22(5):499.
doi: 10.3390/e22050499.

How Complexity and Uncertainty Grew with Algorithmic Trading

Affiliations

How Complexity and Uncertainty Grew with Algorithmic Trading

Martin Hilbert et al. Entropy (Basel). .

Abstract

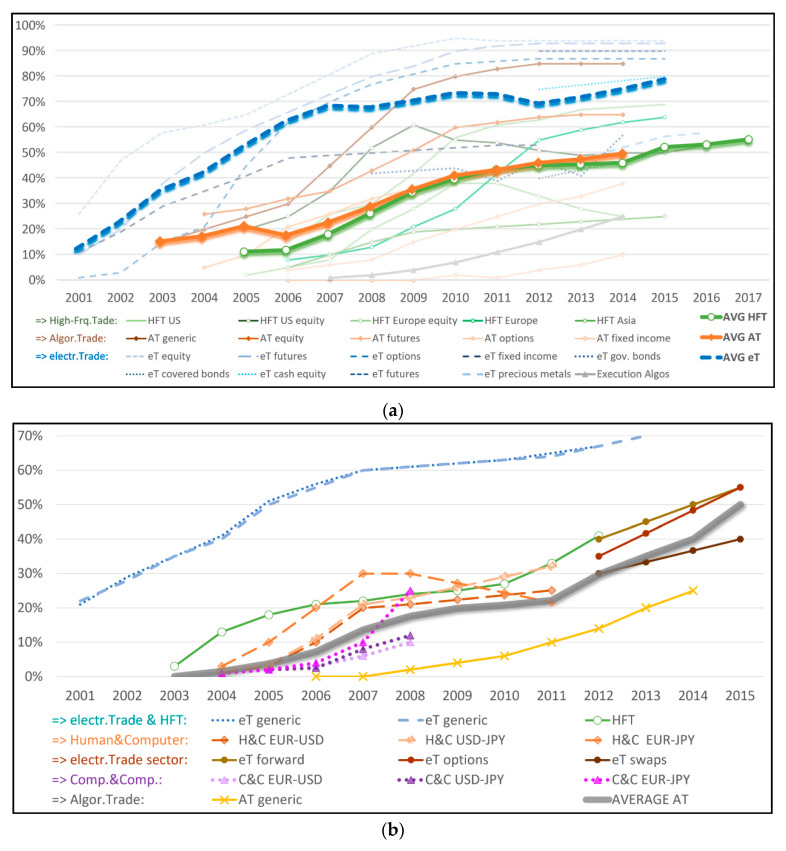
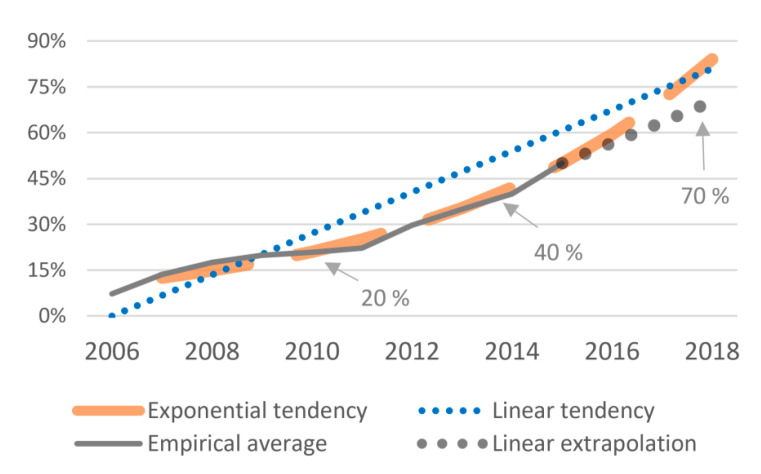
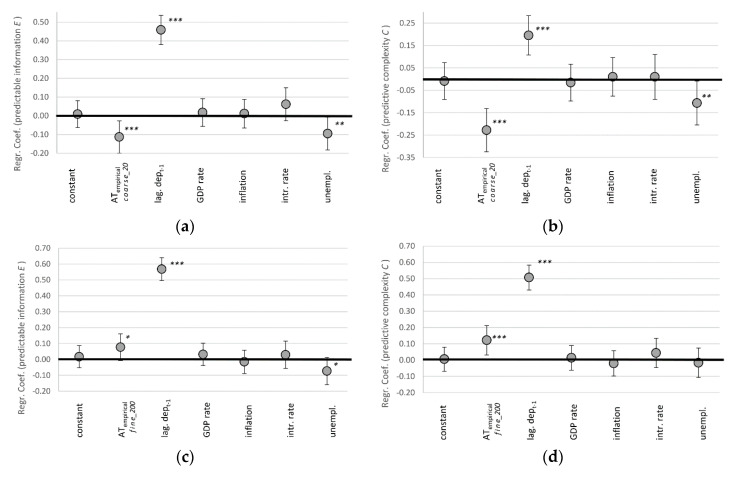
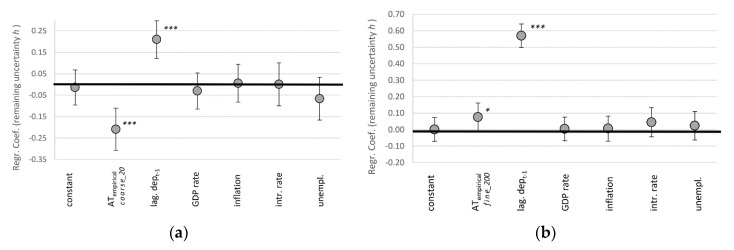
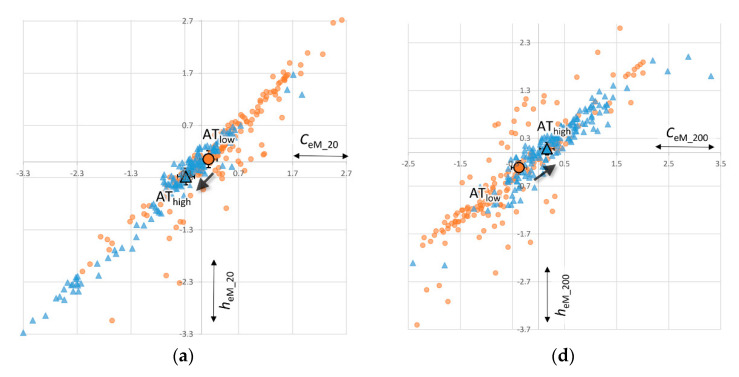
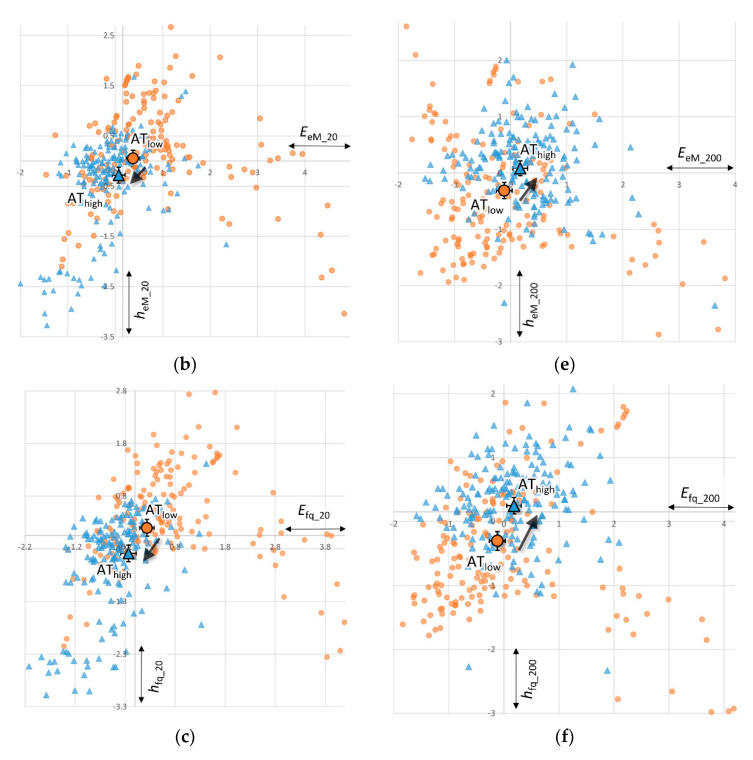
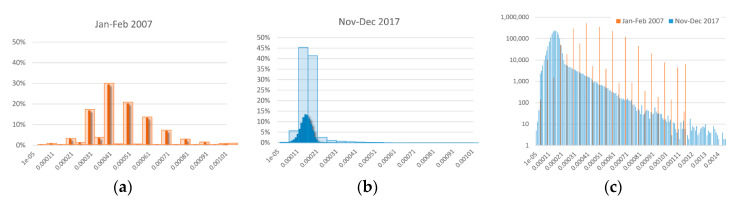
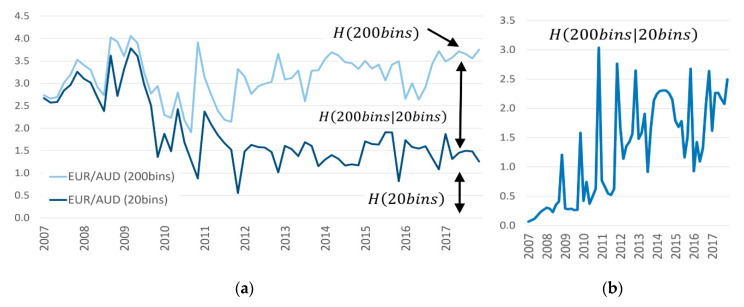
The machine-learning paradigm promises traders to reduce uncertainty through better predictions done by ever more complex algorithms. We ask about detectable results of both uncertainty and complexity at the aggregated market level. We analyzed almost one billion trades of eight currency pairs (2007-2017) and show that increased algorithmic trading is associated with more complex subsequences and more predictable structures in bid-ask spreads. However, algorithmic involvement is also associated with more future uncertainty, which seems contradictory, at first sight. On the micro-level, traders employ algorithms to reduce their local uncertainty by creating more complex algorithmic patterns. This entails more predictable structure and more complexity. On the macro-level, the increased overall complexity implies more combinatorial possibilities, and therefore, more uncertainty about the future. The chain rule of entropy reveals that uncertainty has been reduced when trading on the level of the fourth digit behind the dollar, while new uncertainty started to arise at the fifth digit behind the dollar (aka 'pip-trading'). In short, our information theoretic analysis helps us to clarify that the seeming contradiction between decreased uncertainty on the micro-level and increased uncertainty on the macro-level is the result of the inherent relationship between complexity and uncertainty.

Keywords: algorithmic trading; complexity; dynamical systems theory; machine learning; predictability.


Conflict of interest statement

The authors declare no conflict of interest.

Figures

Figure 1
Figure 1
Participation of algorithmic trading of different kind in different markets. (a) General Estimates; (b) Foreign Exchange (FX). Sources: (a) [9,10,11,12,13,14,15,16,17,18,19] (b) [9,11,12,13,15,18,19,20].
Figure 2
Figure 2
(a) Info-diagram of entropies of past (H(past)) and future (H(future)), relating predictive complexity (C), predictable information (E), and remaining uncertainty (h * L = H(future|past)); (b) schematic illustration of how to obtain statistics from a sequence consisting of a categorical variable with four different bins (A, B, C, D) by employing a sliding window of length L = 3.
Figure 3
Figure 3
Estimated tendencies of the growing market participation of algorithmic trading.
Figure 4
Figure 4
Regression coefficients for bi-monthly changes in complexity in form of predictable information EeM (a,c) and predictive complexity C (b,d), where algorithmic trading is measured in 20 coarse-grained bins (a,b) and 200 fine-grained bins (c,d), indicating 95% confidence intervals with error bars. *** p < 0.01, ** p < 0.05, * p < 0.1 (N = 520).
Figure 5
Figure 5
Regression coefficients for bi-monthly changes in remaining uncertainty in form of entropy rate heM, where algorithmic trading is measured in 20 coarse-grained bins (a) and 200 fine-grained bins (b), indicating 95% confidence intervals with error bars. *** p < 0.01, ** p < 0.05, * p < 0.1 (N = 520).
Figure 6
Figure 6
Estimated marginal means (large dots) from ANVOCA (95% confidence error bars), with thirds of ATemp as fixed factor, controlling for the covariates dept−1, GDPr, infl, intr, unpl; orange circles: third with lowest algorithmic trading (ATlow); blue triangles: third with highest algorithmic trading (AThigh); (ac) for coarse-grained perspective of 20 bins, (df) for fine-grained perspective of 200 bins. Note: in contrary to means, scatter data points are not corrected for control variables and some outlier are cut off by presentation.
Figure 6
Figure 6
Estimated marginal means (large dots) from ANVOCA (95% confidence error bars), with thirds of ATemp as fixed factor, controlling for the covariates dept−1, GDPr, infl, intr, unpl; orange circles: third with lowest algorithmic trading (ATlow); blue triangles: third with highest algorithmic trading (AThigh); (ac) for coarse-grained perspective of 20 bins, (df) for fine-grained perspective of 200 bins. Note: in contrary to means, scatter data points are not corrected for control variables and some outlier are cut off by presentation.
Figure 7
Figure 7
Frequency distribution of bid-ask spreads EUR/AUD (a) Jan.–Feb. 2007, unbinned and in 20 bins; (b) Nov.–Dec. 2017, unbinned and in 20 bins; (c) unbinned both 2007 and 2017, logarithmic scale.
Figure 8
Figure 8
Chain rule of entropy applied to EUR/AUD bid-ask spreads, with 20 and 200 bins. (a) visualizes the diverging tendency over time; (b) isolates the size of this area.
Figure 9
Figure 9
Visualization of ϵ-machines (aka predictive state machines) derived for (a) AUD/JPY Mar.–Apr. 2009, 200 bins; (b) EUR/AUD Jan.–Feb. 2017, 200 bins. The size of a node represents the steady state probability of the corresponding state. Clockwise curve indicates transition directionality. Transition color corresponds to symbols in the alphabet in the sequence.

References

    1. Agrawal A., Gans J., Goldfarb A. Prediction Machines: The Simple Economics of Artificial Intelligence. Harvard Business Press; Brighton, MA, USA: 2018.
    1. Brookshear J.G. Computer Science: An Overview. 10th ed. Addison Wesley; Boston, MA, USA: 2009.
    1. Johnson N., Zhao G., Hunsader E., Qi H., Johnson N., Meng J., Tivnan B. Abrupt rise of new machine ecology beyond human response time. Sci. Rep. 2013;3:2627. doi: 10.1038/srep02627. - DOI - PMC - PubMed
    1. Farmer J.D., Skouras S. An ecological perspective on the future of computer trading. Quant. Financ. 2013;13:325–346. doi: 10.1080/14697688.2012.757636. - DOI
    1. Golub A., Dupuis A., Olson R.B. High-Frequency Trading in FX Markets. In: Easley D., Prado M.M.L.D., O’Hara M., editors. High-frequency Trading: New Realities for Traders, Markets and Regulators. Risk Books; London, UK: 2013. pp. 21–44.