

Complex Extreme Sea Levels Prediction Analysis: Karachi Coast Case Study
- PMID: 33286321
- PMCID: PMC7517073
- DOI: 10.3390/e22050549
Complex Extreme Sea Levels Prediction Analysis: Karachi Coast Case Study
Abstract
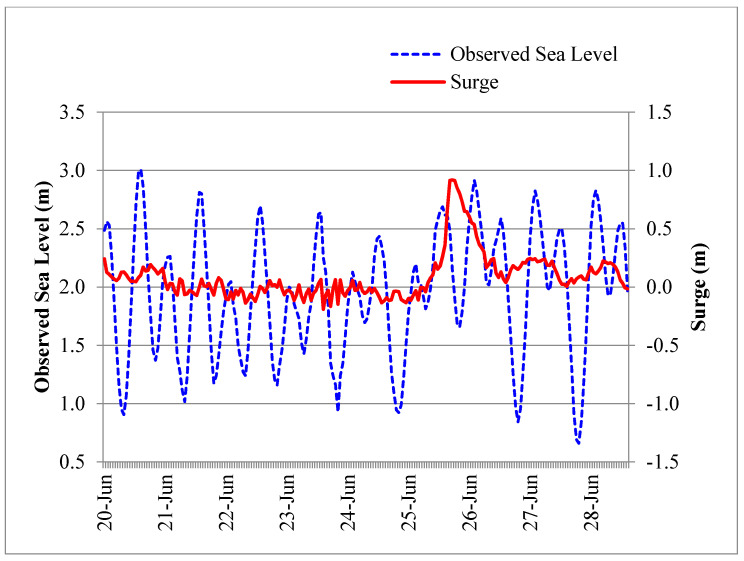
In this study, the analysis of the extreme sea level was carried out by using 10 years (2007-2016) of hourly tide gauge data of Karachi port station along the Pakistan coast. Observations revealed that the magnitudes of the tides usually exceeded the storm surges at this station. The main observation for this duration and the subsequent analysis showed that in June 2007 a tropical Cyclone "Yemyin" hit the Pakistan coast. The joint probability method (JPM) and the annual maximum method (AMM) were used for statistical analysis to find out the return periods of different extreme sea levels. According to the achieved results, the AMM and JPM methods erre compatible with each other for the Karachi coast and remained well within the range of 95% confidence. For the JPM method, the highest astronomical tide (HAT) of the Karachi coast was considered as the threshold and the sea levels above it were considered extreme sea levels. The 10 annual observed sea level maxima, in the recent past, showed an increasing trend for extreme sea levels. In the study period, the increment rates of 3.6 mm/year and 2.1 mm/year were observed for mean sea level and extreme sea level, respectively, along the Karachi coast. Tidal analysis, for the Karachi tide gauge data, showed less dependency of the extreme sea levels on the non-tidal residuals. By applying the Merrifield criteria of mean annual maximum water level ratio, it was found that the Karachi coast was tidally dominated and the non-tidal residual contribution was just 10%. The examination of the highest water level event (13 June 2014) during the study period, further favored the tidal dominance as compared to the non-tidal component along the Karachi coast.
Keywords: Pakistan coast; annual maximum method; complex system prediction; extreme sea level prediction; joint probability method.
Conflict of interest statement
The authors declare no conflict of interest.
Figures


References
-
- Alley R., Berntsen T., Bindoff N.L., Chen Z., Chidthaisong A., Friedlingstein P., Gregory J., Hegerl G., Heimann M., Hewitson B., et al. Change, Intergovernmental Panel on Climate Change. Climate Change 2007: The Physical Science Basis Summary for Policymakers Contribution of Working Group I to the Fourth Assessment Report of the Intergovernmental Panel on Climate Change Summary for Policymakers IPCC WGI Fourth Assessment Report. Cambridge University Press; Cambridge, UK: 2007.
-
- Parker A. Sea level oscillations in Japan and China since the start of the 20th century and consequences for coastal management-Part 2: China pearl river delta region. Ocean Coast. Manag. 2018;163:456–465. doi: 10.1016/j.ocecoaman.2018.08.004. - DOI
-
- Jury M.R. Puerto Rico sea level trend in regional context. Ocean Coast. Manag. 2018;163:478–484. doi: 10.1016/j.ocecoaman.2018.08.006. - DOI
-
- Mehdizadeh S.S., Karamalipour S.E., Asoodeh R. Sea level rise effect on seawater intrusion into layered coastal aquifers (simulation using dispersive and sharp-interface approaches) Ocean Coast. Manag. 2017;138:11–18. doi: 10.1016/j.ocecoaman.2017.01.001. - DOI
Grants and funding
LinkOut - more resources
Full Text Sources
Miscellaneous
