Multi-scale Entropy Evaluates the Proarrhythmic Condition of Persistent Atrial Fibrillation Patients Predicting Early Failure of Electrical Cardioversion
- PMID: 33286519
- PMCID: PMC7517291
- DOI: 10.3390/e22070748
Multi-scale Entropy Evaluates the Proarrhythmic Condition of Persistent Atrial Fibrillation Patients Predicting Early Failure of Electrical Cardioversion
Abstract
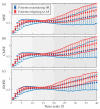
Atrial fibrillation (AF) is nowadays the most common cardiac arrhythmia, being associated with an increase in cardiovascular mortality and morbidity. When AF lasts for more than seven days, it is classified as persistent AF and external interventions are required for its termination. A well-established alternative for that purpose is electrical cardioversion (ECV). While ECV is able to initially restore sinus rhythm (SR) in more than 90% of patients, rates of AF recurrence as high as 20-30% have been found after only a few weeks of follow-up. Hence, new methods for evaluating the proarrhythmic condition of a patient before the intervention can serve as efficient predictors about the high risk of early failure of ECV, thus facilitating optimal management of AF patients. Among the wide variety of predictors that have been proposed to date, those based on estimating organization of the fibrillatory (f-) waves from the surface electrocardiogram (ECG) have reported very promising results. However, the existing methods are based on traditional entropy measures, which only assess a single time scale and often are unable to fully characterize the dynamics generated by highly complex systems, such as the heart during AF. The present work then explores whether a multi-scale entropy (MSE) analysis of the f-waves may provide early prediction of AF recurrence after ECV. In addition to the common MSE, two improved versions have also been analyzed, composite MSE (CMSE) and refined MSE (RMSE). When analyzing 70 patients under ECV, of which 31 maintained SR and 39 relapsed to AF after a four week follow-up, the three methods provided similar performance. However, RMSE reported a slightly better discriminant ability of 86%, thus improving the other multi-scale-based outcomes by 3-9% and other previously proposed predictors of ECV by 15-30%. This outcome suggests that investigation of dynamics at large time scales yields novel insights about the underlying complex processes generating f-waves, which could provide individual proarrhythmic condition estimation, thus improving preoperative predictions of ECV early failure.
Keywords: atrial fibrillation; composite multiscale entropy; electrical cardioversion; electrocardiogram; multiscale entropy; refined multiscale entropy; sample entropy.
Conflict of interest statement
The authors declare no conflict of interest. The funders had no role in the design of the study; in the collection, analyses, or interpretation of data; in the writing of the manuscript, or in the decision to publish the results.
Figures


References
-
- Duarte R.C.F., Rios D.R.A., Figueiredo E.L., Caiaffa J.R.S., Silveira F.R., Lanna R., Alves L.C.V., Martins G.L., Reis H.J., Reis E.A., et al. Thrombin Generation and other hemostatic parameters in patients with atrial fibrillation in use of warfarin or rivaroxaban. J. Thromb. Thrombolysis. 2020 doi: 10.1007/s11239-020-02126-3. - DOI - PubMed
Grants and funding
LinkOut - more resources
Full Text Sources
Research Materials

