. 2020 Aug 15;22(8):896.
doi: 10.3390/e22080896.

Inferring an Observer's Prediction Strategy in Sequence Learning Experiments

Affiliations

Inferring an Observer's Prediction Strategy in Sequence Learning Experiments

Abhinuv Uppal et al. Entropy (Basel). .

Abstract

Cognitive systems exhibit astounding prediction capabilities that allow them to reap rewards from regularities in their environment. How do organisms predict environmental input and how well do they do it? As a prerequisite to answering that question, we first address the limits on prediction strategy inference, given a series of inputs and predictions from an observer. We study the special case of Bayesian observers, allowing for a probability that the observer randomly ignores data when building her model. We demonstrate that an observer's prediction model can be correctly inferred for binary stimuli generated from a finite-order Markov model. However, we can not necessarily infer the model's parameter values unless we have access to several "clones" of the observer. As stimuli become increasingly complicated, correct inference requires exponentially more data points, computational power, and computational time. These factors place a practical limit on how well we are able to infer an observer's prediction strategy in an experimental or observational setting.

Keywords: Bayesian models; prediction; sequence learning; stochastic processes.


Conflict of interest statement

The funders had no role in the design of the study; in the collection, analyses, or interpretation of data; in the writing of the manuscript, or in the decision to publish the results.

Figures

Figure 1
Figure 1
The quintessential experiment to reveal an observer’s prediction strategy: observations are shown to the observer, who then tries to predict the next observation. This happens repeatedly for as many trials as the observer can stand.
Figure 2
Figure 2
Two example order-R Markov models. Order 0 (top) and 1 (bottom) with the finite alphabet A={0,1}.
Figure 3
Figure 3
The average error in ϕngramargmax parameter inference for n-gram argmax prediction strategy and ϕngramaverage for the n-gram average prediction strategy shows that the inference seems to perform perfectly. For n-gram average, we see that every combination of parameters was able to produce perfect estimates for ϕngramaverage. For n-gram argmax, the sample sizes were 7 for each pair corresponding to R=2,6 and 10 for R=4. For n-gram average, the sample sizes were 9 for each (R,N) pair.
Figure 3
Figure 3
The average error in ϕngramargmax parameter inference for n-gram argmax prediction strategy and ϕngramaverage for the n-gram average prediction strategy shows that the inference seems to perform perfectly. For n-gram average, we see that every combination of parameters was able to produce perfect estimates for ϕngramaverage. For n-gram argmax, the sample sizes were 7 for each pair corresponding to R=2,6 and 10 for R=4. For n-gram average, the sample sizes were 9 for each (R,N) pair.
Figure 4
Figure 4
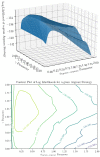
Surface and contour plot of log likelihood of the n-gram argmax prediction strategy show a peak at some combination of parameters. On the x and y axes are parameters ϕngramargmax (the ratio of β, the probability of dropping an observation, to α1, the concentration parameter subtracted by 1) and γ (the regularization term in the prior over models), and on the z-axis is the log likelihood of the observer model for a string of inputs, averaged over infinite identical observers. It is difficult to see in the pictures, but there are ridges in the average log likelihood as a function of ϕngramargmax, which we still cannot explain.
Figure 5
Figure 5
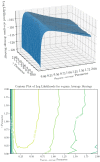
Surface and contour plot of log likelihood of the n-gram average prediction strategy show a much smoother surface than n-gram argmax. On the x and y axes are parameters ϕngramaverage (the ratio of β, the probability of dropping an observation, to α, the concentration parameter subtracted by 1) and γ (the regularization term in the prior over models), and on the z-axis is the log likelihood of the observer model for a string of inputs, averaged over infinite identical observers. This appears to be a much nicer surface to optimize over, though it is not without its ridges.

References

    1. Friston K.J., Daunizeau J., Kilner J., Kiebel S.J. Action and behavior: A free-energy formulation. Biol. Cybern. 2010;102:227–260. doi: 10.1007/s00422-010-0364-z. - DOI - PubMed
    1. Clark A. Whatever next? Predictive brains, situated agents, and the future of cognitive science. Behav. Brain Sci. 2013;36:181–204. doi: 10.1017/S0140525X12000477. - DOI - PubMed
    1. Hohwy J. The Predictive Mind. Oxford University Press; Oxford, UK: 2013.
    1. Von Helmholtz H. Handbuch der physiologischen Optik: Mit 213 in den Text eingedruckten Holzschnitten und 11 Tafeln. [(accessed on 1 July 2020)];1860 Available online: https://books.google.co.uk/books?hl=en&lr=&id=4u7lRLnD11IC&oi=fnd&pg=PA8....
    1. Attenave F. Applications of Information Theory to Psychology: A Summary of Basic Concepts, Methods and Results. Holt-Dryden Book; New York, NY, USA: 1959.