. 2020 Dec 3;9(12):1792.
doi: 10.3390/foods9121792.

Highly Branched Neo-Fructans (Agavins) Attenuate Metabolic Endotoxemia and Low-Grade Inflammation in Association with Gut Microbiota Modulation on High-Fat Diet-Fed Mice

Affiliations

Highly Branched Neo-Fructans (Agavins) Attenuate Metabolic Endotoxemia and Low-Grade Inflammation in Association with Gut Microbiota Modulation on High-Fat Diet-Fed Mice

Alicia Huazano-García et al. Foods. .

Abstract

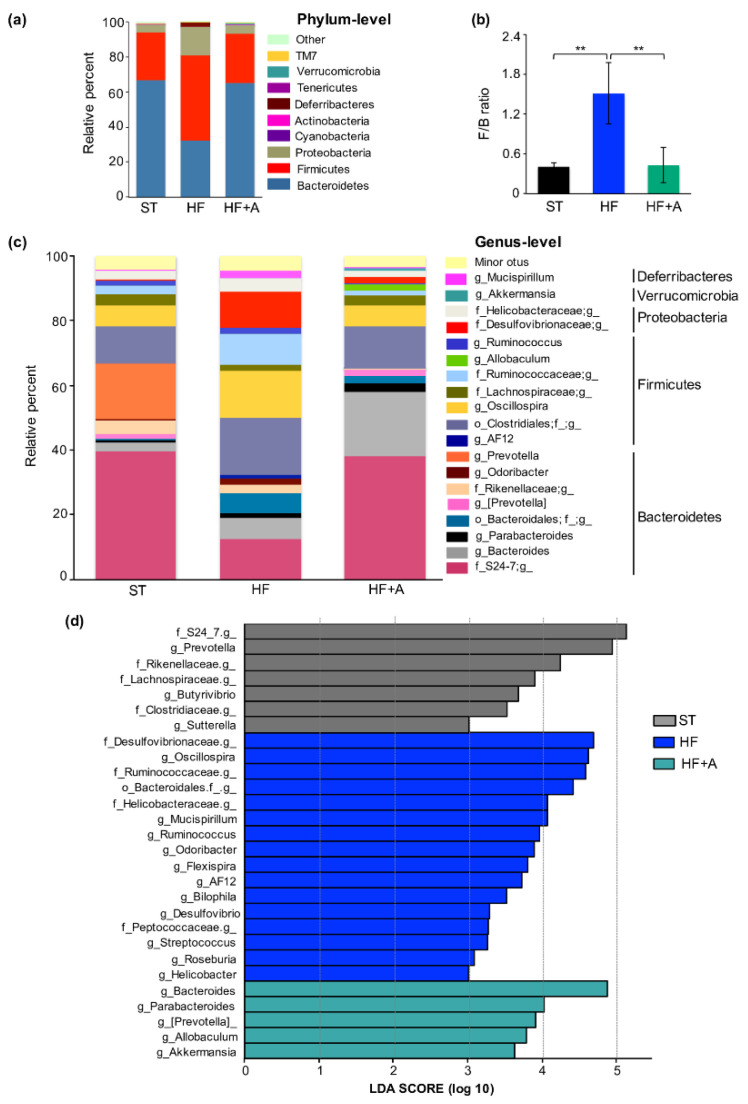
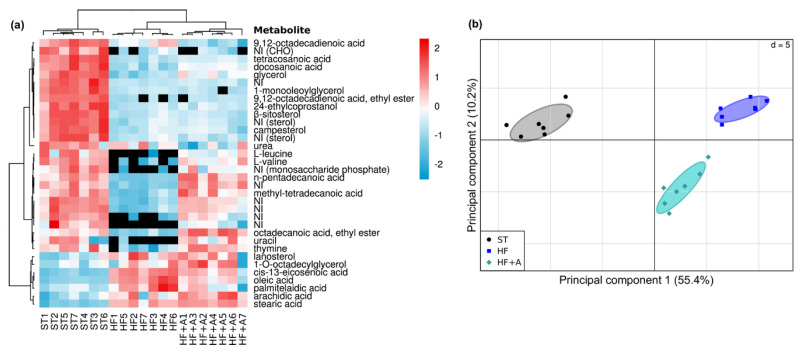
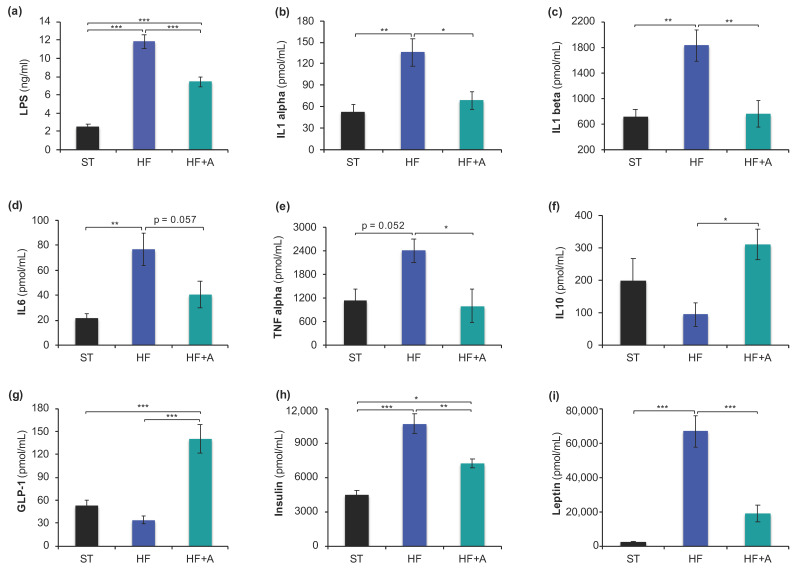
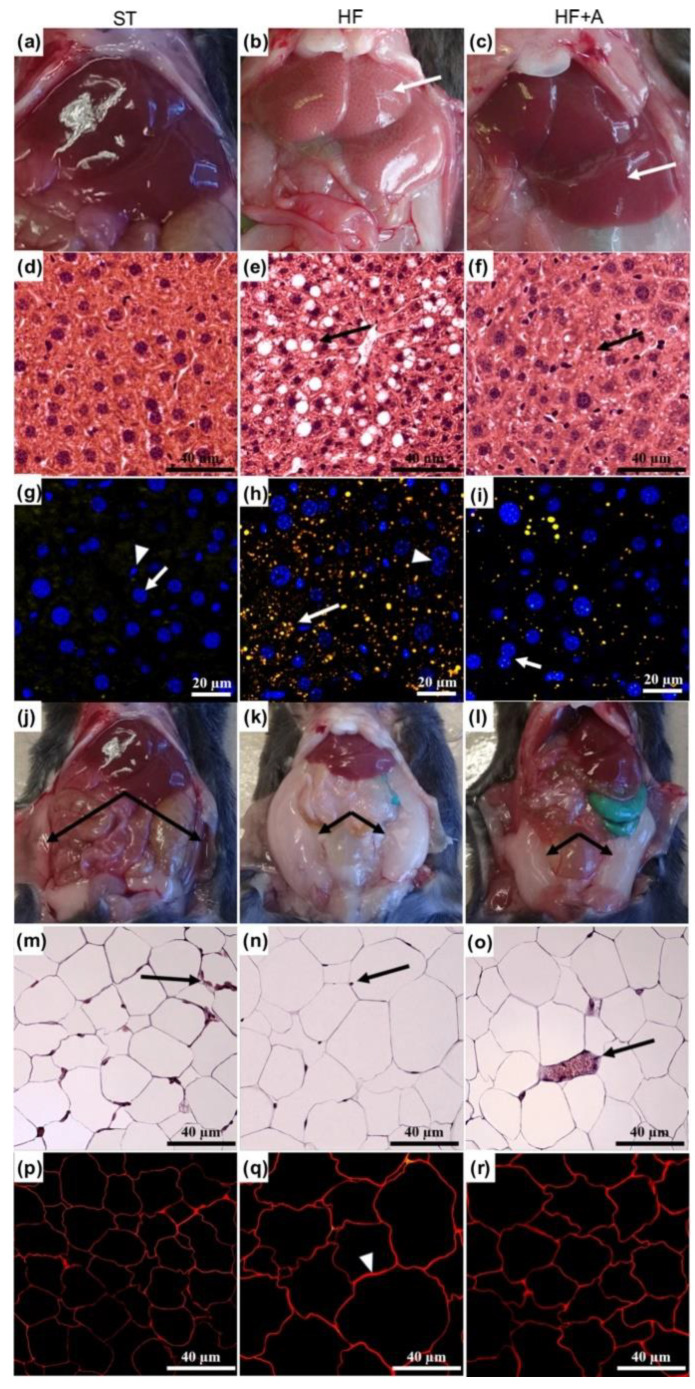
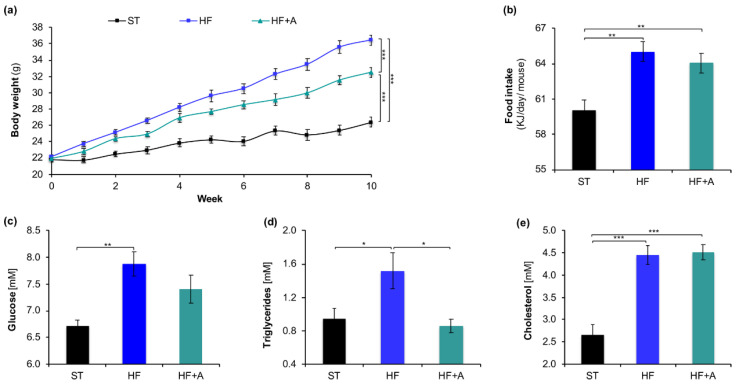
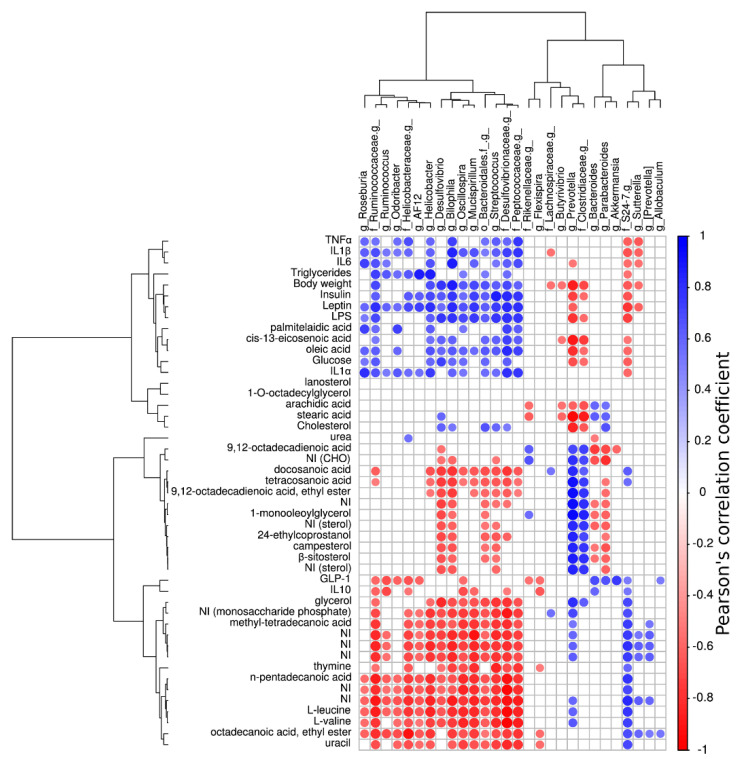
Highly branched neo-fructans (agavins) are natural prebiotics found in Agave plants, with a large capacity to mitigate the development of obesity and metabolic syndrome. Here, we investigated the impact of agavins intake on gut microbiota modulation and their metabolites as well as their effect on metabolic endotoxemia and low-grade inflammation in mice fed high-fat diet. Mice were fed with a standard diet (ST) and high-fat diet (HF) alone or plus an agavins supplement (HF+A) for ten weeks. Gut microbiota composition, fecal metabolite profiles, lipopolysaccharides (LPS), pro-inflammatory cytokines, and systemic effects were analyzed. Agavins intake induced substantial changes in gut microbiota composition, enriching Bacteroides, Parabacteroides, Prevotella, Allobaculum, and Akkermansia genus (LDA > 3.0). l-leucine, l-valine, uracil, thymine, and some fatty acids were identified as possible biomarkers for this prebiotic supplement. As novel findings, agavins supplementation significantly decreased LPS and pro-inflammatory (IL-1α, IL-1β, and TNF-α; p < 0.05) cytokines levels in portal vein. In addition, lipid droplets content in the liver and adipocytes size also decreased with agavins consumption. In conclusion, agavins supplementation mitigate metabolic endotoxemia and low-grade inflammation in association with gut microbiota regulation and their metabolic products, thus inducing beneficial responses on metabolic disorders in high-fat diet-fed mice.

Keywords: agavins; branched neo-fructans; endotoxemia; metabolites; microbiota; obesity; prebiotics.


Conflict of interest statement

The authors declare no conflict of interest.

Figures

Figure 1
Figure 1
Differences in relative abundance of bacterial taxa in mice fed with high-fat diet plus agavins supplementation. (a) Bacterial taxa plot at the phylum level. (b) Firmicutes/Bacteroidetes ratio. Data are shown as average ± SD, and were analyzed using one-way ANOVA, followed by Tukey multiple comparison test. Significant difference is indicated by ** p < 0.01. (c) Bacterial taxa plot at the genus level. Each taxa > 1% of the average relative abundance in groups is indicated by a different color. Taxa are reported at the lowest identifiable level, indicated by the letter preceding the underscore: f, family; g, genus. (d) Histogram of biomarker bacteria in each group. Linear Discriminant Analysis (LDA) Effect Size (>3.0 fold) was used to determine statistically significant biomarkers. HF (mice fed with a high-fat diet); HF+A (mice fed with a high-fat diet plus agavins); ST (mice fed with a standard diet); for each experimental group (n = 5).
Figure 2
Figure 2
Fecal metabolites differences after agavins consumption. (a) Heat map of differential metabolites found in the feces of mice. NI (Not Identified); Colors (red, relative increase; blue, relative decrease; black, absence metabolite). (b) PCA plot showing separated clusters between the different treatments. Mahalanobis distance (Md) and Hotelling’s T2 test were calculated to measure and confirm the difference between every pair of clusters (ST vs. HF: Md = 372.8, p = 1.33 × 10⁻⁹; ST vs. HF+A: Md = 219.4, p = 9.89 × 10⁻¹¹; HF vs. HF+A: Md = 91.3, p = 3.63 × 10⁻⁶). HF (mice fed with a high-fat diet); HF + A (mice fed with a high-fat diet plus agavins); ST (mice fed with a standard diet); for each experimental group (n = 7).
Figure 3
Figure 3
Agavins consumption decreased LPS and pro-inflammatory cytokine levels as well as insulin and leptin hormones in mice fed high-fat diet. (a) Concentration of LPS; (b) IL-1α; (c) IL-1β; (d) IL-6; (e) TNF-α; (f) IL-10; (g) GLP-1; (h) Insulin; and (i) Leptin. Data are shown as average ± SEM (n = 6/group). Data were analyzed using one-way ANOVA, followed by Tukey multiple comparison test. Significant difference is indicated by * p < 0.05, ** p < 0.01 and *** p < 0.001; near-significant differences are also reported. HF (mice fed with a high-fat diet); HF+A (mice fed with a high-fat diet plus agavins); ST (mice fed with a standard diet).
Figure 4
Figure 4
Agavins supplementation reduced hepatic steatosis and lipid droplets content as well as the amount of adipose tissue and adipocyte size in mice fed high-fat diet. (ac) Representative images of liver after consumption of the different diets; (df) Histopathological examination of mouse livers by hematoxylin and eosin staining; (gi) Accumulation of lipid droplets in the mouse livers. Lipid droplets were stained with red Nile (yellow) and nucleus with DAPI (blue); and analyzed using a multiphoton microscope system. (jl) Representative images of adipose tissue present in the mice after the intake of the different diets; (mo) Histopathological examination of adipocyte size using hematoxylin and eosin staining; (pr) Adipocytes stained with red Nile. HF (mice fed with a high-fat diet); HF+A (mice fed with a high-fat diet plus agavins); ST (mice fed with a standard diet).
Figure 5
Figure 5
Agavins supplementation reduced body weight gain, food intake, glucose and cholesterol levels in mice fed high-fat diet. (a) Body weight evolution; (b) Food intake; (c) Glucose; (d) Triglycerides; (e) Cholesterol levels in blood. Data are shown as average ± SEM (n = 7/group). Data were analyzed using one-way ANOVA, followed by Tukey multiple comparison test. Significant difference is indicated by * p < 0.05, ** p < 0.01, *** p < 0.001. HF (mice fed with a high-fat diet); HF+A (mice fed with a high-fat diet plus agavins); ST (mice fed with a standard diet).
Figure 6
Figure 6
Correlogram showing only significant Pearson’s correlations between key bacterial genera and metabolites, inflammatory biomarkers, hormones, and systemic effects. Blue circles denote a positive correlation while red ones denote a negative correlation.

References

    1. Hruby A., Hu F.B. The epidemiology of obesity: A big picture. Pharmacoeconomics. 2015;33:673–689. doi: 10.1007/s40273-014-0243-x. - DOI - PMC - PubMed
    1. Hotamisligil G.S. Inflammation and metabolic disorders. Nature. 2006;444:860–867. doi: 10.1038/nature05485. - DOI - PubMed
    1. Gregor M.F., Hotamisligil G.S. Inflammatory mechanisms in obesity. Annu. Rev. Immunol. 2011;29:415–445. doi: 10.1146/annurev-immunol-031210-101322. - DOI - PubMed
    1. Turnbaugh P.J., Bäckhed F., Fulton L., Gordon J.I. Diet-induced obesity is linked to marked but reversible alterations in the mouse distal gut microbiome. Cell Host Microbe. 2008;3:213–223. doi: 10.1016/j.chom.2008.02.015. - DOI - PMC - PubMed
    1. Cani P.D., Amar J., Iglesias M.A., Poggi M., Knauf C., Bastelica A.M., Neyrinck A.M., Fava F., Tuohy K.M., Chabo C., et al. Metabolic endotoxemia initiates obesity and insulin resistance. Diabetes. 2007;56:1761–1772. doi: 10.2337/db06-1491. - DOI - PubMed