. 2020 Dec 3;21(23):9237.
doi: 10.3390/ijms21239237.

The Arabidopsis Mitochondrial Glutaredoxin GRXS15 Provides [2Fe-2S] Clusters for ISCA-Mediated [4Fe-4S] Cluster Maturation

Affiliations

The Arabidopsis Mitochondrial Glutaredoxin GRXS15 Provides [2Fe-2S] Clusters for ISCA-Mediated [4Fe-4S] Cluster Maturation

Tamanna Azam et al. Int J Mol Sci. .

Abstract

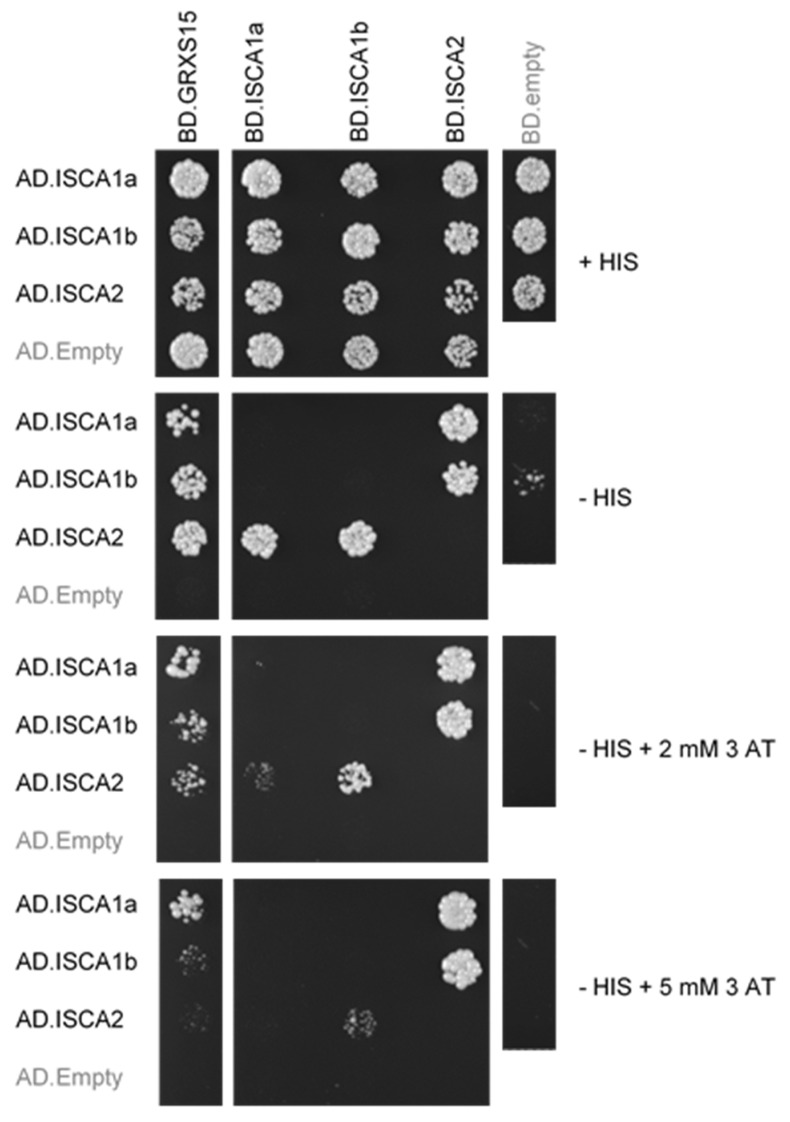
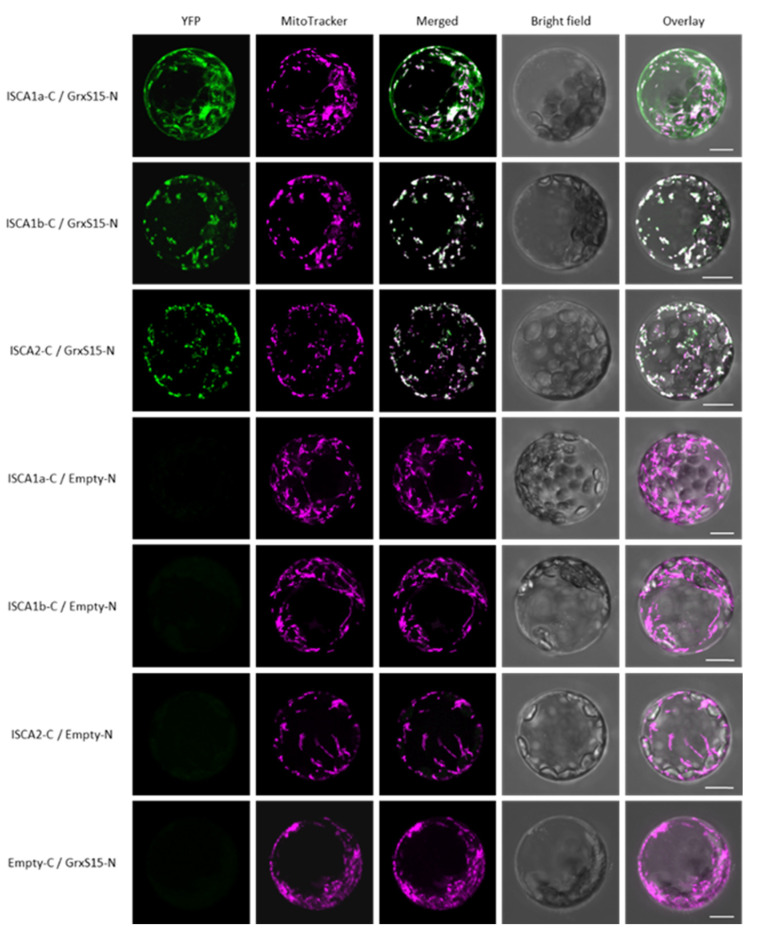
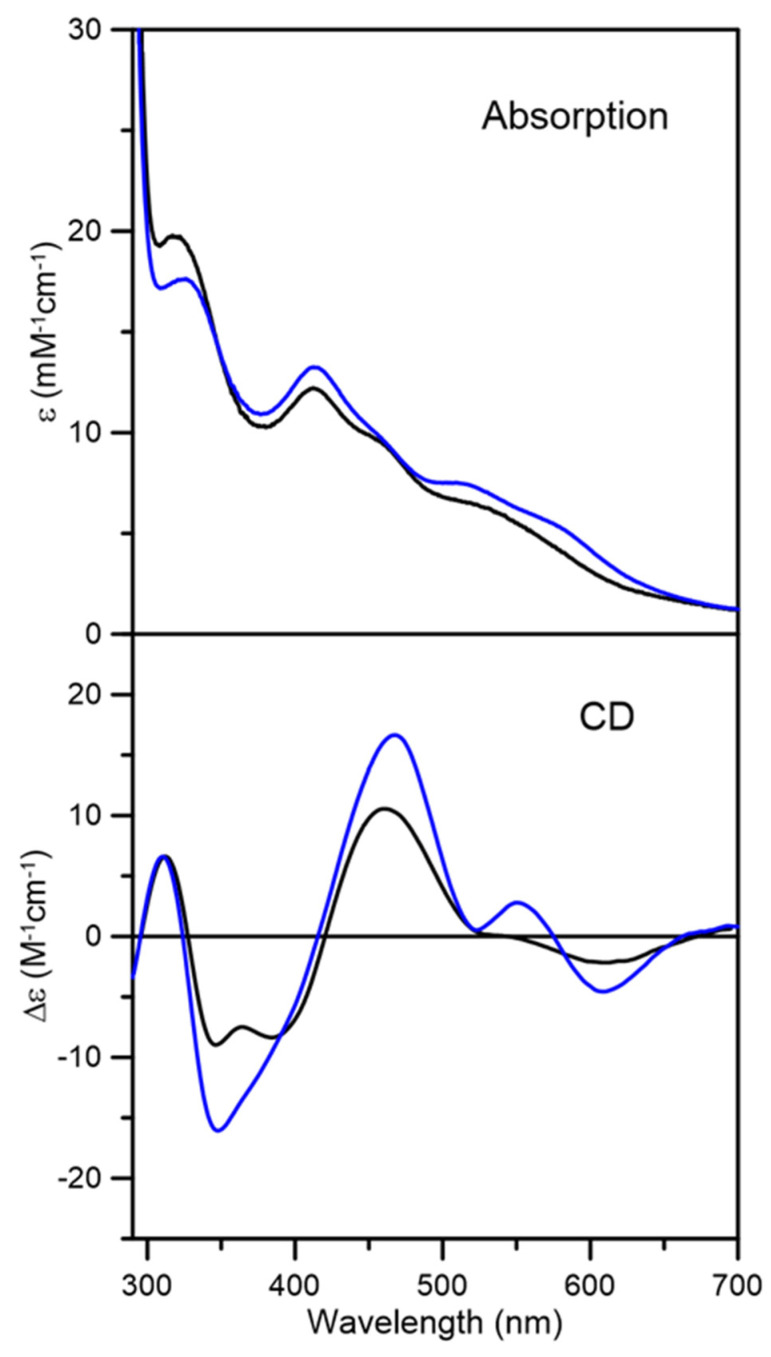
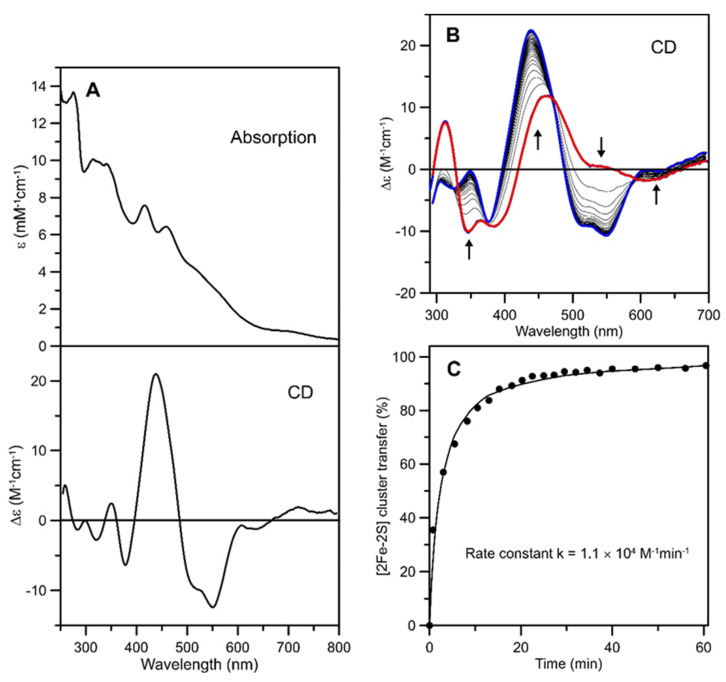
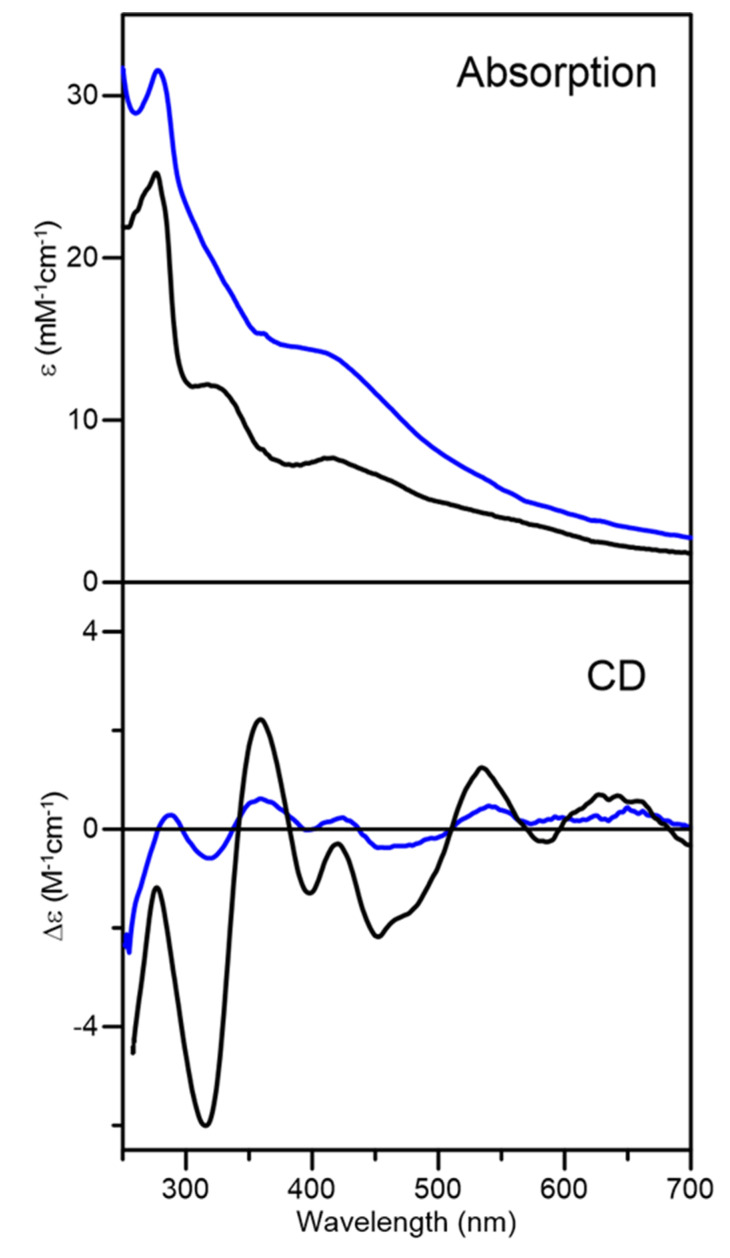
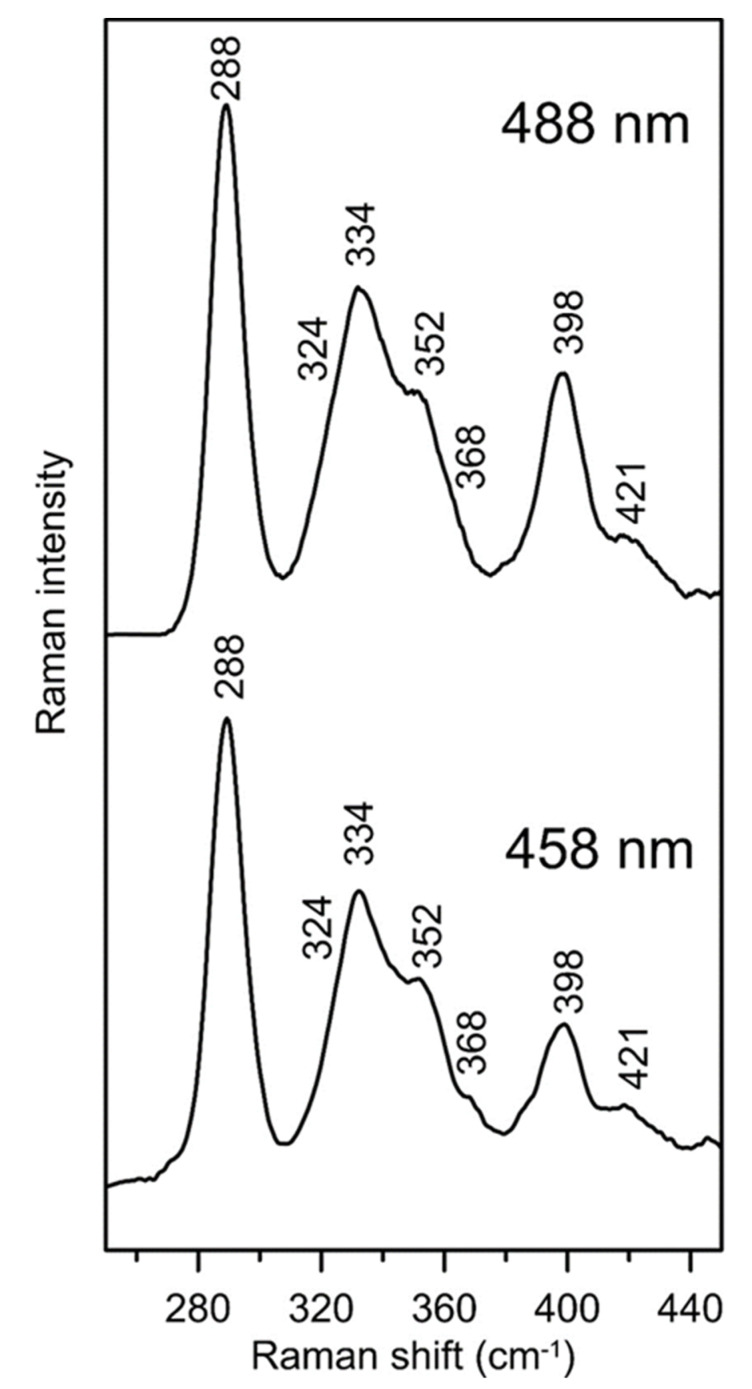
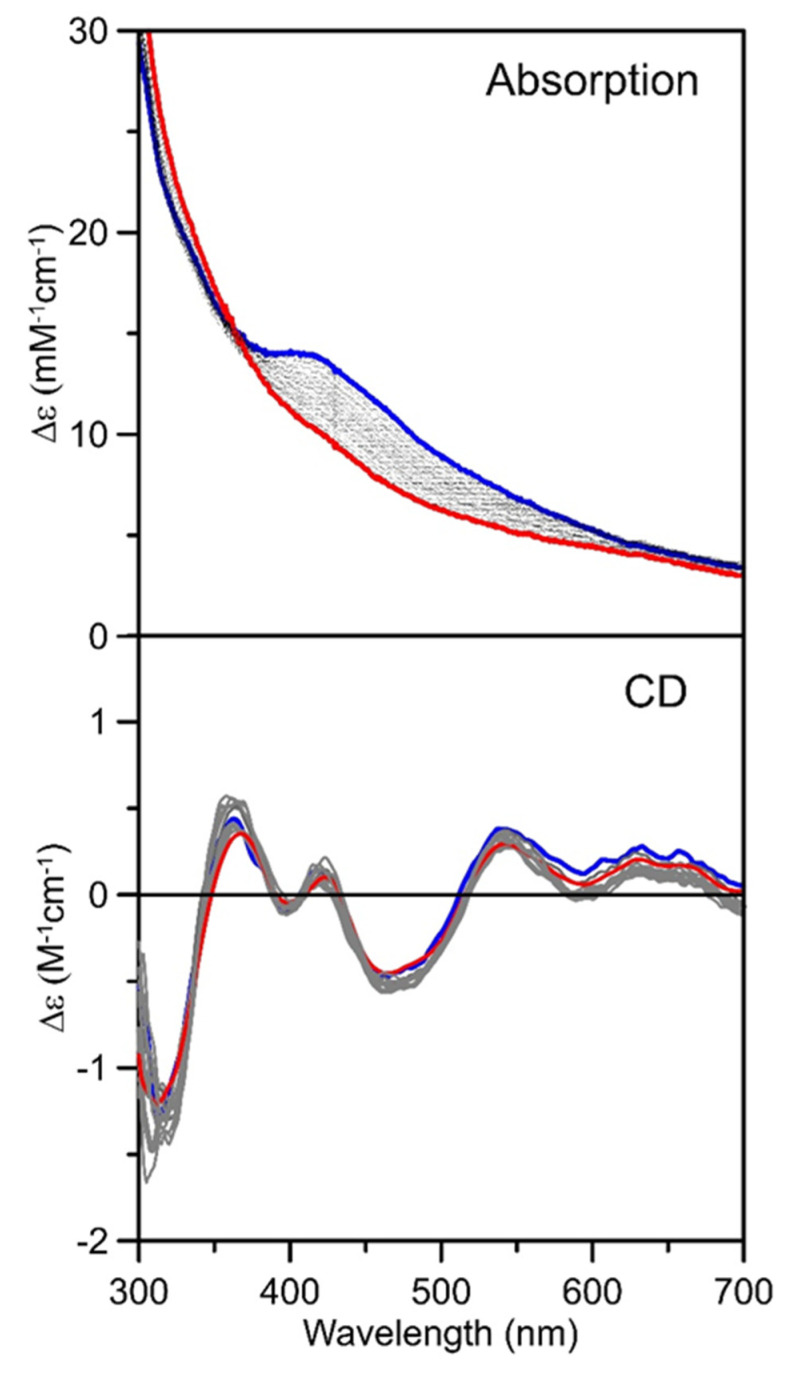
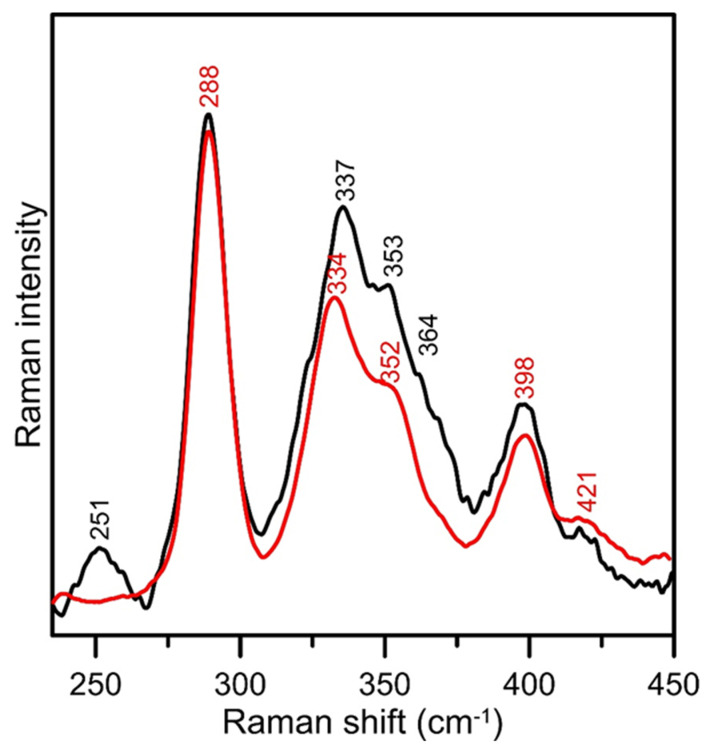
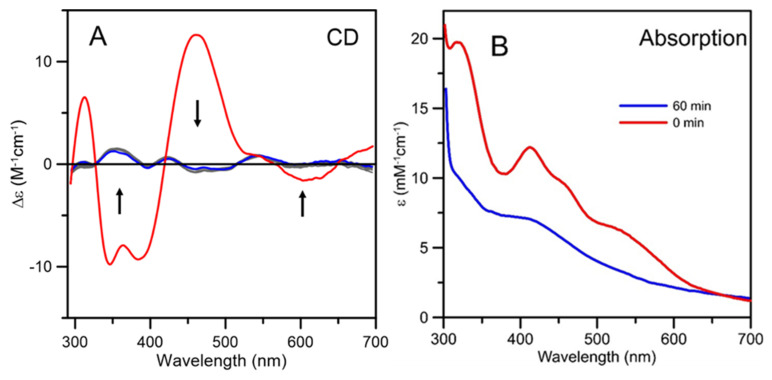
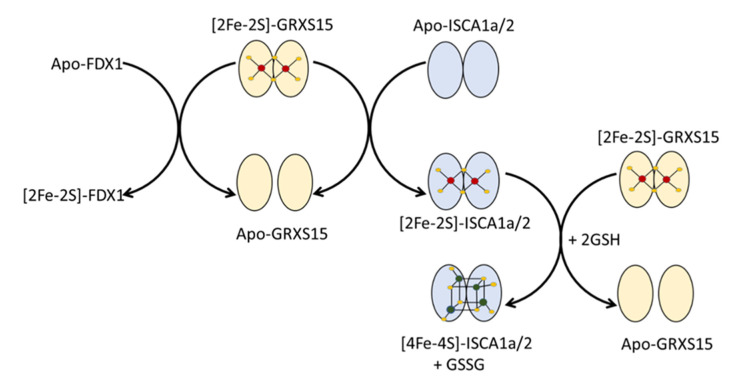
Iron-sulfur (Fe-S) proteins are crucial for many cellular functions, particularly those involving electron transfer and metabolic reactions. An essential monothiol glutaredoxin GRXS15 plays a key role in the maturation of plant mitochondrial Fe-S proteins. However, its specific molecular function is not clear, and may be different from that of the better characterized yeast and human orthologs, based on known properties. Hence, we report here a detailed characterization of the interactions between Arabidopsis thaliana GRXS15 and ISCA proteins using both in vivo and in vitro approaches. Yeast two-hybrid and bimolecular fluorescence complementation experiments demonstrated that GRXS15 interacts with each of the three plant mitochondrial ISCA1a/1b/2 proteins. UV-visible absorption/CD and resonance Raman spectroscopy demonstrated that coexpression of ISCA1a and ISCA2 resulted in samples with one [2Fe-2S]2+ cluster per ISCA1a/2 heterodimer, but cluster reconstitution using as-purified [2Fe-2S]-ISCA1a/2 resulted in a [4Fe-4S]2+ cluster-bound ISCA1a/2 heterodimer. Cluster transfer reactions monitored by UV-visible absorption and CD spectroscopy demonstrated that [2Fe-2S]-GRXS15 mediates [2Fe-2S]2+ cluster assembly on mitochondrial ferredoxin and [4Fe-4S]2+ cluster assembly on the ISCA1a/2 heterodimer in the presence of excess glutathione. This suggests that ISCA1a/2 is an assembler of [4Fe-4S]2+ clusters, via two-electron reductive coupling of two [2Fe-2S]2+ clusters. Overall, the results provide new insights into the roles of GRXS15 and ISCA1a/2 in effecting [2Fe-2S]2+ to [4Fe-4S]2+ cluster conversions for the maturation of client [4Fe-4S] cluster-containing proteins in plants.

Keywords: Arabidopsis thaliana; ISCA proteins; Raman spectroscopy; circular dichroism; glutaredoxin; iron-sulfur cluster trafficking; iron-sulfur protein; mitochondria; protein-protein interaction.


Conflict of interest statement

The authors declare no conflict of interest.

Figures

Figure 1
Figure 1
Interactions among arabidopsis GRXS15 and ISCA proteins detected by binary yeast two-hybrid assays. The cotransformed yeast cells were plated at an OD600 of 0.05 on a control plate containing histidine (+HIS) and on test plates without histidine (-HIS) and eventually containing 2 or 5 mM 3-amino-1,2,4-triazole (3AT). The constructs allow expressing fusions between the Gal4 activation domain (AD) or Gal4 DNA binding domain (BD) and the mature forms of each protein at the C-terminus. Yeast growth revealing protein-protein interaction was recorded after five days at 30 °C. Yeast cells were also cotransformed with plasmid pairwises involving an empty pGADT7 or pGBKT7 (AD or BD-empty) to check that none of the proteins expressed alone in yeast cells can transactivate the HIS reporter gene. Only the AD-ISCA1a construct generated a weak transactivation (i.e., visible only in absence of 3-AT). The images shown are representative of three independent transformation experiments.
Figure 2
Figure 2
BiFC assays between arabidopsis GRXS15 and ISCA proteins in arabidopsis leaf protoplasts. Arabidopsis protoplasts obtained from four week-old plantlets were transfected with combinations of two vectors expressing GRXS15 fused to the N-terminal region of YFP (GRXS15-N in panels) and ISCAs cloned upstream of the C-terminal region of YFP (ISCA-C in panels). The YFP fluorescence was recorded 24 h post-transfection by confocal microscopy. All confocal images shown here were captured using a maximum Z-stack intensity projection. Images showing confocal plans without Z-stack intensity projection are shown in Figure S3. Negative controls verifying that none of the proteins expressed alone can restore YFP fluorescence are shown. BiFC results obtained using opposite protein fusion conformations (GRXS15-C coexpressed with ISCA-N) showed less clear-cut results as a strong fluorescence in the cytosol suggested the formation of aggregates was obtained for some combinations. Bars = 10 μm.
Figure 3
Figure 3
UV-visible absorption and circular dichroism spectra of reconstituted At GRXS15. Fraction 1 (black line) and fraction 2 (blue line) were obtained after separation using a Mono-Q column. Spectra were recorded under anaerobic conditions in sealed 0.1 cm cuvettes in 100 mM Tris-HCl buffer with 5 mM GSH at pH 7.5. The ε and Δε values are based on concentration of At GRXS15 dimer.
Figure 4
Figure 4
Cluster transfer from At [2Fe-2S]2+-GRXS15 to At apo-mFDX1 monitored by CD spectroscopy as a function of time. (A) Room temperature UV-visible absorption and CD spectra of [2Fe-2S]2+ cluster-bound as-isolated At mFDX1. (B) CD spectra of the cluster transfer reaction mixture that was initially 40 µM in GRXS15 [2Fe-2S]2+ clusters and 40 µM in apo-mFDX1. The thick red line corresponds to [2Fe-2S]2+-GRXS15 recorded before addition of apo-mFDX1. The thin grey lines correspond to CD spectra recorded at 1, 3, 5, 8, 10, 13, 15, 17, 20, 22, 25, 27, 30, 32, 34, 37, 40, 45, 50, 56, 60, 69, 75, 86, 95, 101, 105, 110 and 120 min after the addition of apo-mFDX1. The thick blue line corresponds to complete [2Fe-2S]2+ cluster transfer to mFDX1. The arrows indicate the direction of intensity change with increasing time at selected wavelengths and Δε values were calculated based on the initial concentration of [2Fe-2S]2+ clusters. The cluster transfer reaction was carried out under anaerobic conditions at room temperature in 100 mM Tris-HCl buffer at pH 7.8. (C) Kinetic simulation of cluster transfer from [2Fe-2S]2+-GRXS15 to apo-mFDX1 based on second-order kinetics and the initial concentrations of [2Fe-2S]2+ clusters on [2Fe-2S]2+-GRXS15 and of apo-mFDX1. Percent cluster transfer was assessed by CD intensity at 550 nm (black circles) and simulated with a second-order rate constant of 1.1 × 10⁴ M−1min−1.
Figure 5
Figure 5
Room temperature UV-visible absorption and CD spectra of At ISCA1a/2 heterodimer. The [2Fe-2S]2+ cluster-bound as-isolated At ISCA1a/2 (black lines) and [4Fe-4S]2+ cluster-bound reconstituted At ISCA1a/2 (blue lines) are shown. All ε and Δε values are based on ISCA1a/2 heterodimer concentration.
Figure 6
Figure 6
Resonance Raman spectra of [2Fe-2S]2+ cluster-bound as-isolated At ISCA1a/2 using 458-nm and 488-nm laser excitation. The sample (~2 mM [2Fe-2S]2+ clusters) in 100 mM Tris-HCl buffer at pH 7.8 was in the form of a frozen droplet at 17 K. The spectrum is the sum of 100 individual scans with each scan involving photon counting for 1 s at 0.5 cm−1 increments with 7 cm−1 spectral resolution. Bands due to lattice modes of the frozen buffer solution were subtracted from both spectra.
Figure 7
Figure 7
Oxygen degrades [4Fe-4S]2+ clusters, but not [2Fe-2S]2+ clusters, in reconstituted At ISCA1a/2. Anaerobically-reconstituted [4Fe-4S]2+ cluster-bound (thick blue lines) was monitored in 1 cm cuvettes by UV-visible absorption and CD for 180 min after exposure to air (thin gray lines). The final spectra recorded after 200 min is shown as thick red lines. The CD spectra only monitor oxygen-induced changes in the minority (20%) [2Fe-2S]2+ cluster-bound form of ISCA1a/2, since the majority (80%) [4Fe-4S]2+ cluster-bound form does not exhibit a significant CD spectrum. All ε and Δε values are based on ISCA1a/2 heterodimer concentration.
Figure 8
Figure 8
Comparison of the resonance Raman spectra of [2Fe-2S]2+ cluster-bound as-isolated At ISCA1a/2 (red line) and [4Fe-4S]2+ cluster-bound reconstituted At ISCA1a/2 (black line) using 458-nm laser excitation. The samples (~2 mM [2Fe-2S]2+ or [4Fe-4S]2+ clusters) in 100 mM Tris-HCl buffer at pH 7.8 were in the form of frozen droplets at 17 K. The spectra are the sum of 100 individual scans with each scan involving photon counting for 1 s at 0.5 cm−1 increments with 7 cm−1 spectral resolution. Bands due to lattice modes of the frozen buffer solution have been subtracted from both spectra.
Figure 9
Figure 9
Cluster transfer from At [2Fe-2S]2+-GRXS15 to At apo-ISCA1a/2 monitored by UV-visible absorption and CD spectroscopy as a function of time. (A) The thick red line is the CD spectrum of [2Fe-2S]2+ cluster-bound GRXS15 before addition of At apo-ISCA1a/2 to the reaction mixture. The thin grey lines are CD spectra of the reaction mixture, GRXS15 (60 μM in [2Fe-2S]2+ clusters) mixed with DTT-pretreated apo-ISCA1a/2 (30 μM) in 100 mM Tris-HCl, pH 7.8, with 1 mM GSH, recorded at 1, 3, 5, 17, 20, 25, 28, 30, and 34 min after addition of apo ISCA1a/2. The thick blue line corresponds to the final CD spectra after 60 min. The arrows indicate the direction of change in CD intensity with time at selected wavelengths and Δε values are based on the initial concentration of [2Fe-2S]2+ clusters in the reaction mixture. (B) The thick red line is the absorption spectrum of [2Fe-2S]2+ cluster-bound GRXS15 before addition of At apo-ISCA1a/2 to the reaction mixture. The thick blue line corresponds to the final absorption spectrum 60 min after addition of At apo-ISCA1a/2 to the reaction mixture. ε values are based on the initial concentration of [2Fe-2S]2+ clusters in the reaction mixture.
Figure 10
Figure 10
Summary scheme for cluster trafficking between GRXS15 and its partner proteins.

References

    1. Johnson D.C., Dean D.R., Smith A.D., Johnson M.K. Structure, function, and formation of biological iron-sulfur clusters. Annu. Rev. Biochem. 2005;74:247–281. doi: 10.1146/annurev.biochem.74.082803.133518. - DOI - PubMed
    1. Fuss J.O., Tsai C.L., Ishida J.P., Tainer J.A. Emerging critical roles of Fe-S clusters in DNA replication and repair. Biochim. Biophys. Acta. 2015;1853:1253–1271. doi: 10.1016/j.bbamcr.2015.01.018. - DOI - PMC - PubMed
    1. Crack J.C., Le Brun N.E. Redox-sensing iron-sulfur cluster regulators. Antioxid. Redox Signal. 2018;29:1809–1829. doi: 10.1089/ars.2017.7361. - DOI - PubMed
    1. Dong G., Witcher S., Outten F.W., Pilon M. The Suf system in Archaea, Bacteria, and Eukaryotic organelles. In: Johnson M.K., Scott R.A., editors. Encyclopedia of Inorganic and Bioinorganic Chemistry: Metalloprotein Site Assembly. John Wiley and Sons; Chichester, UK: 2017. pp. 37–52.
    1. Braymer J.J., Lill R. Iron-sulfur cluster biogenesis and trafficking in mitochondria. J. Biol. Chem. 2017;292:12754–12763. doi: 10.1074/jbc.R117.787101. - DOI - PMC - PubMed

MeSH terms

LinkOut - more resources