. 2020 Dec 7;20(1):1868.
doi: 10.1186/s12889-020-09972-z.

Hindsight is 2020 vision: a characterisation of the global response to the COVID-19 pandemic

Affiliations

Hindsight is 2020 vision: a characterisation of the global response to the COVID-19 pandemic

David J Warne et al. BMC Public Health. .

Abstract

Background: The global impact of COVID-19 and the country-specific responses to the pandemic provide an unparalleled opportunity to learn about different patterns of the outbreak and interventions. We model the global pattern of reported COVID-19 cases during the primary response period, with the aim of learning from the past to prepare for the future.

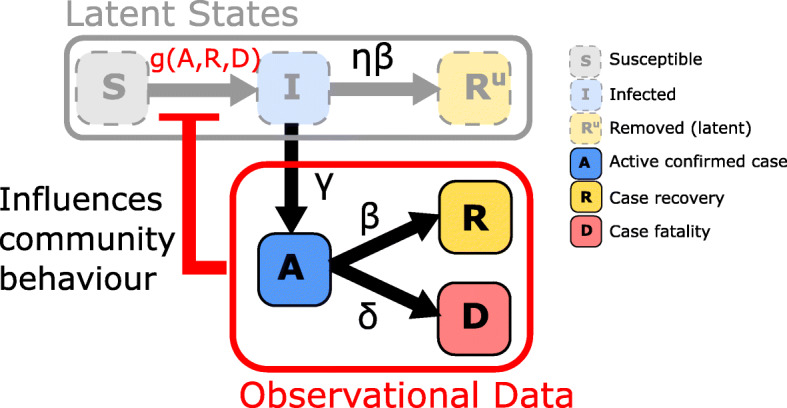
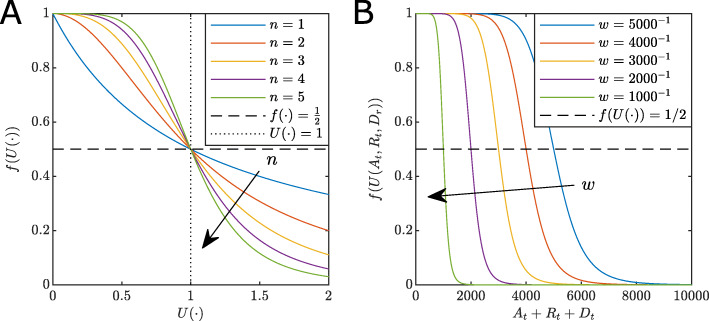
Methods: Using Bayesian methods, we analyse the response to the COVID-19 outbreak for 158 countries for the period 22 January to 9 June 2020. This encompasses the period in which many countries imposed a variety of response measures and initial relaxation strategies. Instead of modelling specific intervention types and timings for each country explicitly, we adopt a stochastic epidemiological model including a feedback mechanism on virus transmission to capture complex nonlinear dynamics arising from continuous changes in community behaviour in response to rising case numbers. We analyse the overall effect of interventions and community responses across diverse regions. This approach mitigates explicit consideration of issues such as period of infectivity and public adherence to government restrictions.

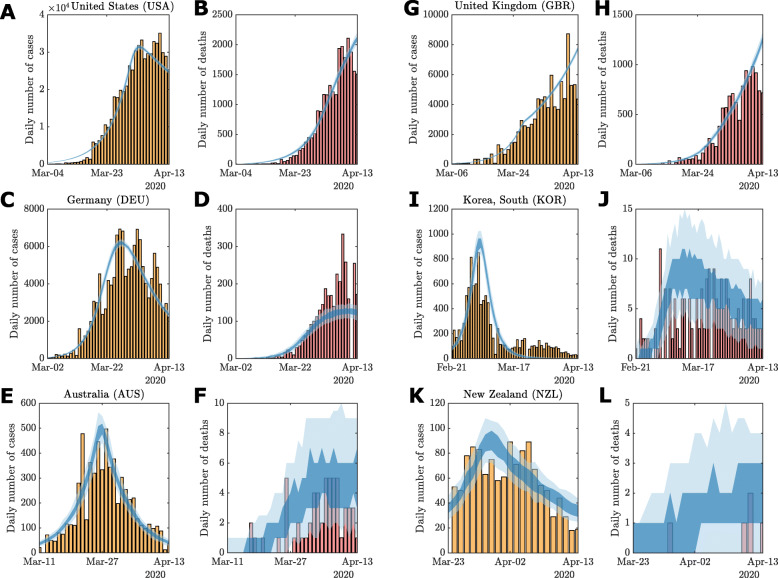
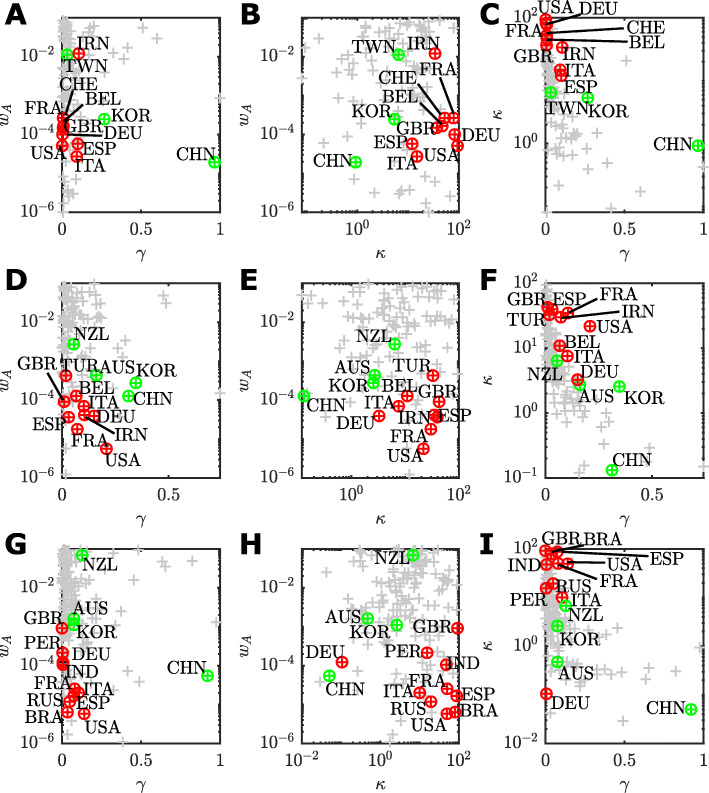
Results: Countries with the largest cumulative case tallies are characterised by a delayed response, whereas countries that avoid substantial community transmission during the period of study responded quickly. Countries that recovered rapidly also have a higher case identification rate and small numbers of undocumented community transmission at the early stages of the outbreak. We also demonstrate that uncertainty in numbers of undocumented infections dramatically impacts the risk of multiple waves. Our approach is also effective at pre-empting potential flare-ups.

Conclusions: We demonstrate the utility of modelling to interpret community behaviour in the early epidemic stages. Two lessons learnt that are important for the future are: i) countries that imposed strict containment measures early in the epidemic fared better with respect to numbers of reported cases; and ii) broader testing is required early in the epidemic to understand the magnitude of undocumented infections and recover rapidly. We conclude that clear patterns of containment are essential prior to relaxation of restrictions and show that modelling can provide insights to this end.

Keywords: Approximate Bayesian computation; COVID-19; SARS-CoV-2; Sequential Monte Carlo; Stochastic epidemiological models.


Conflict of interest statement

The authors declare that they have no competing interests.

Figures

Fig. 1
Fig. 1
Schematic of epidemic model including a regulatory mechanism inducing a feedback loop. State transitions are marked by arrows with superscripts indicating respective rate parameters. Here, observable quantities can inform individual behaviour to inhibit transmission in the latent SIR model
Fig. 2
Fig. 2
Effect of parameters on the response function. a The effect of the slope parameter n. Note, as n increases, the faster f(·)→0. For any n we have f(·)=1/2 (dashed black), at the point U(·)=1 (dotted black). b The effect of weights on the response function for the special case wA=wR=wD=w>0 for constant n=5. Note the point at which f(·)=1/2 corresponds to At+Rt+Dt=1/w. That is, as w increases the lower the number of cases are required to influence the community to reduce the spread
Fig. 3
Fig. 3
Examples of model fit using parameter point estimates: ab United States, cd Germany, ef Australia, gh United Kingdom, ij South Korea, and kl New Zealand. Vertical bars indicate daily reported cases (yellow) and deaths (red). The 50% (dark shaded region) and 95% credible intervals (light shaded region) of the posterior predictive distributions are plotted against the observational data. Credible intervals are computed using n=100 stochastic simulations for the given point estimate. Full posterior predictive distributions are presented in the Supplementary Material
Fig. 4
Fig. 4
Pairwise scatter plots of point estimates of each assessed country (grey points) for the key parameters related to the management of an COVID-19 outbreak up to: ac 30 March; df 13 April; and gi 9 June. a,d,g wA versus γ; b,e,h wA versus γ; and c,f,i κ versus γ. For each time period, countries with the ten largest confirmed case counts are highlighted (red points) along with representative countries that were recovering or managed to control the outbreak (green). Labels identify the country by ISO-3166 alpha-3 code
Fig. 5
Fig. 5
Distributions of model parameter point estimates along with observered cumulative confirmed cases CT, recoveries RT and deaths DT at T= 13 April. Pairwise scatter plots on the lower diagonal indicate the stage of the COVID-19 outbreak for that country: growth stage (red circles), post-peak stage (purple triangles), or recovery stage (green squares). Histograms on the diagonal show the distribution of parameters across all countries within each outbreak stage. Spearman correlation coefficients between each point estimate and observed case numbers with the sign and strength of the correlation indicated by the colour-map (positive correlations in red and negative correlations in blue)
Fig. 6
Fig. 6
Example of small secondary oscillations in model behaviour using the model fit against daily case data (yellow bars) for a Australia and b South Korea up to 9 June (dashed line). The posterior predictive simulations are continues up to 24 June to demonstrate the uncertainty in potential case increases after relaxation of restrictions. Actual daily case numbers for the period 10–24 June (red bars) also demonstrate increases within the credible intervals (dark blue 50% CrI; light blue 95% CrI)

Similar articles

Cited by

References

    1. Johns Hopkins Univeristy. Coronavirus resource center. https://coronavirus.jhu.edu/. Accessed 25 July 2020.
    1. Ritchie H, Ortiz-Ospina E, Roser M, Hasell J. COVID-19 deaths and cases: how do sources compare? Our World in Data. 2020. https://ourworldindata.org/covid-sources-comparison. Accessed 10 June 2020.
    1. European Centre for Disease Prevention and Control. COVID-19. https://qap.ecdc.europa.eu/public/extensions/COVID-19/COVID-19.html. Accessed 10 July 2020.
    1. Cohen J, Kupferschmidt K. Countries test tactics in ‘war’ against COVID-19. Science. 2020;367(6484):1287–8. doi: 10.1126/science.367.6484.1287. - DOI - PubMed
    1. Lai S, Ruktanonchai NW, Zhou L, Prosper O, Luo W, Floyd JR, Wesolowski A, Santillana M, Zhang C, Du X, Yu H, Tatem AJ. Effect of non-pharmaceutical interventions to contain COVID-19 in China. Nature. 2020;585(7825):410–3. doi: 10.1038/s41586-020-2293-x. - DOI - PMC - PubMed