

Development of a data-driven COVID-19 prognostication tool to inform triage and step-down care for hospitalised patients in Hong Kong: a population-based cohort study
- PMID: 33287804
- PMCID: PMC7719738
- DOI: 10.1186/s12911-020-01338-0
Development of a data-driven COVID-19 prognostication tool to inform triage and step-down care for hospitalised patients in Hong Kong: a population-based cohort study
Abstract
Background: This is the first study on prognostication in an entire cohort of laboratory-confirmed COVID-19 patients in the city of Hong Kong. Prognostic tool is essential in the contingency response for the next wave of outbreak. This study aims to develop prognostic models to predict COVID-19 patients' clinical outcome on day 1 and day 5 of hospital admission.
Methods: We did a retrospective analysis of a complete cohort of 1037 COVID-19 laboratory-confirmed patients in Hong Kong as of 30 April 2020, who were admitted to 16 public hospitals with their data sourced from an integrated electronic health records system. It covered demographic information, chronic disease(s) history, presenting symptoms as well as the worst clinical condition status, biomarkers' readings and Ct value of PCR tests on Day-1 and Day-5 of admission. The study subjects were randomly split into training and testing datasets in a 8:2 ratio. Extreme Gradient Boosting (XGBoost) model was used to classify the training data into three disease severity groups on Day-1 and Day-5.
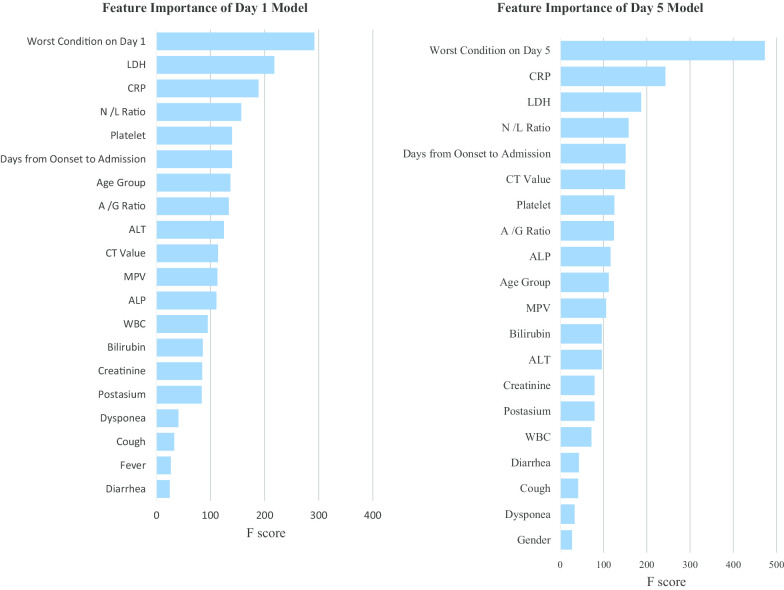
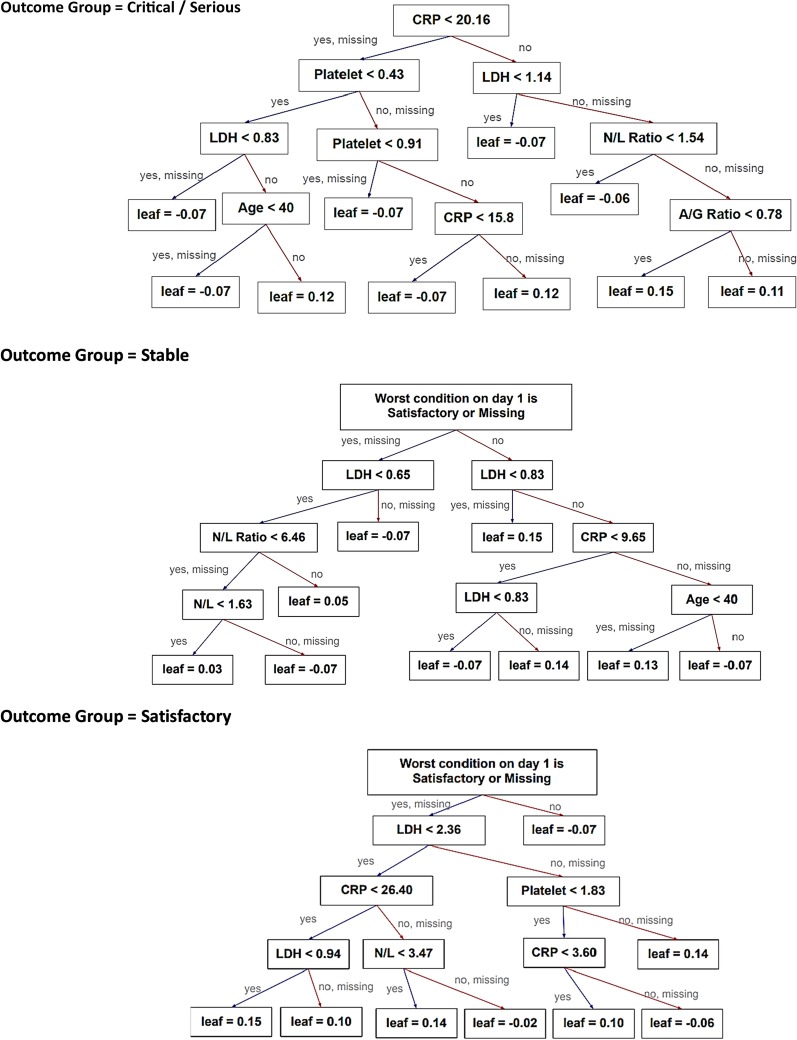
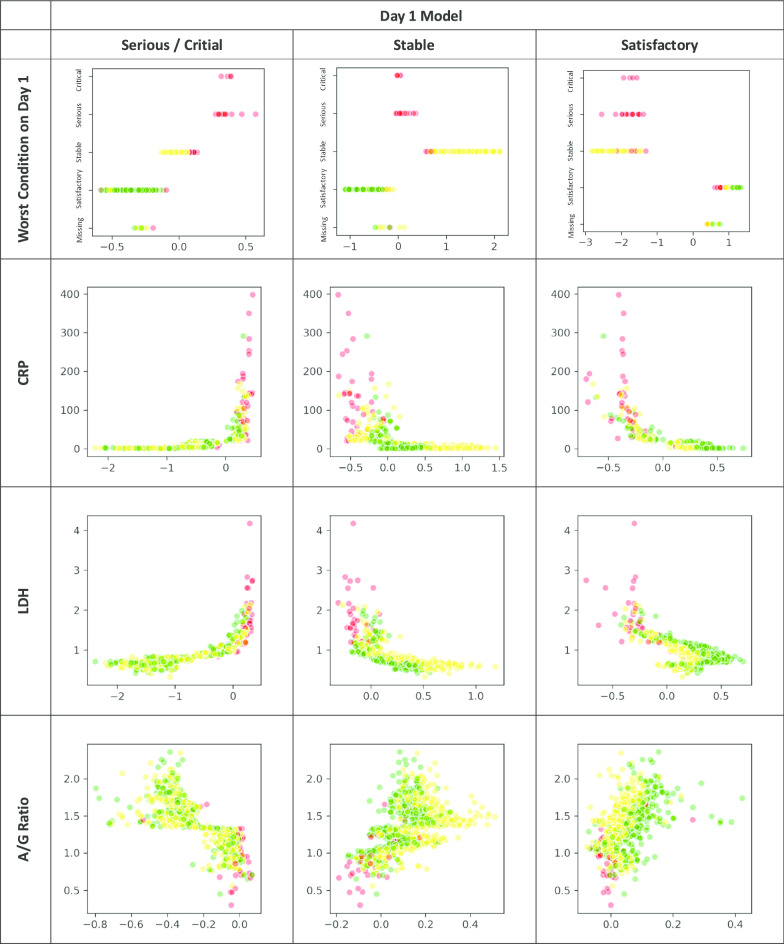
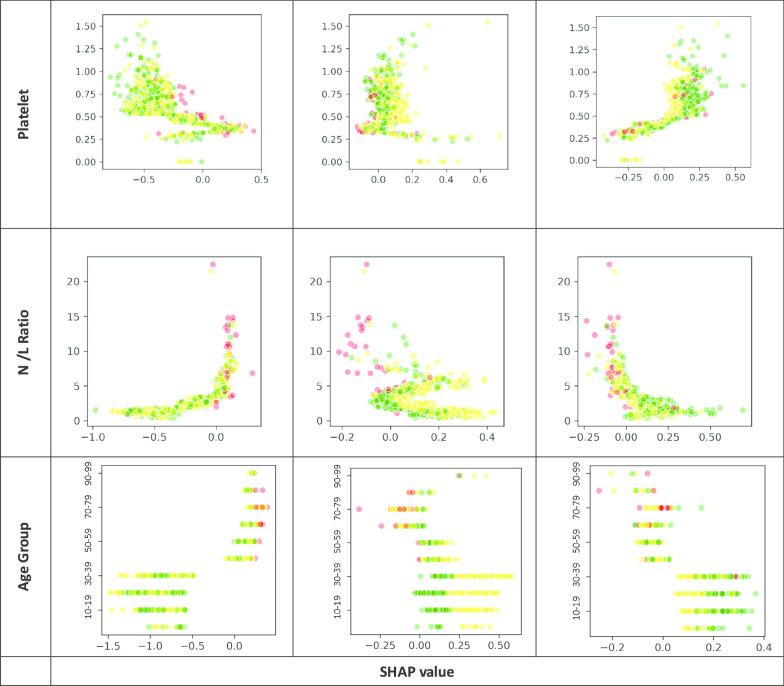
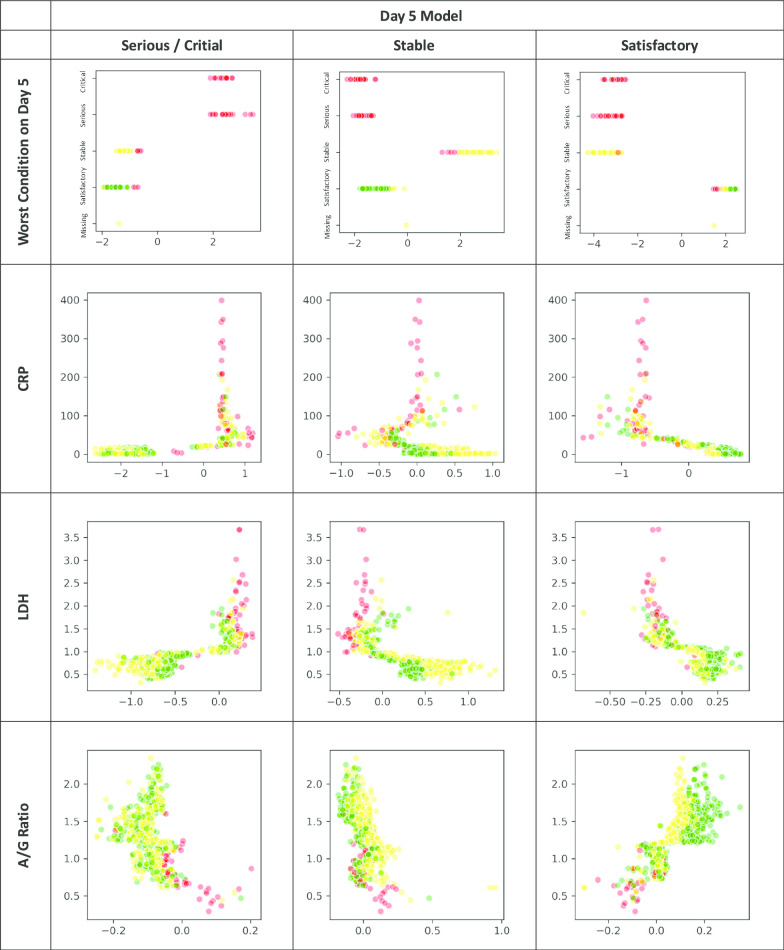
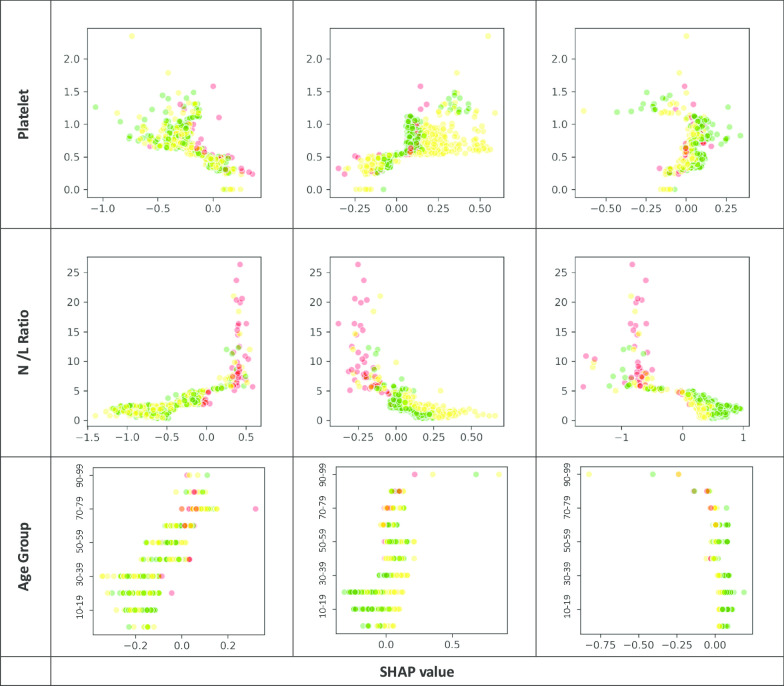
Results: The 1037 patients had a mean age of 37.8 (SD ± 17.8), 53.8% of them were male. They were grouped under three disease outcome: 4.8% critical/serious, 46.8% stable and 48.4% satisfactory. Under the full models, 30 indicators on Day-1 and Day-5 were used to predict the patients' disease outcome and achieved an accuracy rate of 92.3% and 99.5%. With a trade-off between practical application and predictive accuracy, the full models were reduced into simpler models with seven common specific predictors, including the worst clinical condition status (4-level), age group, and five biomarkers, namely, CRP, LDH, platelet, neutrophil/lymphocyte ratio and albumin/globulin ratio. Day-1 model's accuracy rate, macro-/micro-averaged sensitivity and specificity were 91.3%, 84.9%/91.3% and 96.0%/95.7% respectively, as compared to 94.2%, 95.9%/94.2% and 97.8%/97.1% under Day-5 model.
Conclusions: Both Day-1 and Day-5 models can accurately predict the disease severity. Relevant clinical management could be planned according to the predicted patients' outcome. The model is transformed into a simple online calculator to provide convenient clinical reference tools at the point of care, with an aim to inform clinical decision on triage and step-down care.
Keywords: COVID-19; Clinical outcome; Disease severity; Prediction; Prognostic; Step-down care; Triage.
Conflict of interest statement
The authors declare that they have no competing interests.
Figures
References
-
- WHO Coronavirus Disease (COVID-19) Dashboard. World Health Organization. 2020. https://covid19.who.int/. Accessed 20 May 2020.
-
- Latest situation of cases of COVID-19 (as of 11 May 2020). Centre for Health Protection, HKSAR. 2020. https://www.coronavirus.gov.hk/eng/index.html. Accessed 20 May 2020.
-
- Countries by density 2020. World population review. 2020. https://worldpopulationreview.com/countries/countries-by-density/. Accessed 20 May 2020.
-
- Introduction. Hospital Authority, HKSAR. 2020. https://www.ha.org.hk/visitor/ha_visitor_index.asp?Content_ID=10008&Lang.... Accessed 20 May 2020.
MeSH terms
LinkOut - more resources
Full Text Sources
Medical
Research Materials
Miscellaneous
