. 2020 Dec 7;18(1):191.
doi: 10.1186/s12915-020-00901-5.

Sphenodontian phylogeny and the impact of model choice in Bayesian morphological clock estimates of divergence times and evolutionary rates

Affiliations

Sphenodontian phylogeny and the impact of model choice in Bayesian morphological clock estimates of divergence times and evolutionary rates

Tiago R Simões et al. BMC Biol. .

Abstract

Background: The vast majority of all life that ever existed on earth is now extinct and several aspects of their evolutionary history can only be assessed by using morphological data from the fossil record. Sphenodontian reptiles are a classic example, having an evolutionary history of at least 230 million years, but currently represented by a single living species (Sphenodon punctatus). Hence, it is imperative to improve the development and implementation of probabilistic models to estimate evolutionary trees from morphological data (e.g., morphological clocks), which has direct benefits to understanding relationships and evolutionary patterns for both fossil and living species. However, the impact of model choice on morphology-only datasets has been poorly explored.

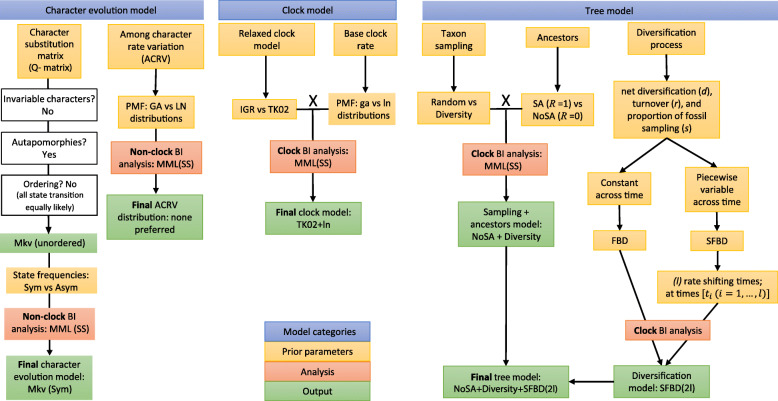
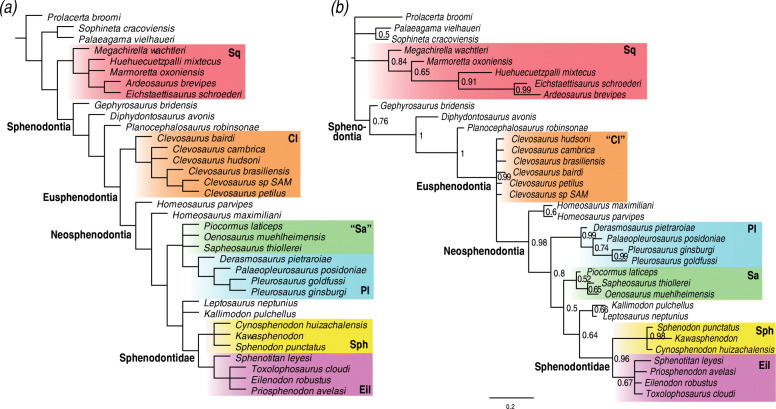
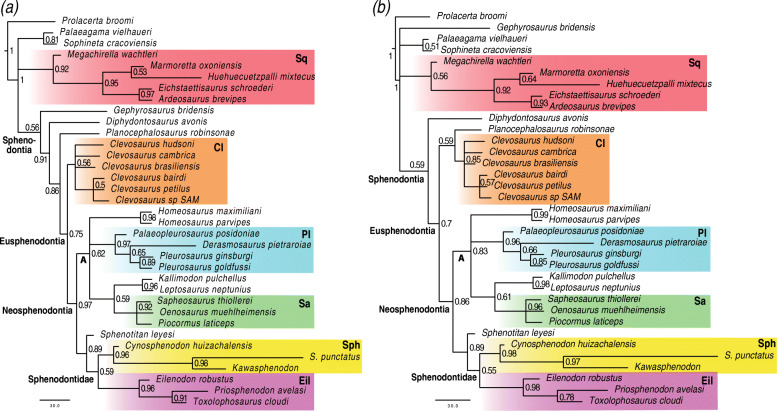
Results: Here, we investigate the impact of a wide array of model choices on the inference of evolutionary trees and macroevolutionary parameters (divergence times and evolutionary rates) using a new data matrix on sphenodontian reptiles. Specifically, we tested different clock models, clock partitioning, taxon sampling strategies, sampling for ancestors, and variations on the fossilized birth-death (FBD) tree model parameters through time. We find a strong impact on divergence times and background evolutionary rates when applying widely utilized approaches, such as allowing for ancestors in the tree and the inappropriate assumption of diversification parameters being constant through time. We compare those results with previous studies on the impact of model choice to molecular data analysis and provide suggestions for improving the implementation of morphological clocks. Optimal model combinations find the radiation of most major lineages of sphenodontians to be in the Triassic and a gradual but continuous drop in morphological rates of evolution across distinct regions of the phenotype throughout the history of the group.

Conclusions: We provide a new hypothesis of sphenodontian classification, along with detailed macroevolutionary patterns in the evolutionary history of the group. Importantly, we provide suggestions to avoid overestimated divergence times and biased parameter estimates using morphological clocks. Partitioning relaxed clocks offers methodological limitations, but those can be at least partially circumvented to reveal a detailed assessment of rates of evolution across the phenotype and tests of evolutionary mosaicism.

Keywords: Bayesian inference; Divergence times; Evolutionary rates; Macroevolution; Morphological clocks; Phylogenetics; Prior models; Sphenodon; Sphenodontians; “Living fossil”.


Conflict of interest statement

The authors declare that they have no competing interests.

Figures

Fig. 1
Fig. 1
Summary of models and parameters available for morphological characters that were tested and implemented herein. ACRV, among character rate variation; Asym, asymmetric state frequencies; BI, Bayesian inference; FBD, fossilized birth-death model; GA or ga, Gamma distribution; IGR (independent gamma rates uncorrelated clock model); LN or ln, lognormal distribution MML (SS), marginal model likelihoods (using the stepping-stone procedure); NoSA, no sampling of ancestors; PMF, probability mass function; SA, sampling of ancestors; SFBD, skyline fossilized birth-death model; Sym, symmetric state frequencies; TK02 (Thorne and Kishino continuous autocorrelated clock model). See the “Methods” section for additional details and explanation for different models
Fig. 2
Fig. 2
Maximum parsimony and non-clock Bayesian phylogenetic analyses. a Strict consensus of 12 trees (274 steps each) under equal weights maximum parsimony (same result as implied weighting maximum parsimony—see Suppl. Data). b MRC tree from non-clock Bayesian inference analysis. Node numbers indicate posterior probabilities. Cl, Clevosauridae; Eil, Eilenodontinae; Pl, Pleurosauridae; Sa, Saphaeosauridae; Sph, Sphenodontinae; Sq, Squamata
Fig. 3
Fig. 3
Relaxed morphological clock Bayesian inference with a single morphological clock partition. a MRC tree using the uncorrelated clock model. b MRC tree using the best fit continuous autocorrelated clock model. Node numbers indicate posterior probabilities. A, unnamed clade A; Cl, Clevosauridae; Eil, Eilenodontinae; Pl, Pleurosauridae; Sa, Saphaeosauridae; Sph, Sphenodontinae; Sq, Squamata
Fig. 4
Fig. 4
Density tree contrasting divergence times under distinct clock and tree models (single morphological clock). Each tree represents the maximum compatibility tree and median divergence times obtained from each model combination. The greatest disparity of divergence time variation given model choice is observed on nodes closer to the root. Sampling for ancestors (blue) yields much older age estimates for the root and most other nodes compared to not sampling for ancestors, regardless of the clock model. When not sampling for ancestors, the uncorrelated clock model (red) results in relatively older divergence times compared to the best fit autocorrelated clock model (green) in nodes closer to the root, but slightly younger on nodes closer to the tips. The SFBD tree model (purple) further reduces divergence times compared to the simpler FBD tree model when using the best fit autocorrelated clock model. Orange bars indicate range between maximum and minimum divergence times for each model combination and orange circles represent the midpoint between these respective maximum and minimum divergence times. Div, diversity sampling with fossils as tips or ancestors; FBD, fossilized birth-death tree model with constant perimeter rates across time; IGR, independent gamma rates uncorrelated clock model; NoSA diversity, diversity sampling with fossils as tips only; SFBD(s)2 l, skyline FBD tree model with one rate shift point for the relative fossilization parameter; TK02, continuous autocorrelated clock model
Fig. 5
Fig. 5
Linear regression between divergence time and evolutionary rate parameters. Data obtained from MCT trees under different tree model, clock model, and sampling strategies with a single morphological clock partition. ac Precision around individual node divergence time estimates, based on 95% highest posterior density (HPD) ranges against median divergence times. df Median relative evolutionary rates against median divergence times. gi Precision around individual node relative evolutionary rate estimates, based on 95% HPD ranges against median divergence times. Abbreviations: See Fig. 4 and “Methods” for model abbreviations
Fig. 6
Fig. 6
Tree with the best performing model combination with a single morphological clock partition. Model combination: autocorrelated clock + no sampling of ancestors + maximizing diversity + two-time-slices skyline FBD. a median ages and 95% highest posterior density (HPD) intervals (red bars) for divergence times. Estimated median ages for the tips are in Additional file 6 and will be omitted for simplicity. b Overall relative rates of morphological evolution. Branch colors and values indicate relative evolutionary rates. C, Cisuralian; E, Early; Eo, Eocene; G, Guadalupian; L, Late; Lo, Lopingian; M, Middle; Mc, Miocene; N, Neogene; O, Oligocene; Pa, Paleocene; S.p., Sphenodon punctatus
Fig. 7
Fig. 7
Relative rates of morphological evolution for each morphological clock partition. Rates extracted from the tree with the best performing model combination under multiple partitioned morphological clocks: autocorrelated clock + no sampling of ancestors + maximizing diversity + two-time-slices skyline FBD + truncated normal prior on the root age. Branch colors and values indicate relative evolutionary rates. a Rates of evolution for skull characters. b Rates of evolution for mandibular and dental characters. c Rates of evolution for postcranial characters. d Linear regression between skull and mandibles+dentition evolutionary rates. e Linear regression between skull and postcranial evolutionary rates. f Linear regression between mandible+dentition and postcranial evolutionary rates

References

    1. Novacek M, Wheeler Q. Extinct taxa: accounting for 99.999% of the earth’s biota. In: Novacek M, Wheeler Q, editors. Extinction and phylogeny. New York: Columbia University Press; 1992.
    1. Luo A, Duchêne DA, Zhang C, Zhu C-D, Ho SYW. A simulation-based evaluation of tip-dating under the fossilized birth–death process. Syst Biol. 2020;69(2):325–344. - PMC - PubMed
    1. Guillerme T, Cooper N. Effects of missing data on topological inference using a total evidence approach. Mol Phylogen Evol. 2016;94(Part A):146–158. - PubMed
    1. Yang Z. Molecular evolution: a statistical approach: Oxford University press. 2014.
    1. Lemey P, Salemi M, Vandamme A-M. The phylogenetic handbook: a practical approach to DNA and protein phylogeny. 2. Cambridge: Cambridge University Press; 2009.

Publication types

LinkOut - more resources