. 2021 Jan;32(1):99-114.
doi: 10.1681/ASN.2020050698. Epub 2020 Dec 7.

Humanized C3 Mouse: A Novel Accelerated Model of C3 Glomerulopathy

Affiliations

Humanized C3 Mouse: A Novel Accelerated Model of C3 Glomerulopathy

Kishor Devalaraja-Narashimha et al. J Am Soc Nephrol. 2021 Jan.

Abstract

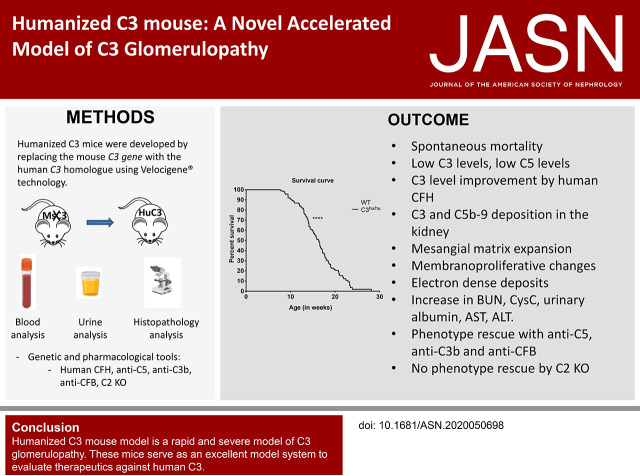
Background: C3 glomerulopathy (C3G) is characterized by the alternative-pathway (AP) hyperactivation induced by nephritic factors or complement gene mutations. Mice deficient in complement factor H (CFH) are a classic C3G model, with kidney disease that requires several months to progress to renal failure. Novel C3G models can further contribute to understanding the mechanism behind this disease and developing therapeutic approaches.

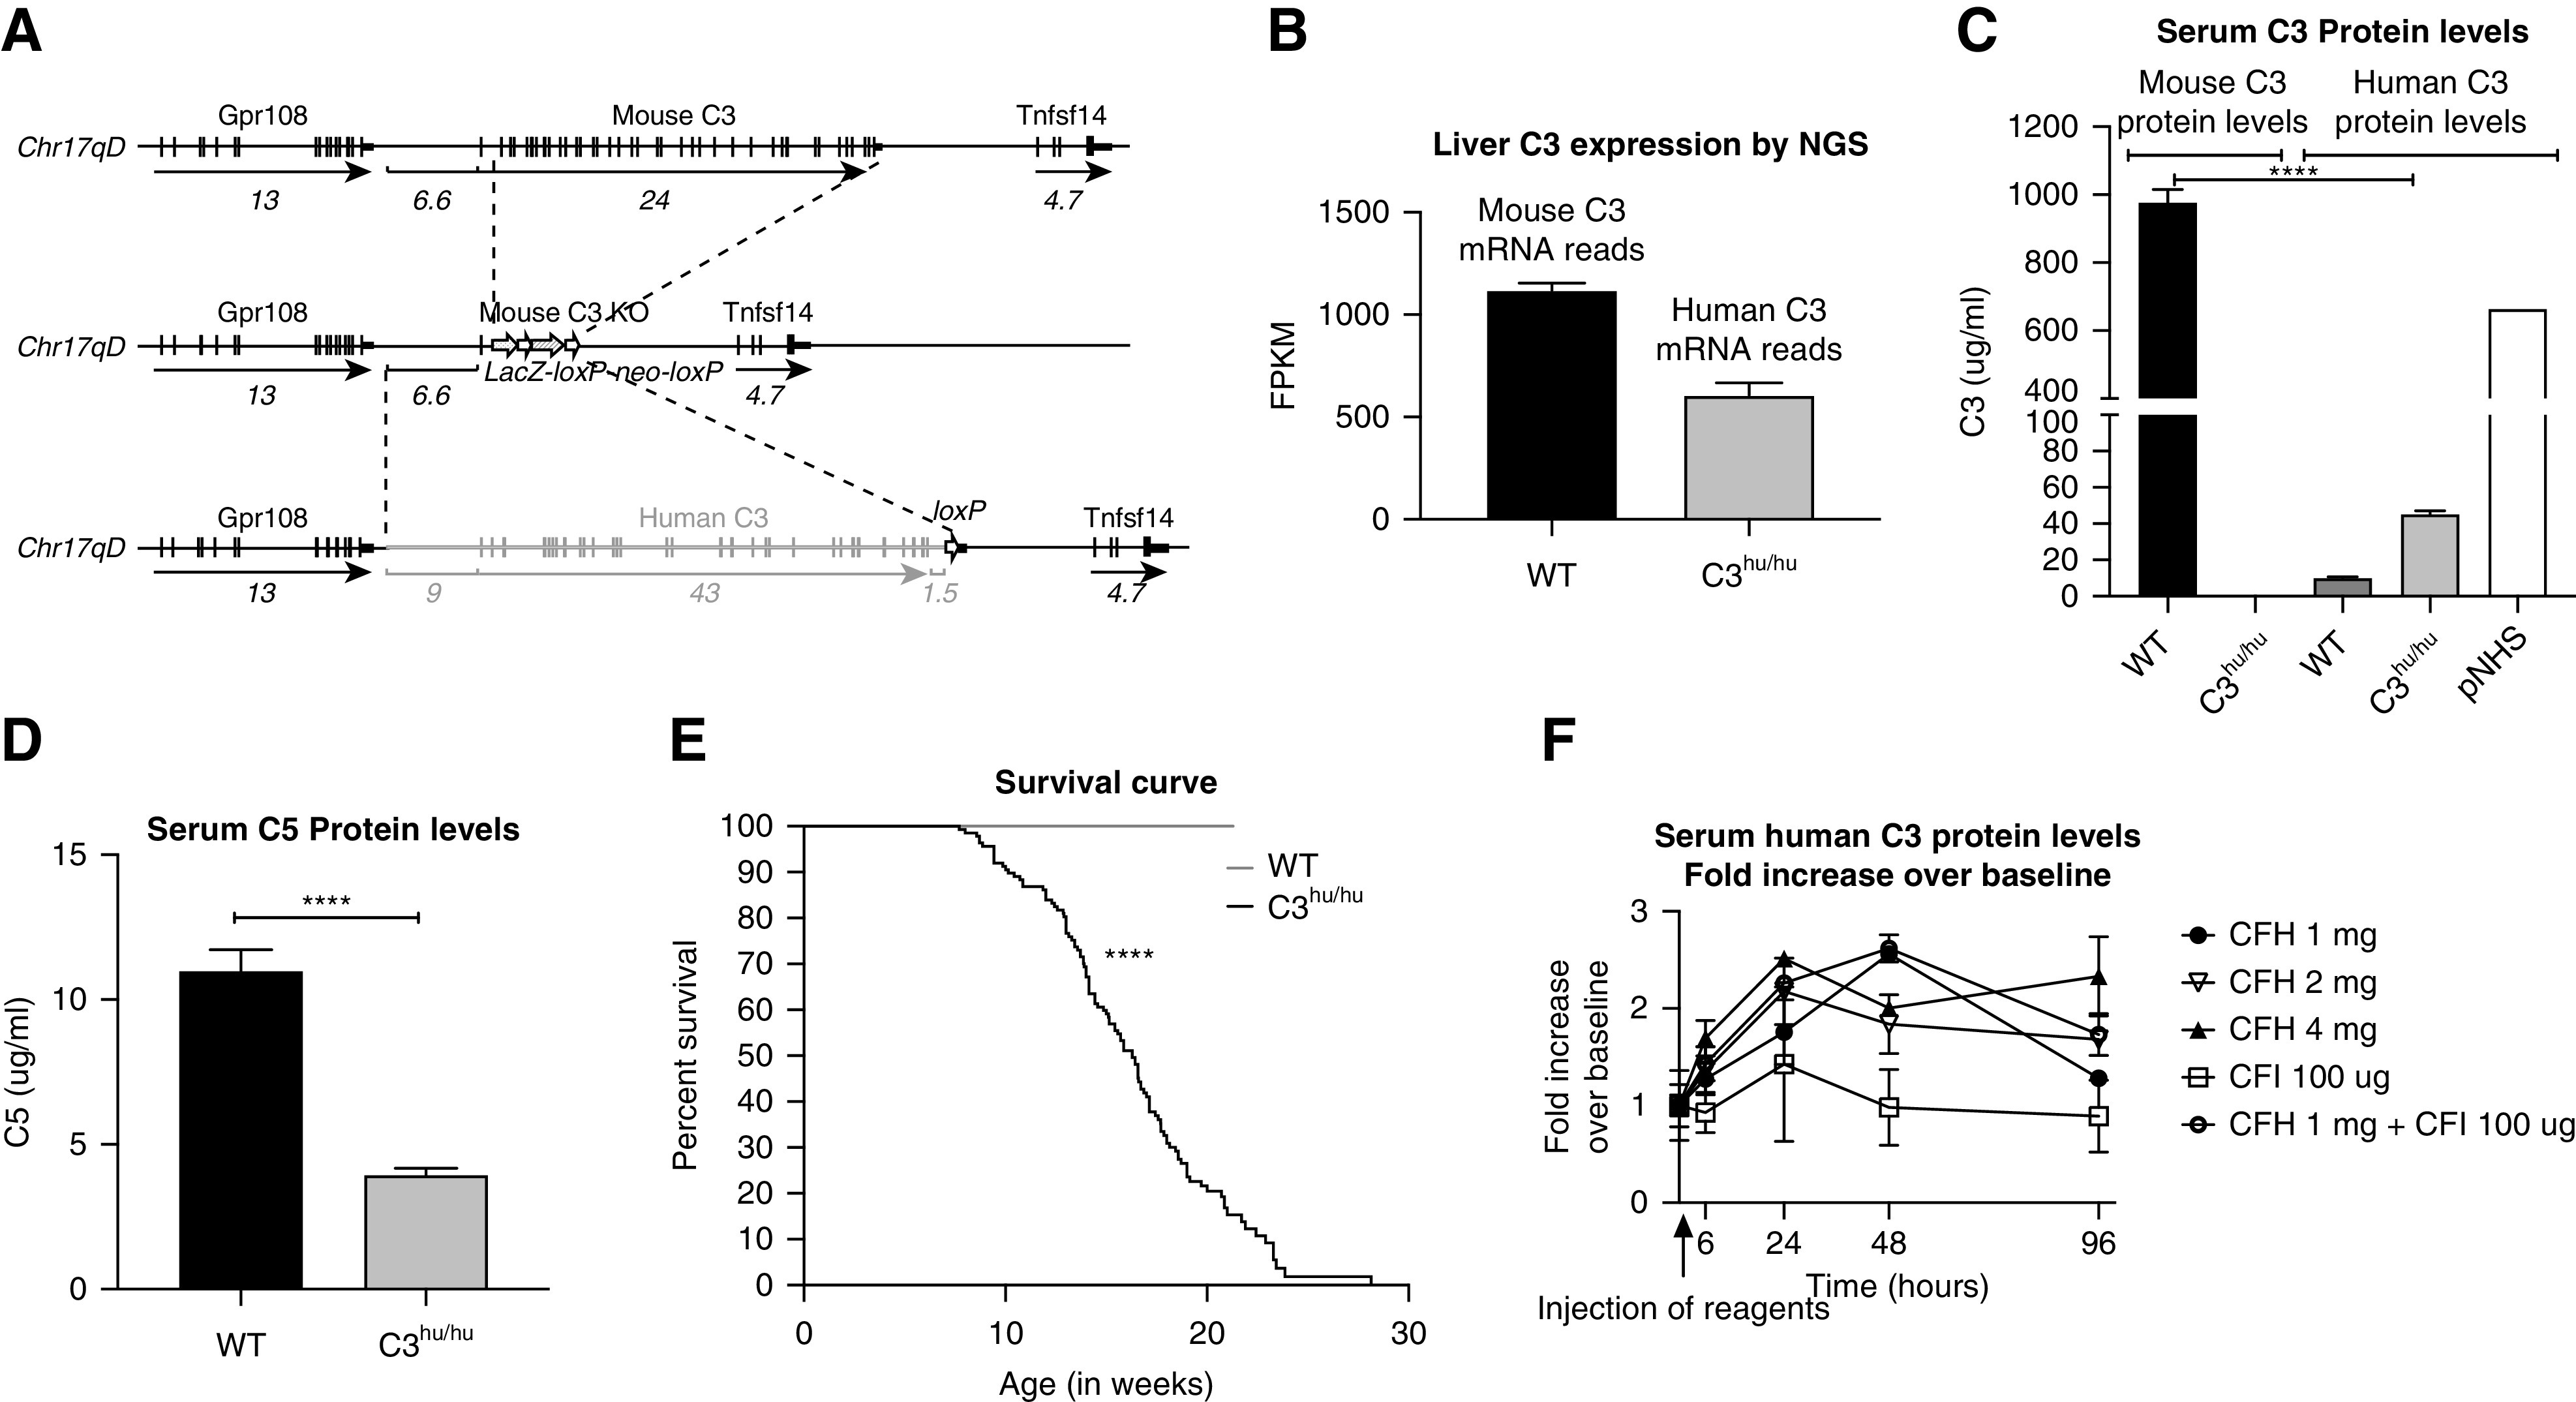
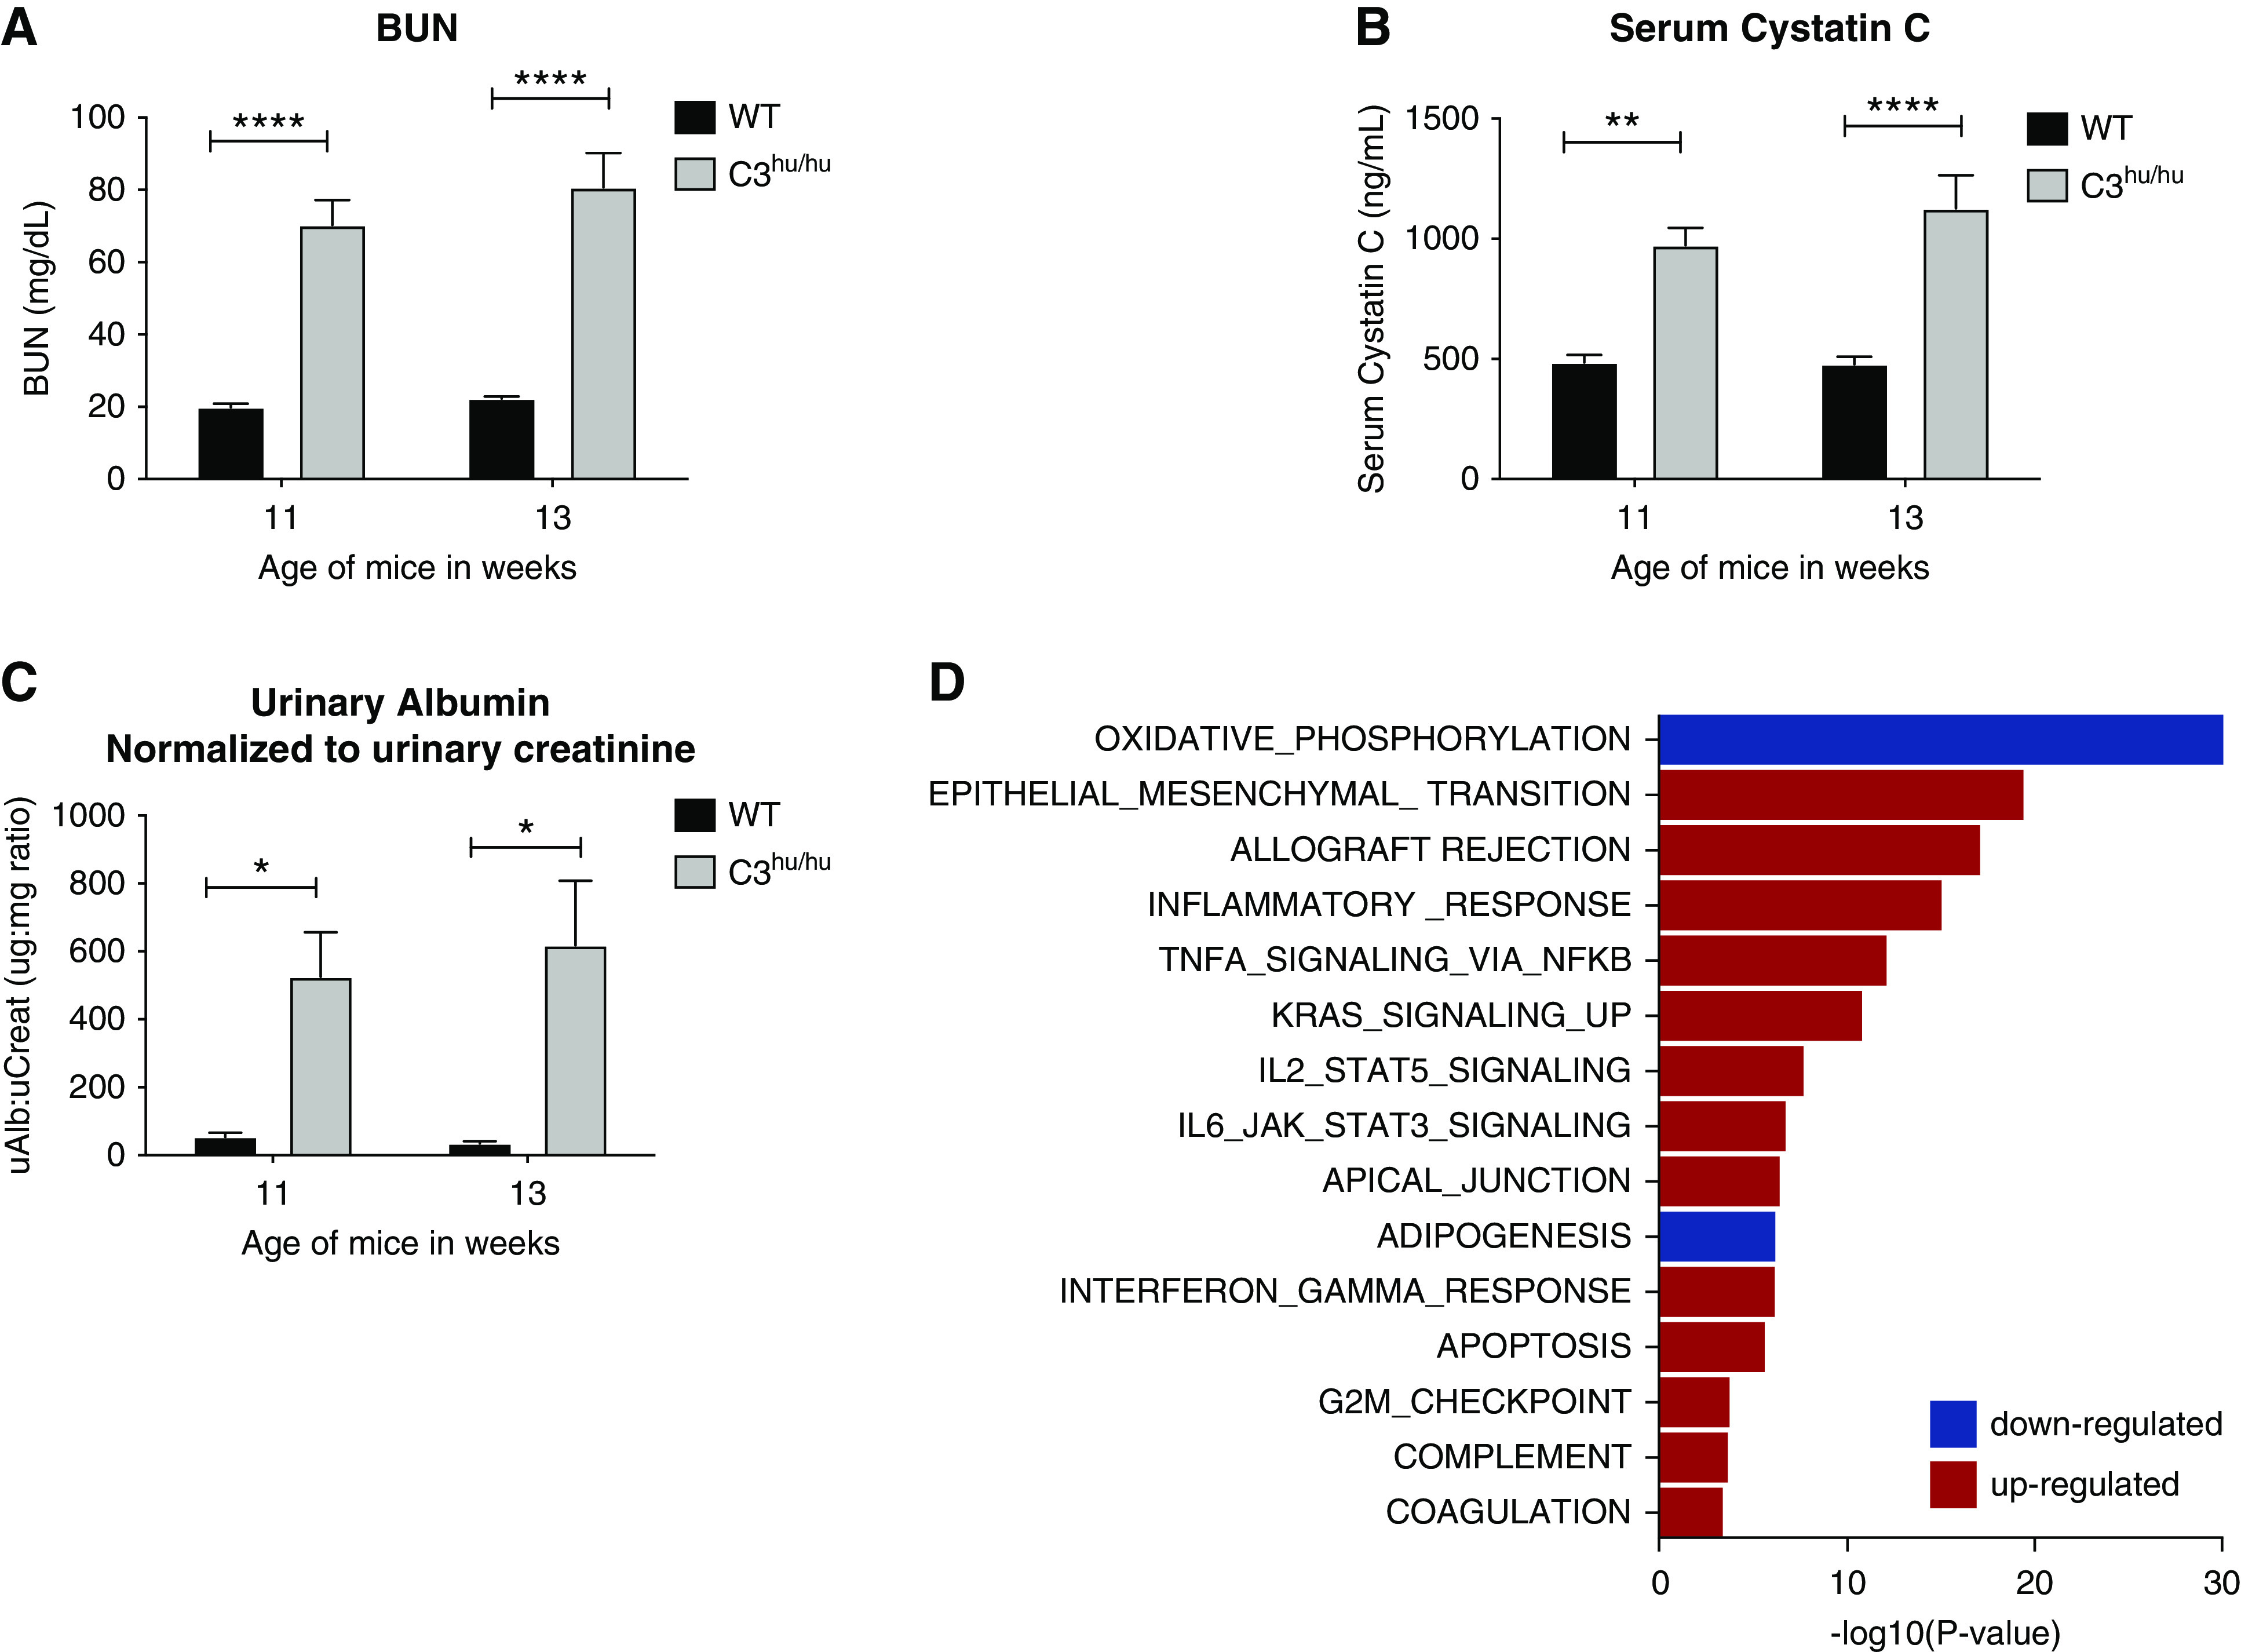
Methods: A novel, rapidly progressing, severe, murine model of C3G was developed by replacing the mouse C3 gene with the human C3 homolog using VelociGene technology. Functional, histologic, molecular, and pharmacologic assays characterize the presentation of renal disease and enable useful pharmacologic interventions in the humanized C3 (C3hu/hu) mice.

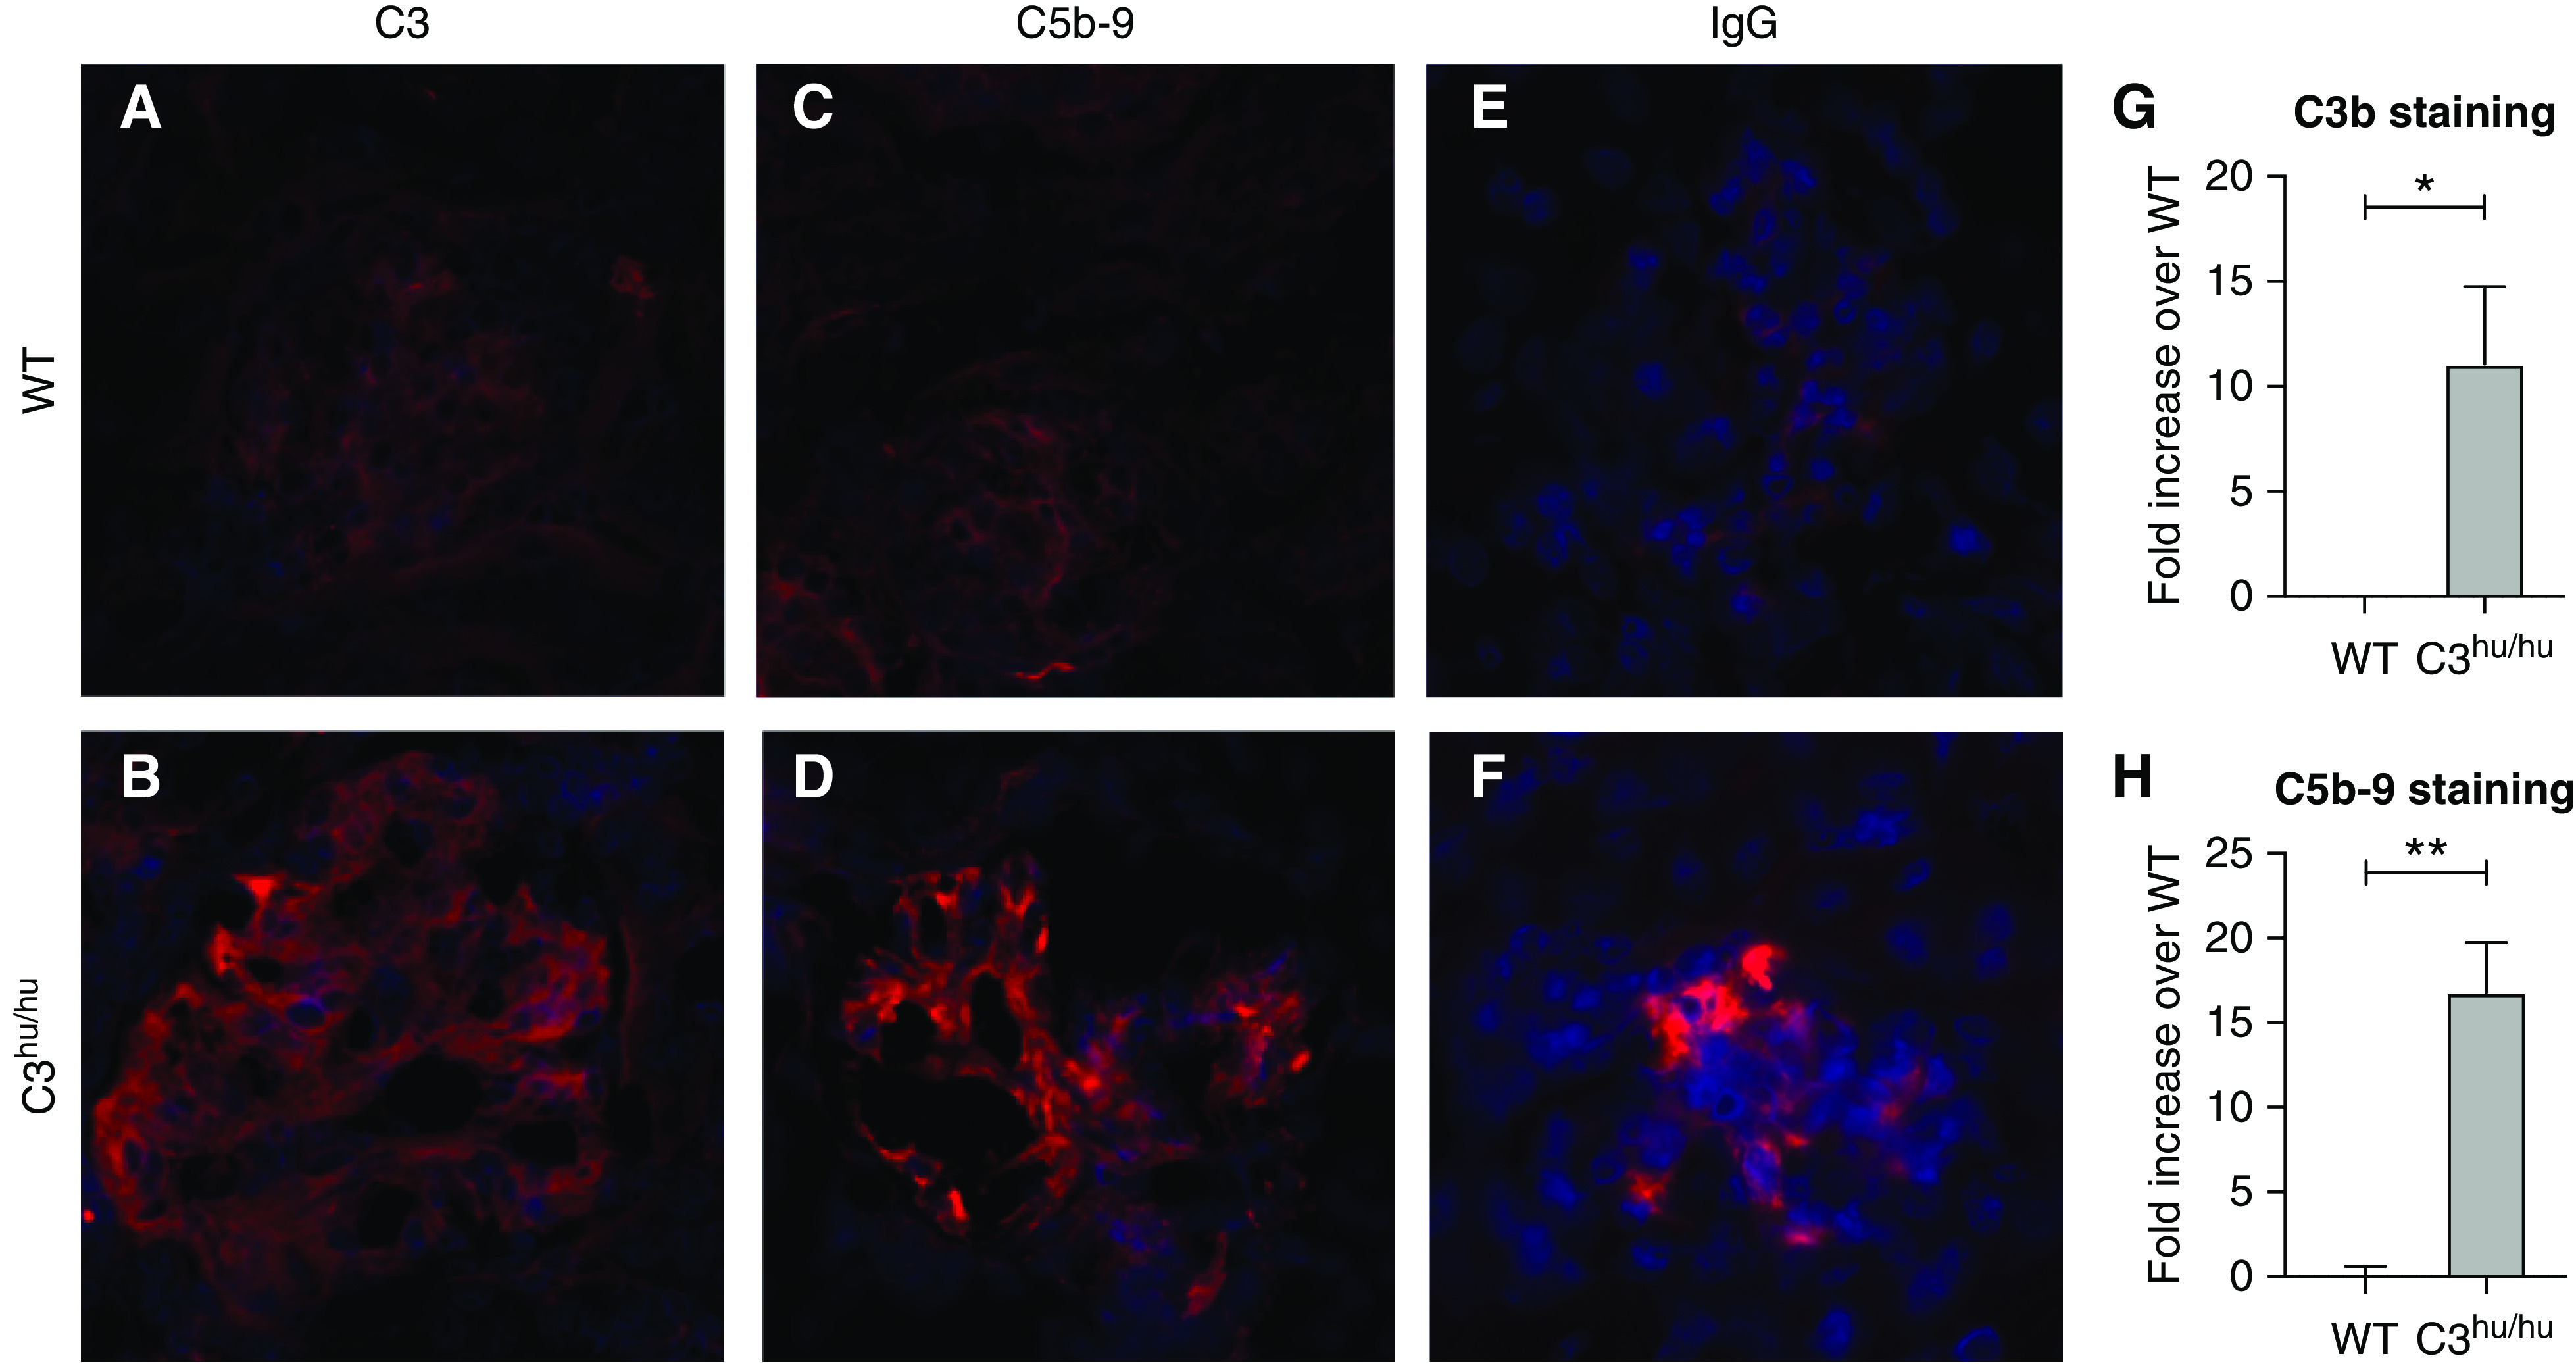
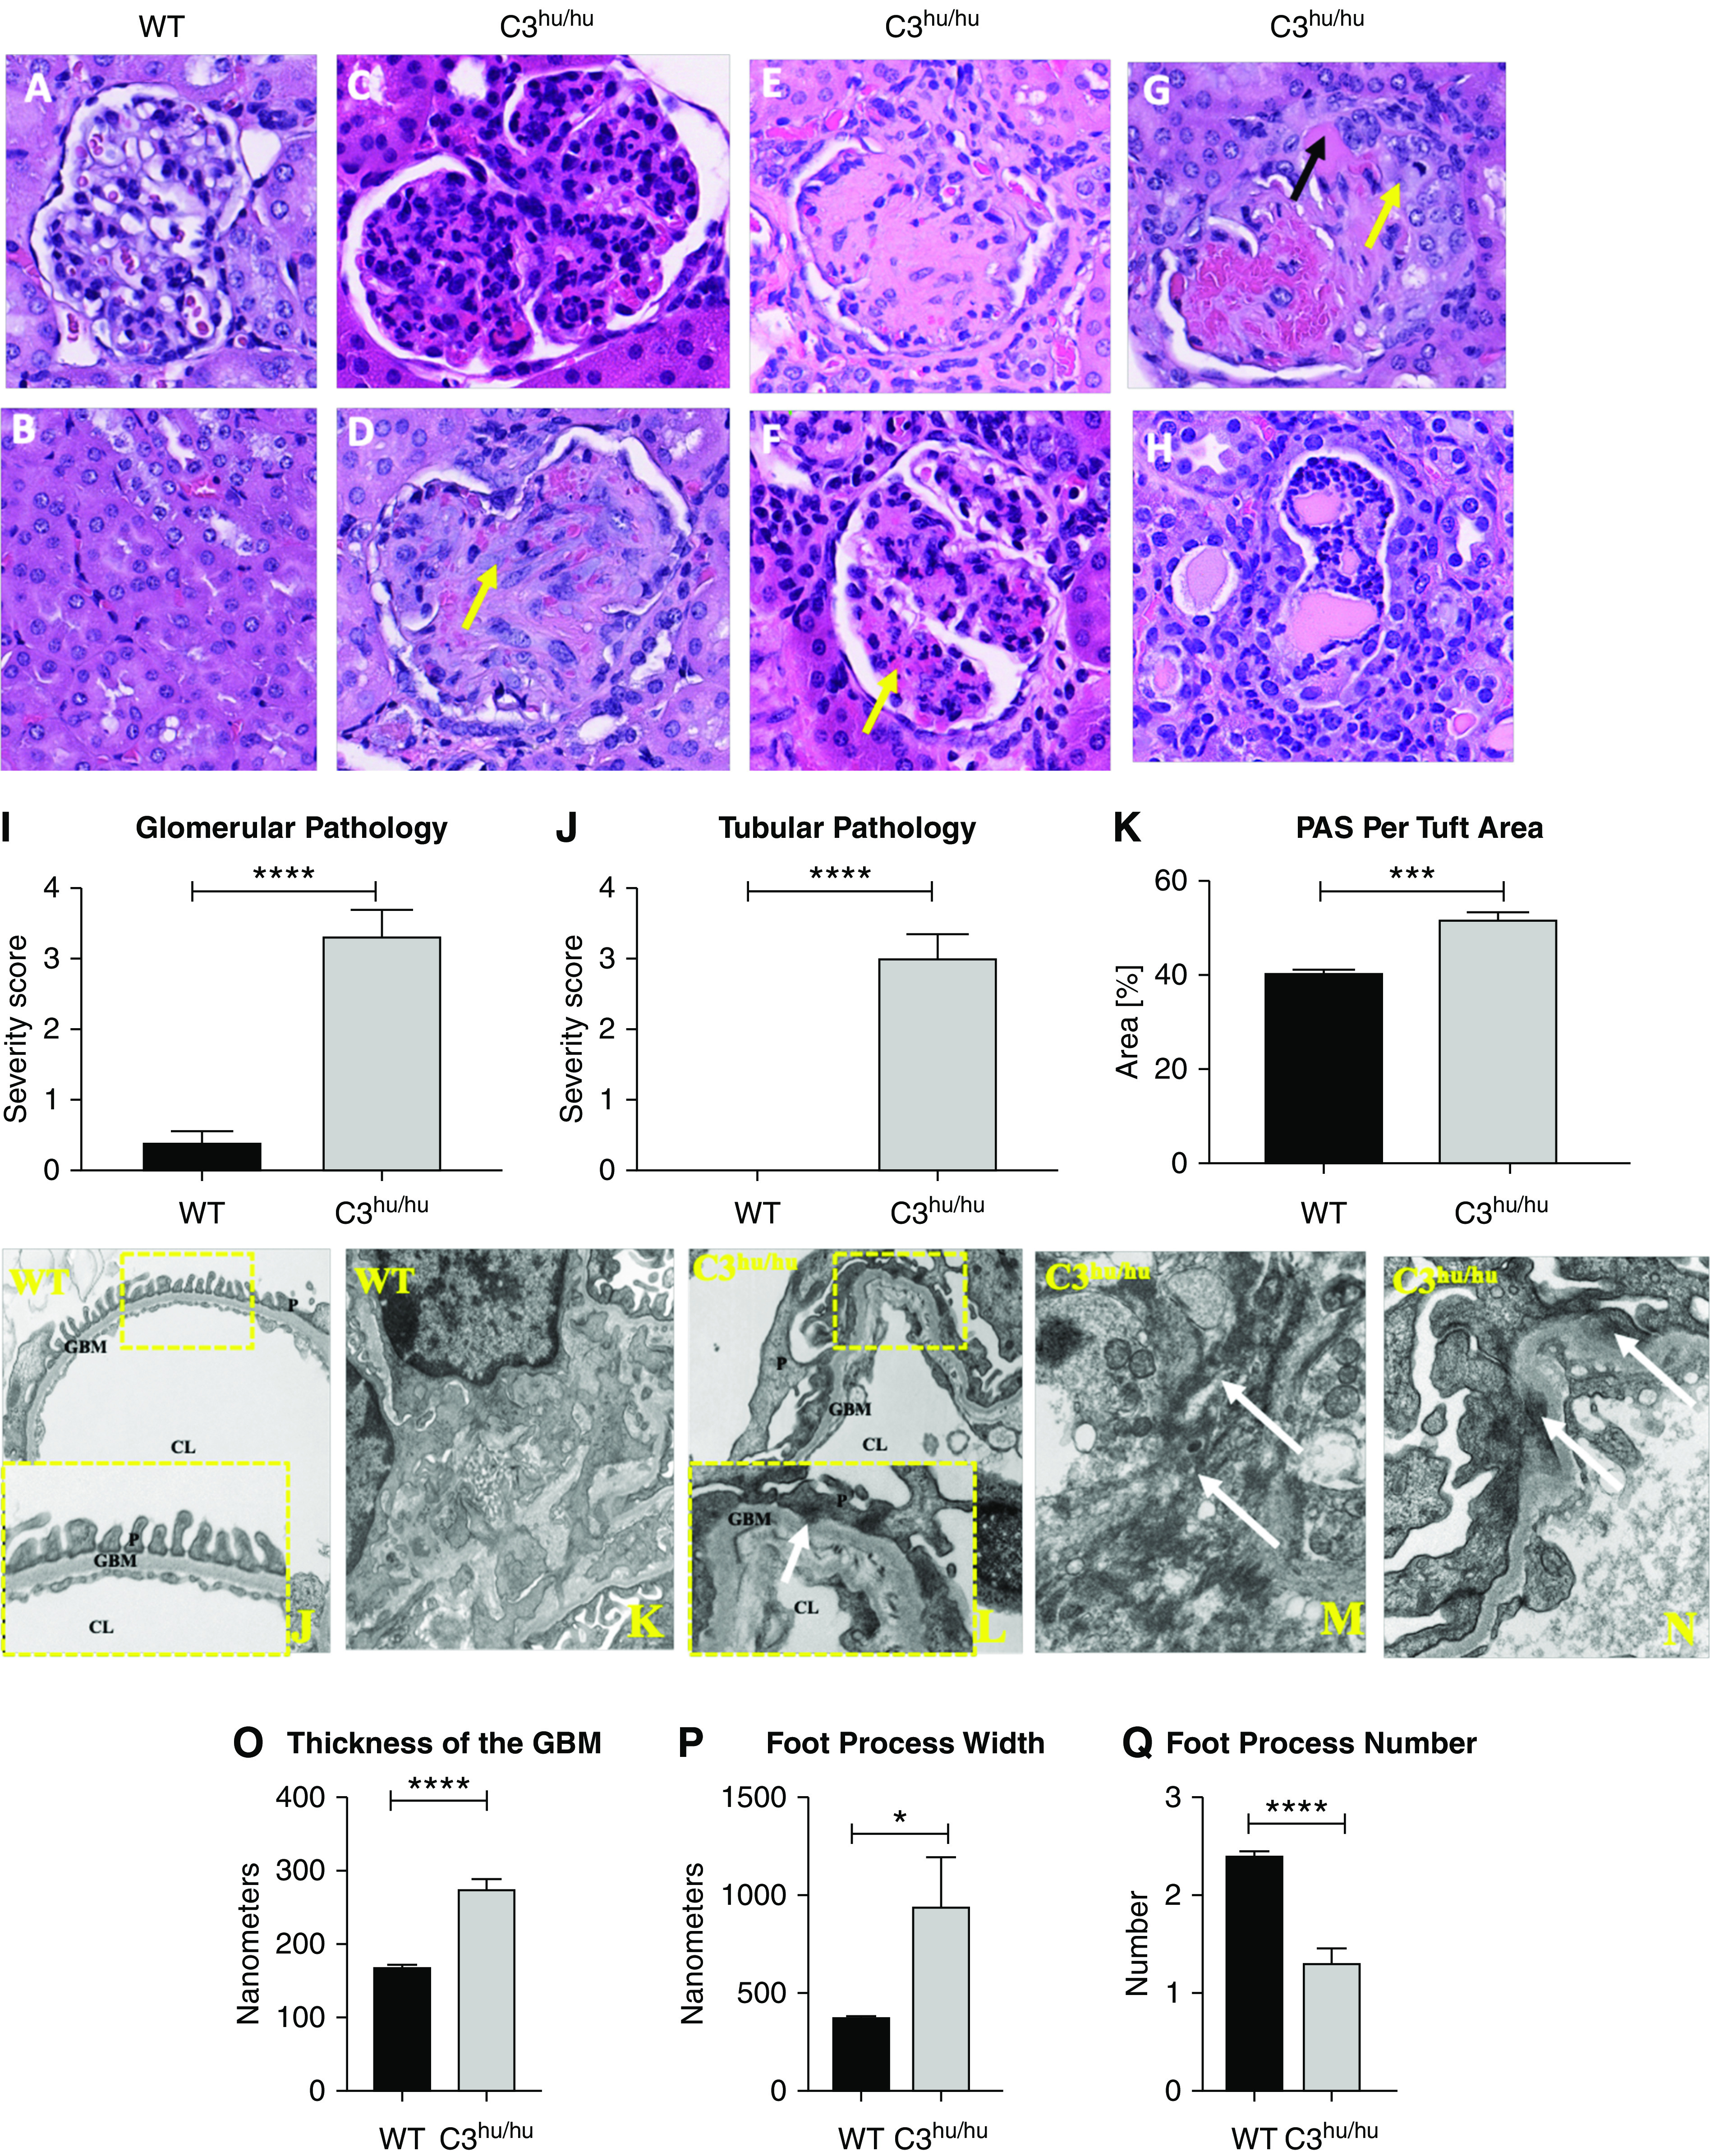
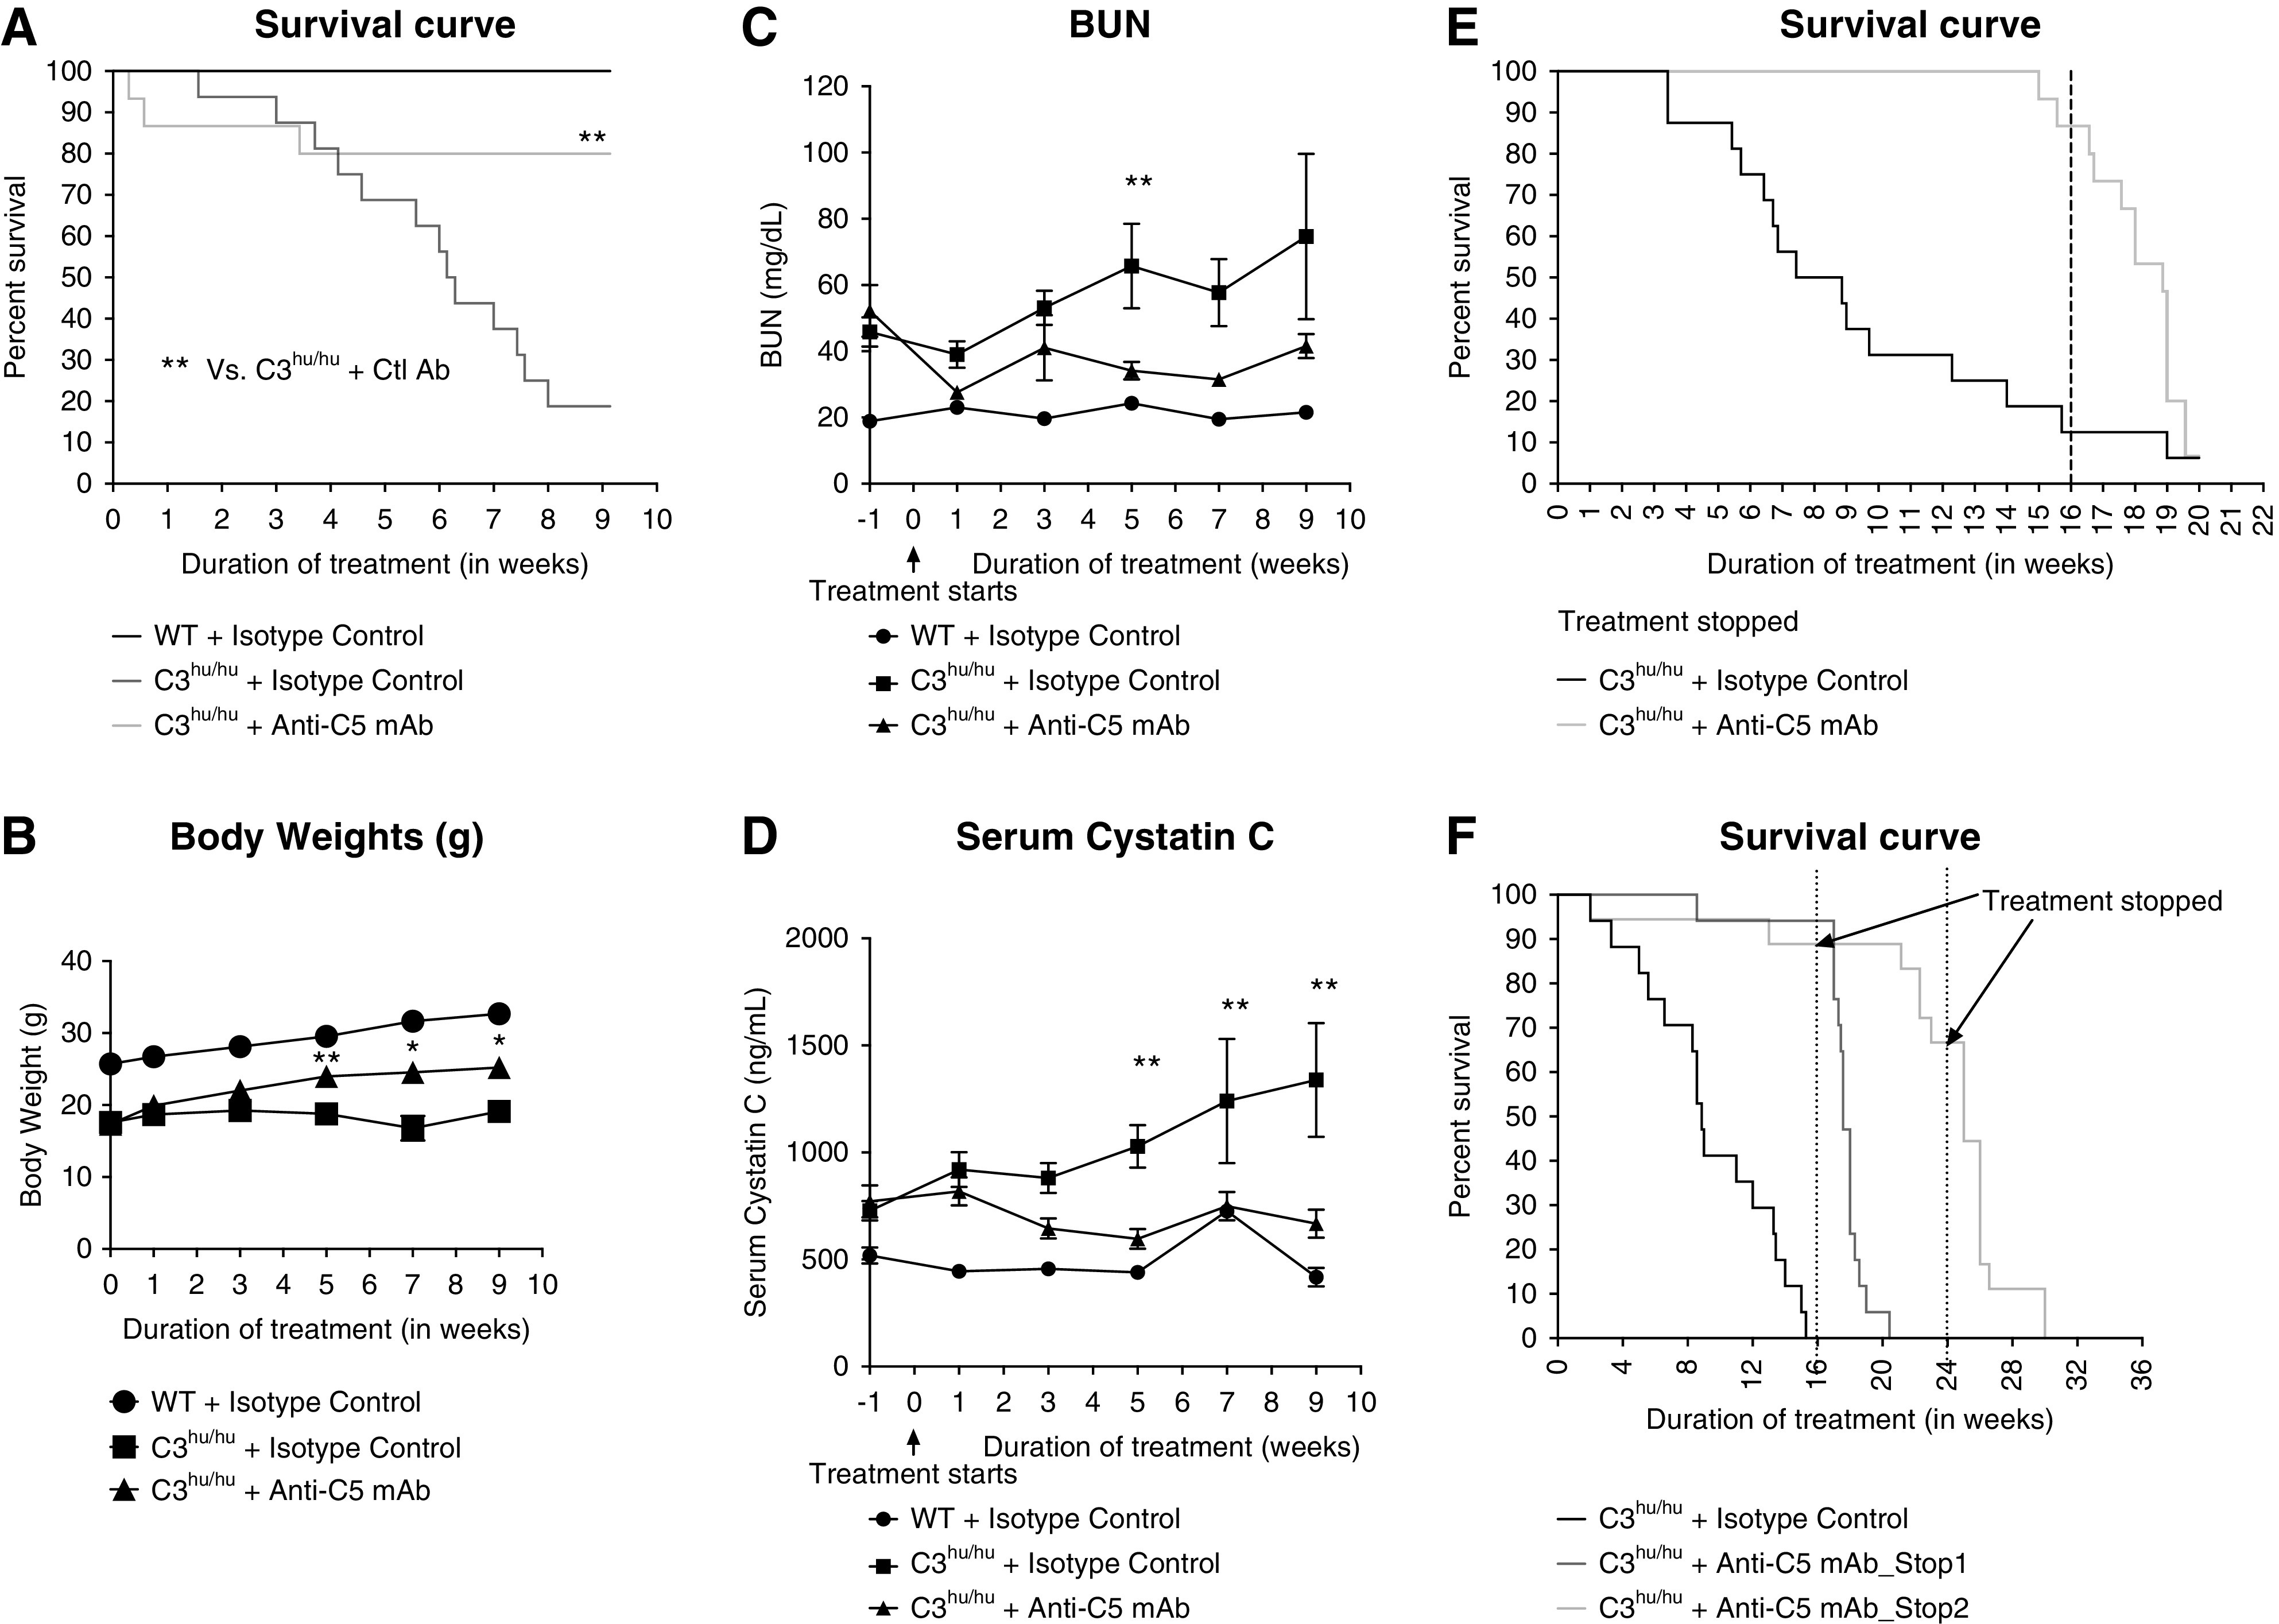
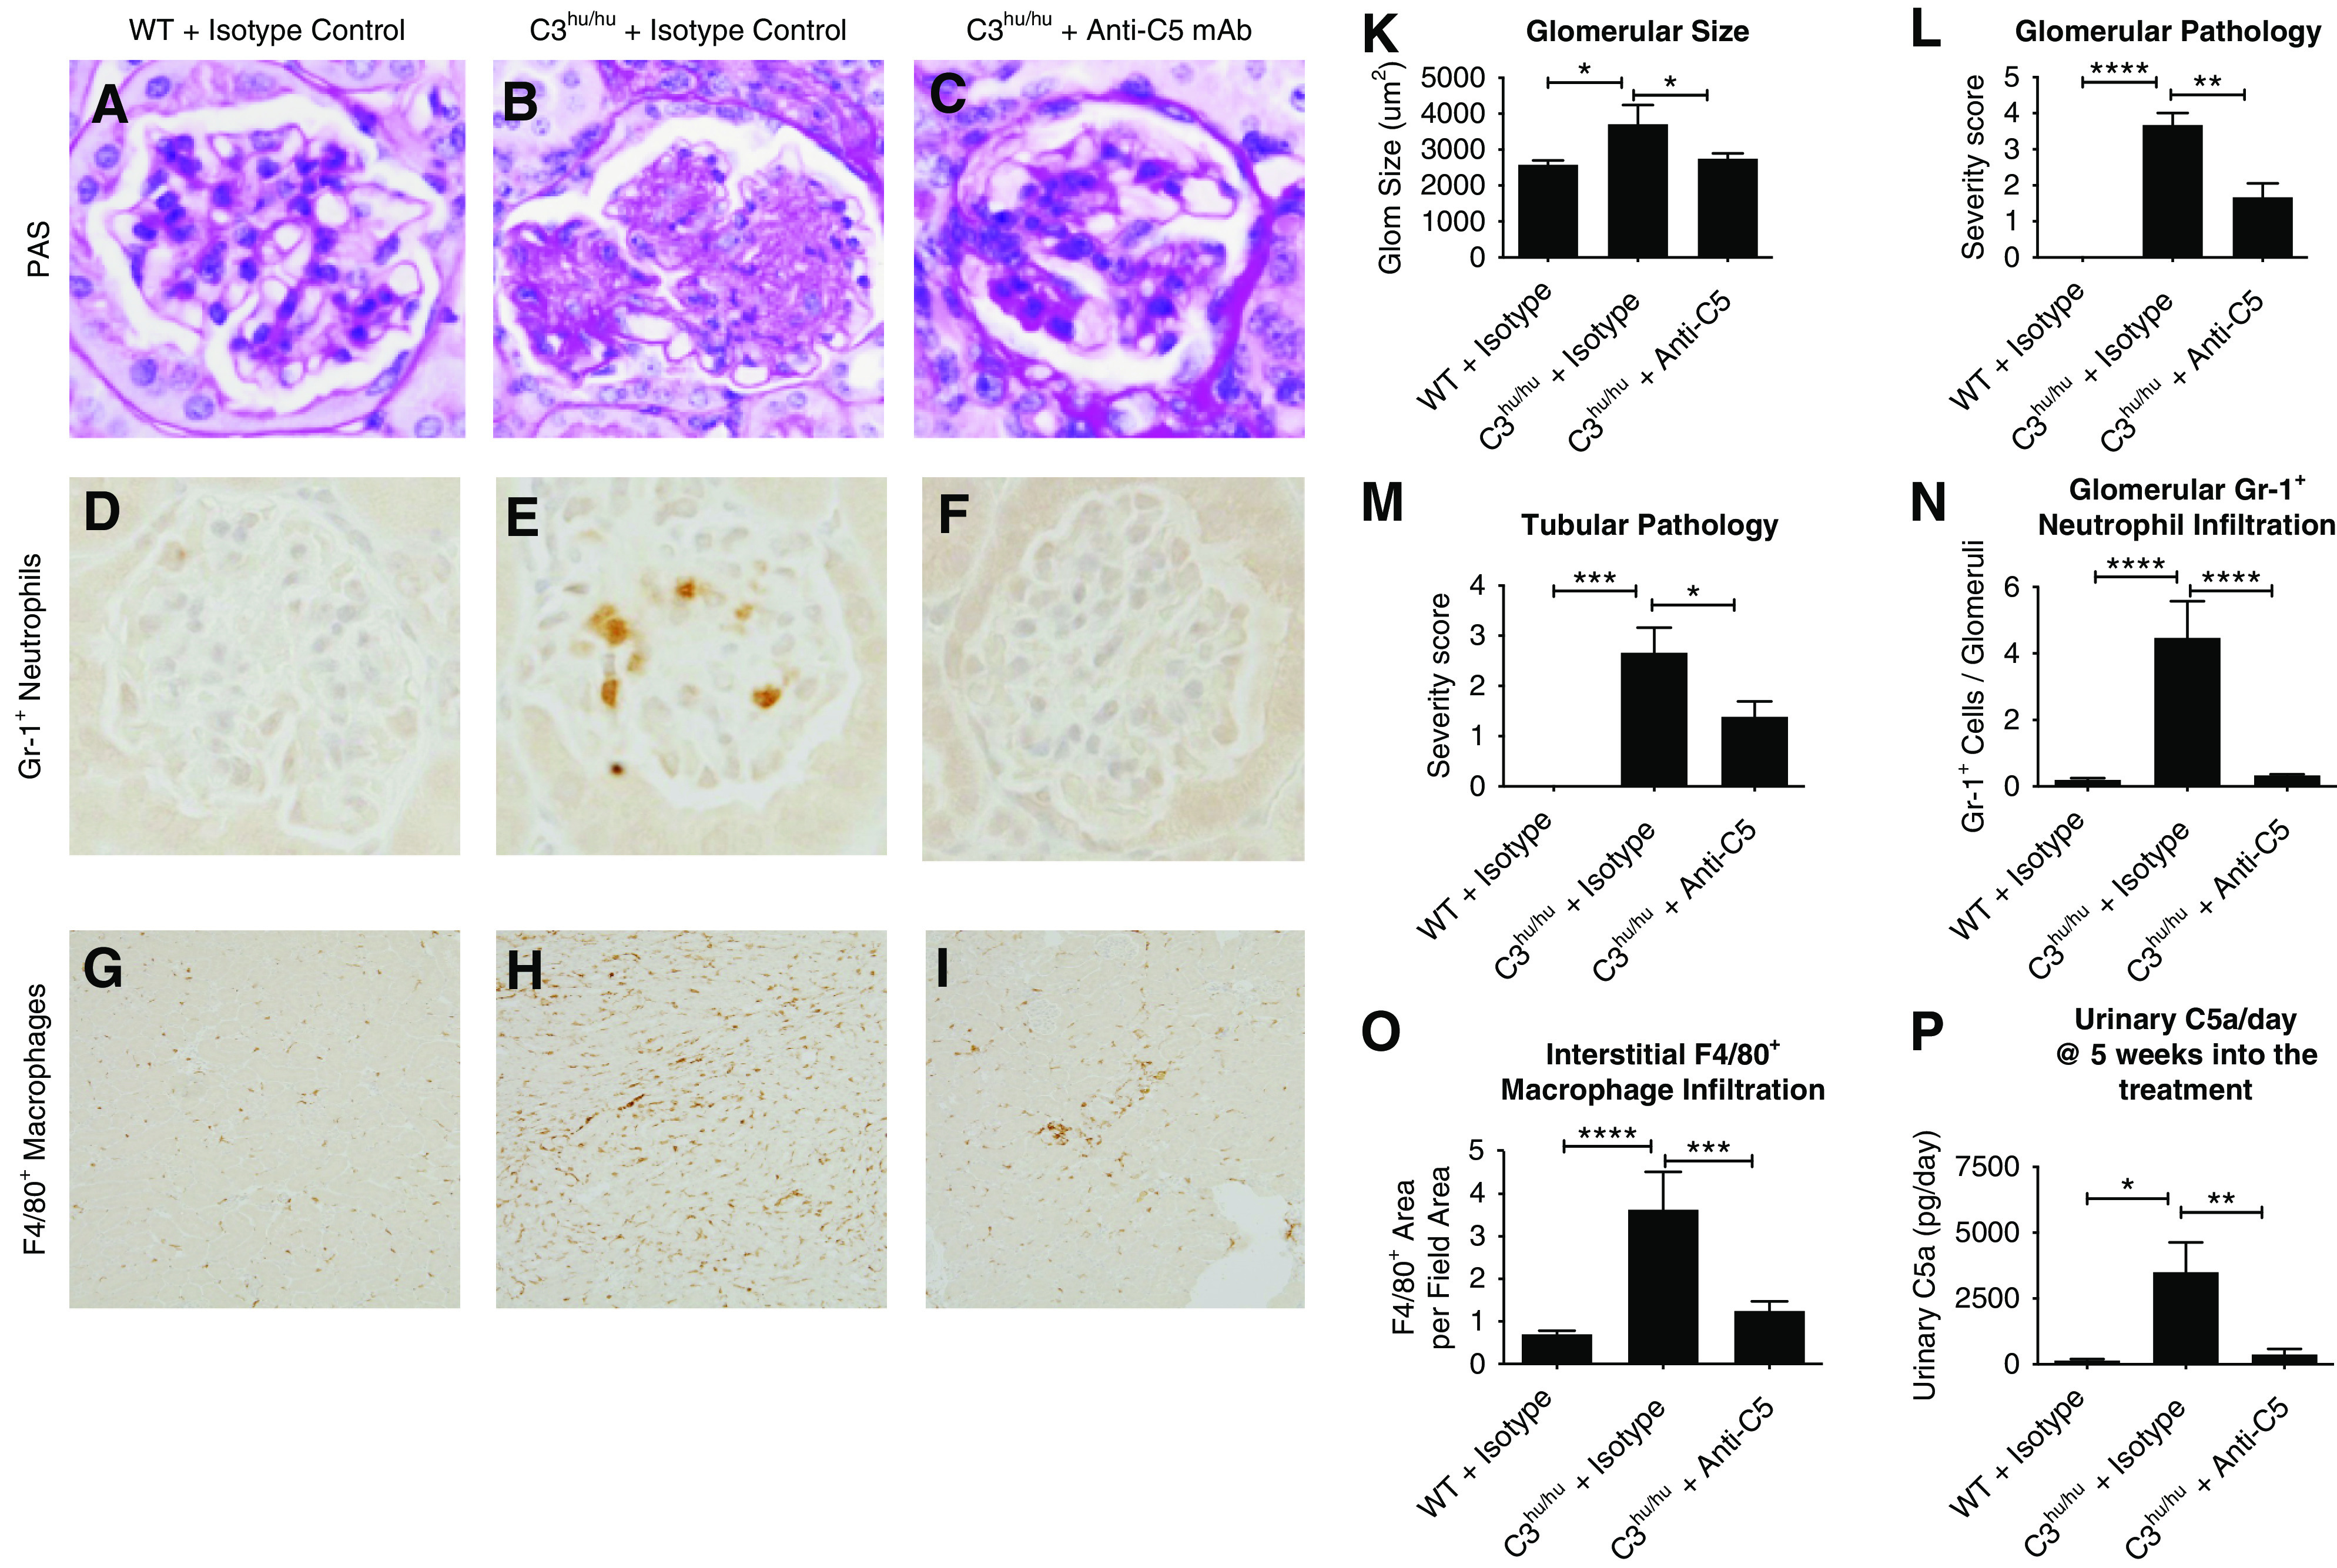
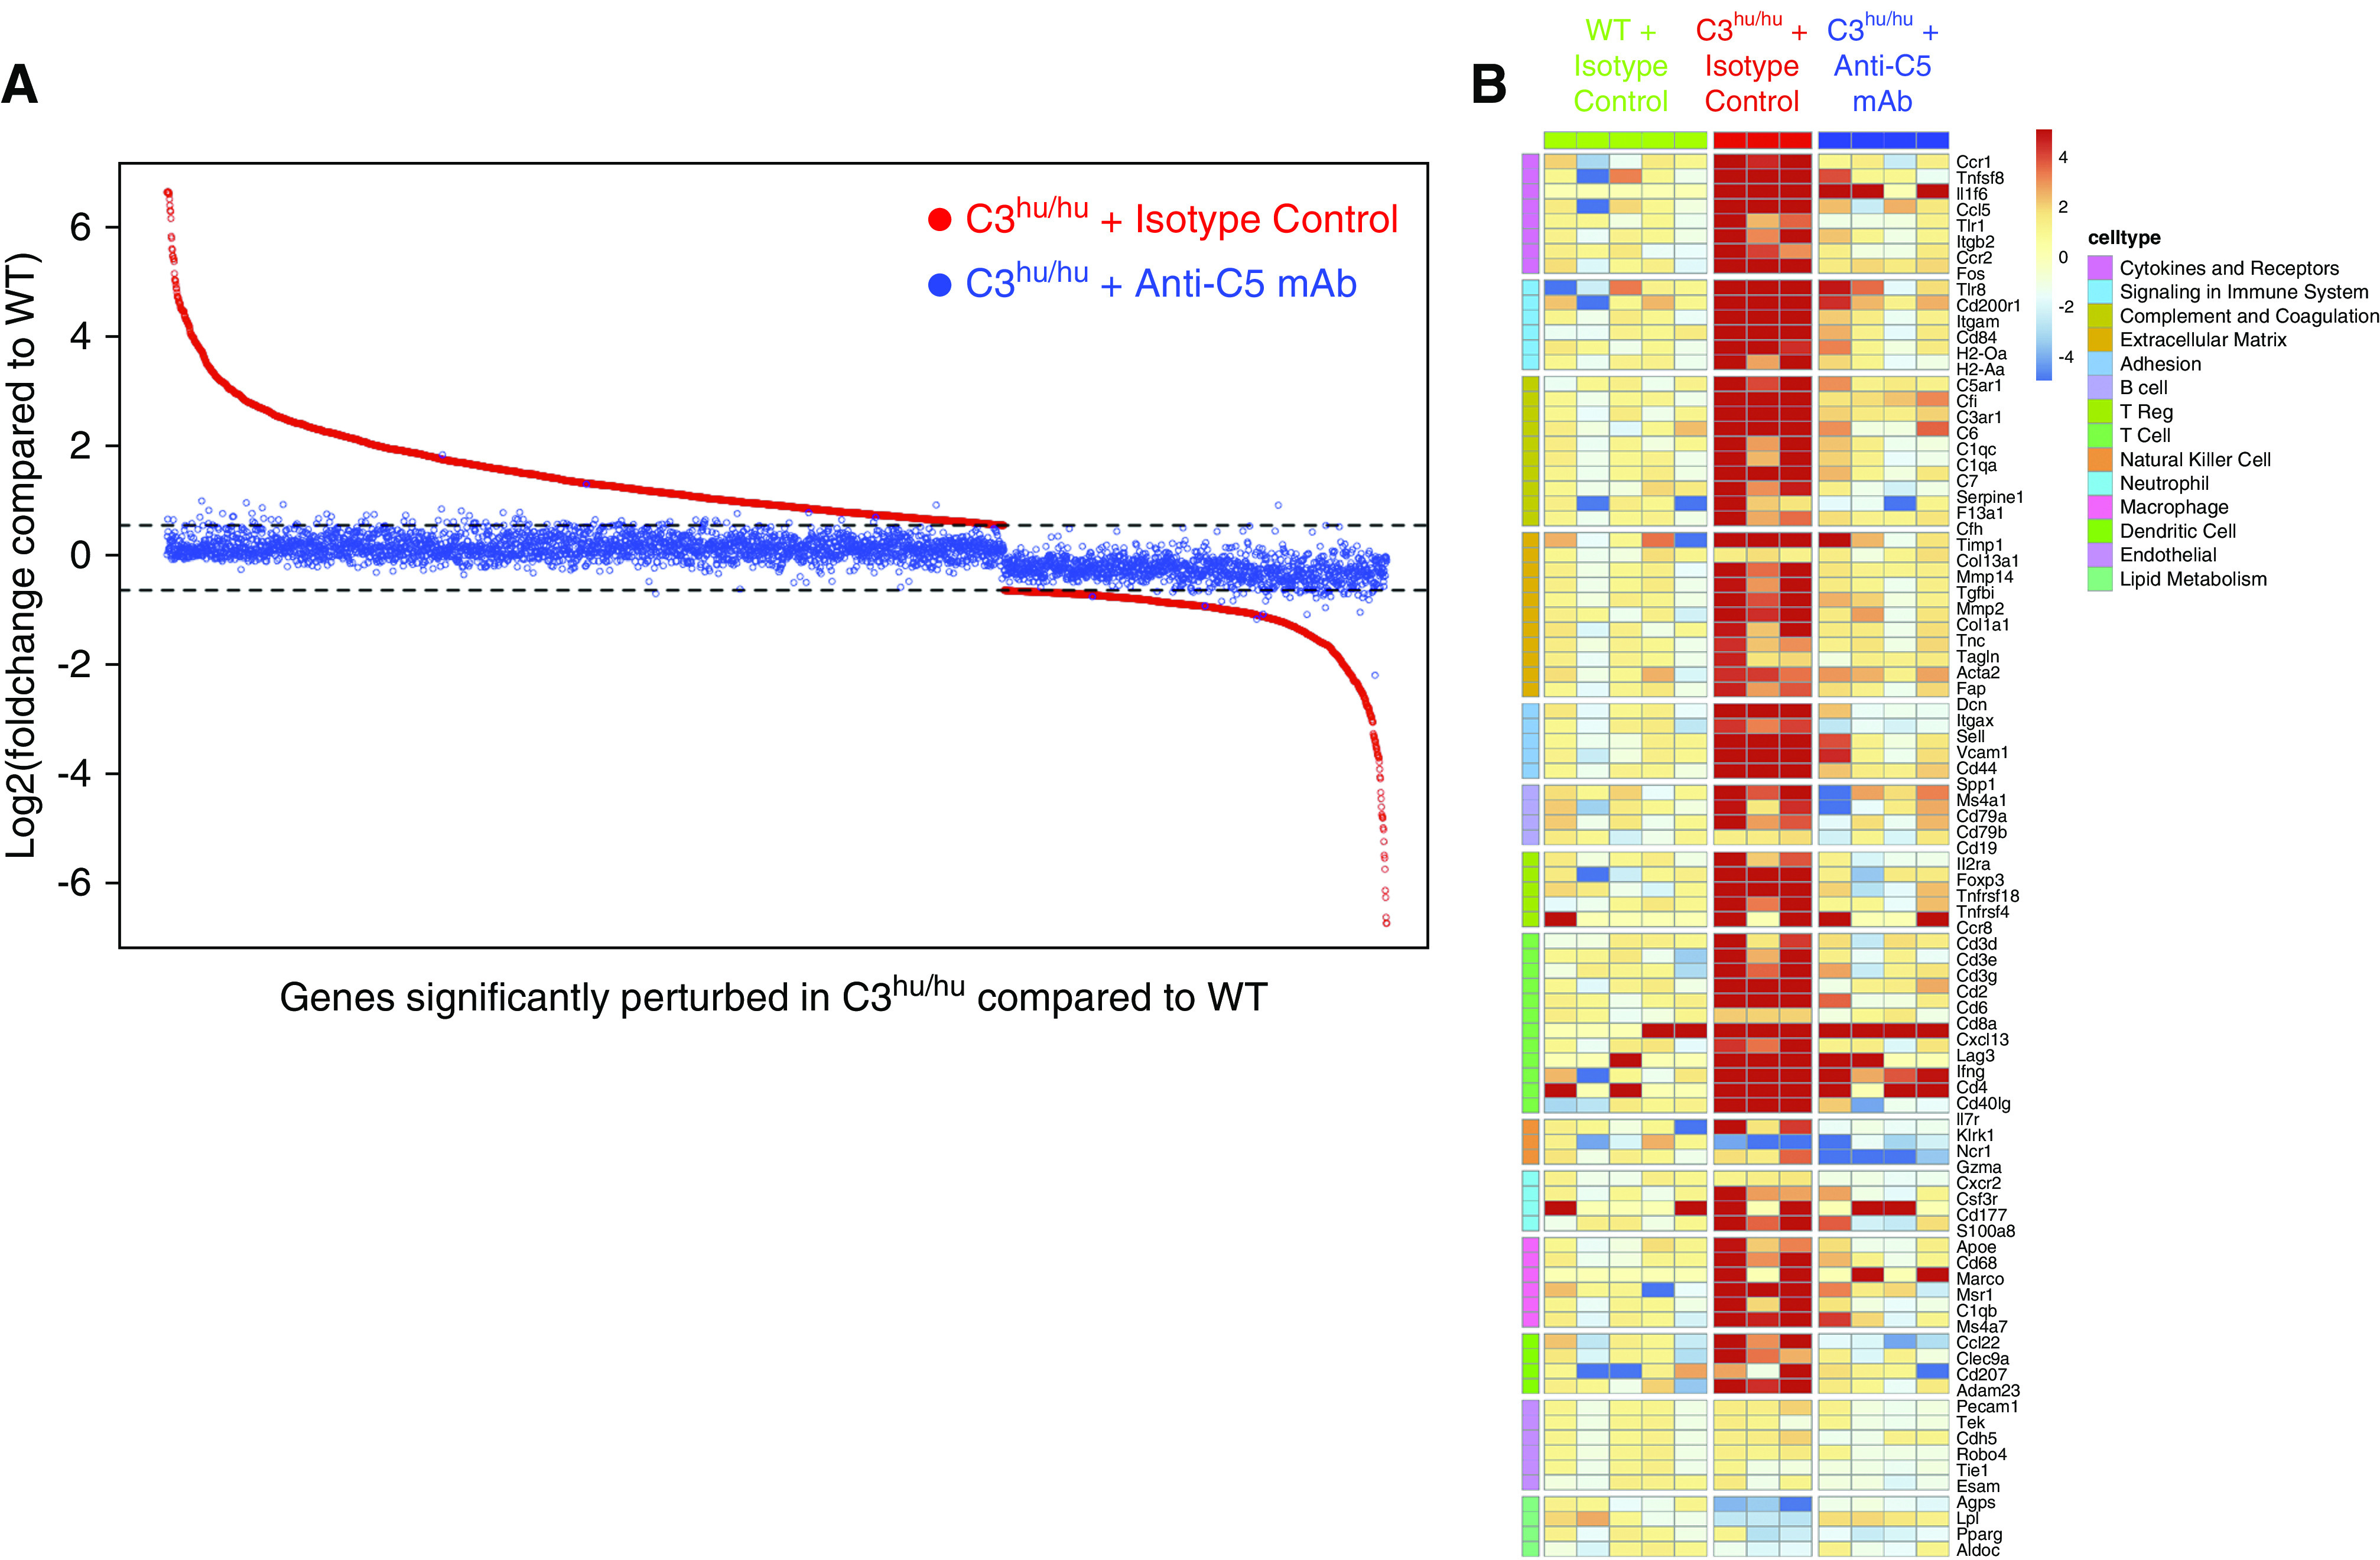
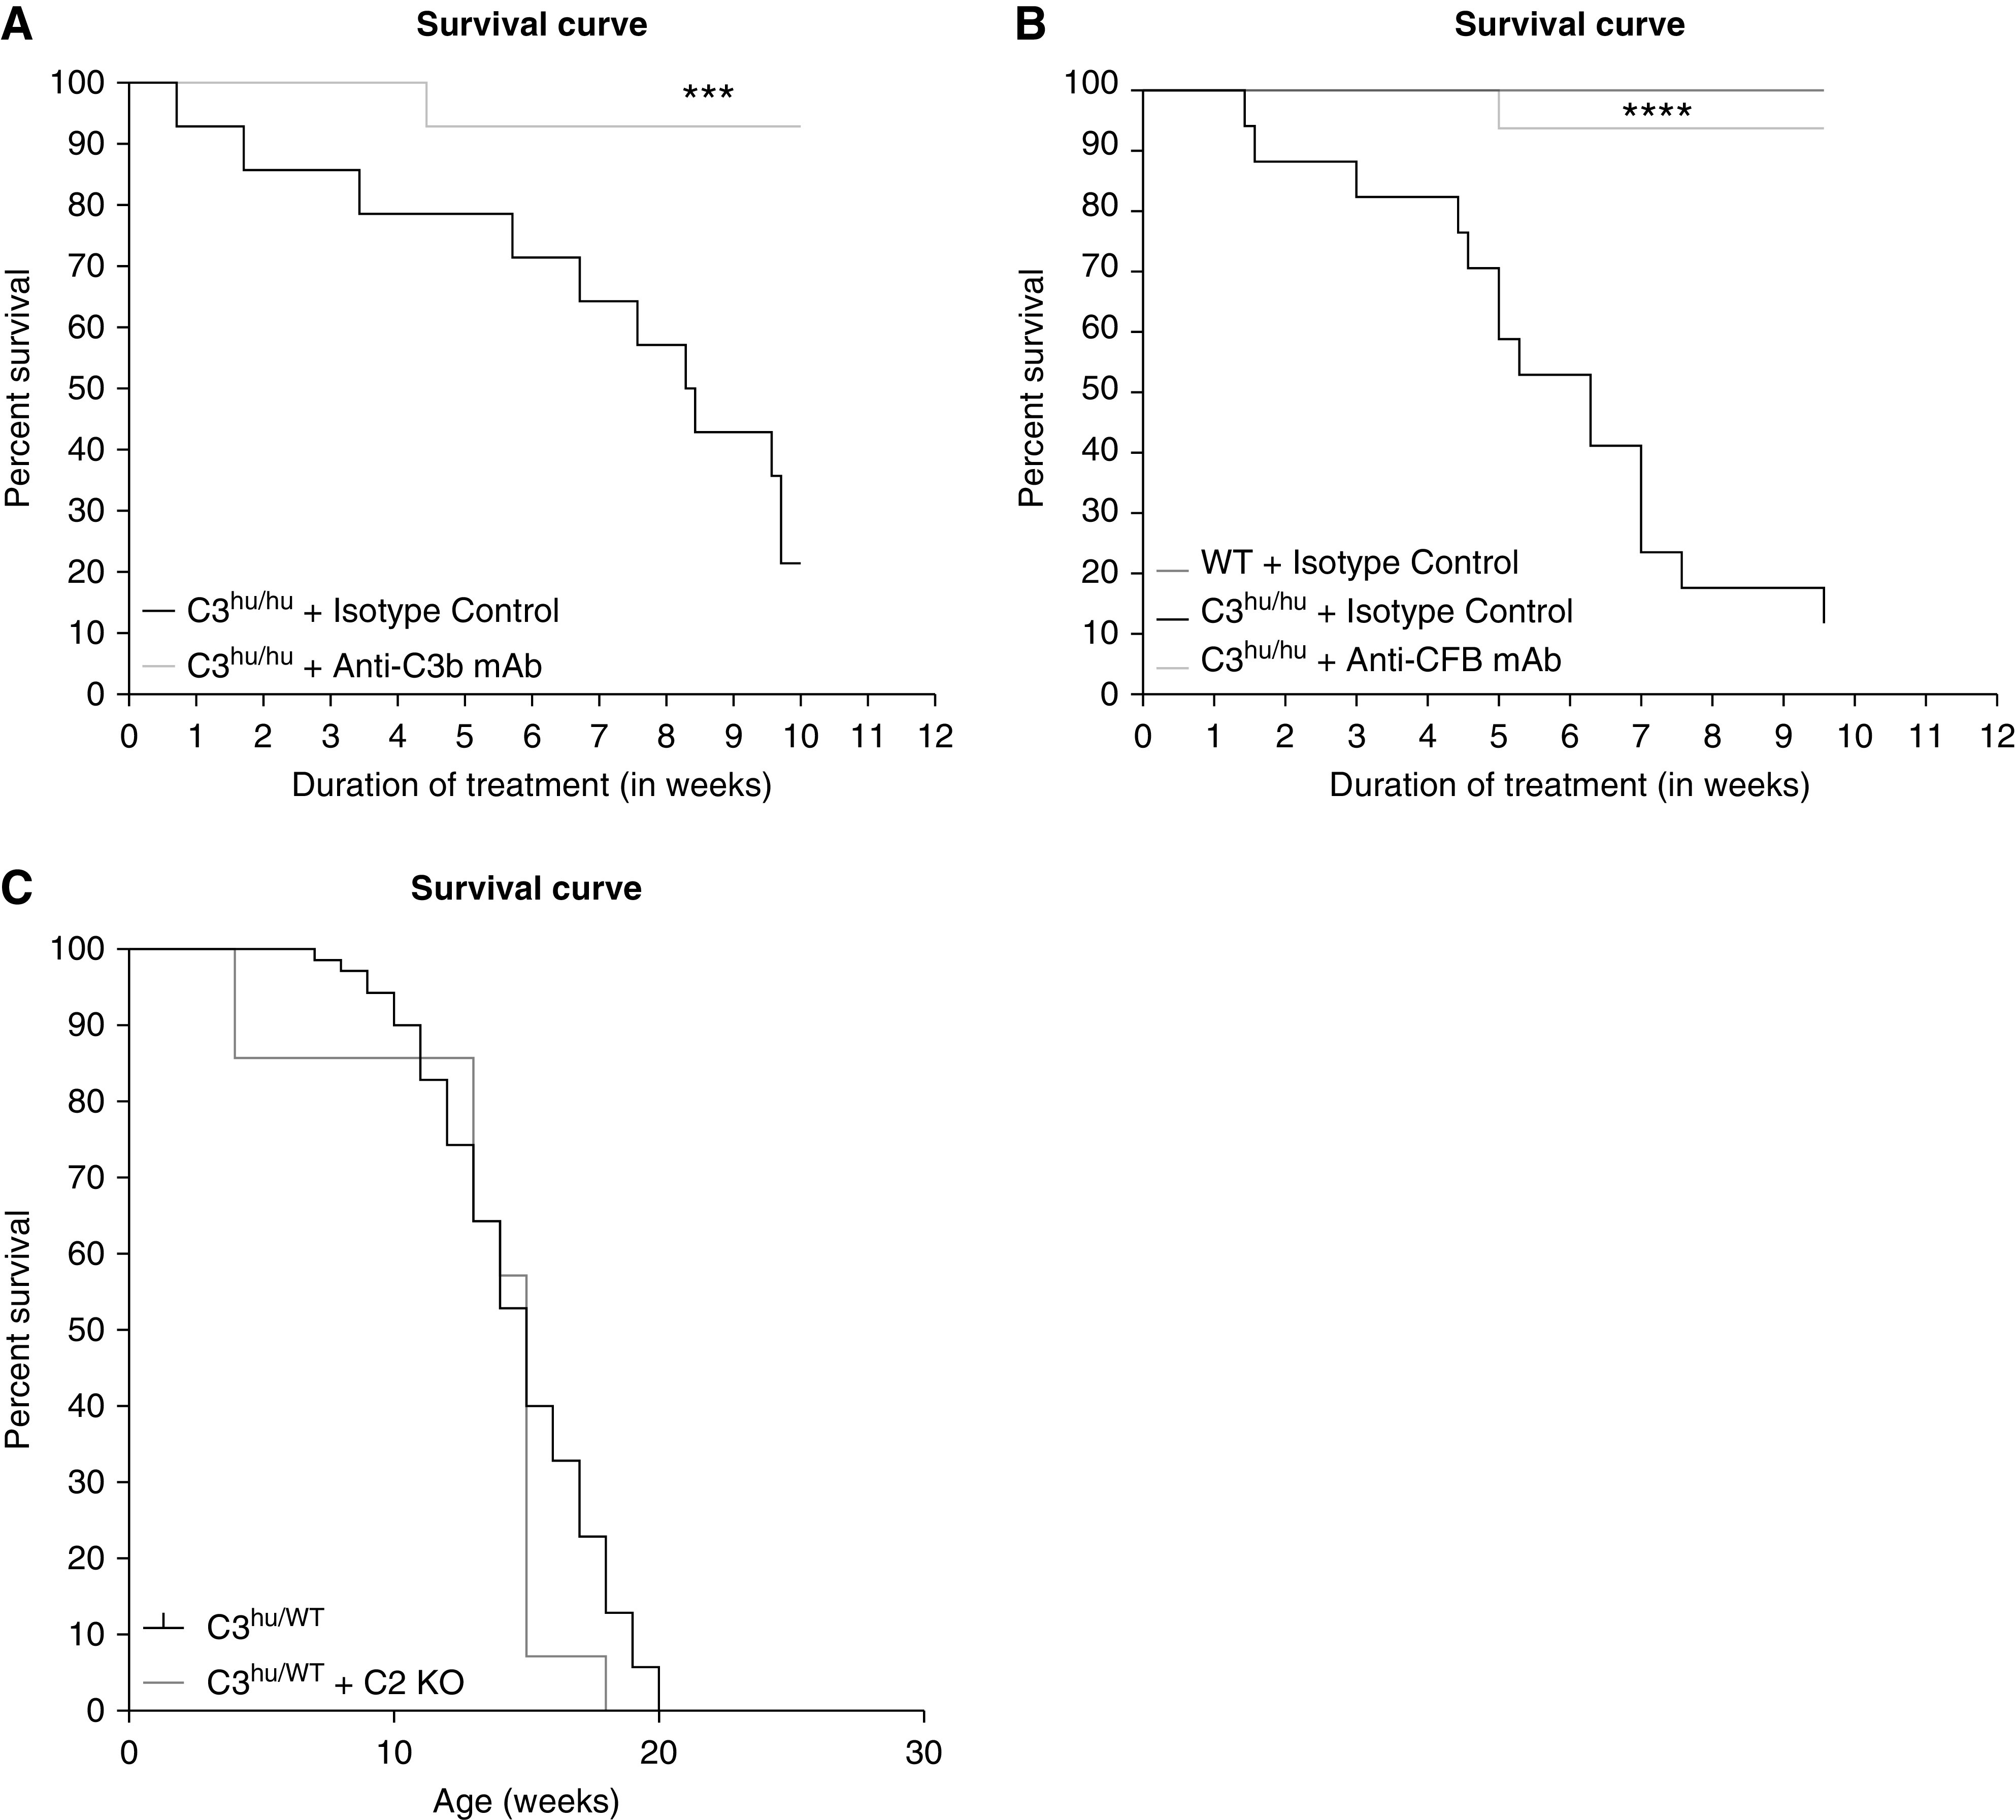
Results: The C3hu/hu mice exhibit increased morbidity early in life and die by about 5-6 months of age. The C3hu/hu mice display elevated biomarkers of kidney dysfunction, glomerulosclerosis, C3/C5b-9 deposition, and reduced circulating C3 compared with wild-type mice. Administration of a C5-blocking mAb improved survival rate and offered functional and histopathologic benefits. Blockade of AP activation by anti-C3b or CFB mAbs also extended survival and preserved kidney function.

Conclusions: The C3hu/hu mice are a useful model for C3G because they share many pathologic features consistent with the human disease. The C3G phenotype in C3hu/hu mice may originate from a dysregulated interaction of human C3 protein with multiple mouse complement proteins, leading to unregulated C3 activation via AP. The accelerated disease course in C3hu/hu mice may further enable preclinical studies to assess and validate new therapeutics for C3G.

Keywords: C2 KO; C3 glomerulopathy; C3b; C5; CFH mAbs; accelerated kidney disease; humanized C3 mice; liver phenotype; mouse model.


Figures

None
Graphical abstract
Figure 1.
Figure 1.
Generation of C3hu/hu mice. (A) An illustration, not to scale, of the mouse C3, mouse C3 KO, and humanized C3 genomic loci. In two sequential targeting steps, the mouse C3 gene, including 6.6 kb of 5′ regulatory region and the entire coding region from exon 1 through exon 41, is deleted and replaced by the human C3 gene, including 9 kb of 5′ regulatory region, the entire coding region from exon 1 through exon 41, 1.5 kb of sequence downstream of the polyA signal, and a loxP site. Horizontal black lines indicate mouse sequence; the horizontal double gray line indicates human sequence; vertical black lines indicate exons; black boxes indicate 3′ untranslated regions; white arrows indicate loxP sites; sequence lengths in kilobases are indicated below the sequences. (B) Expression of the C3 gene in WT (n=3) and C3hu/hu (n=3) by next-generation sequencing (NGS). (C) Serum C3 levels in WT (n=8) and C3hu/hu (n=16). (D) Serum C5 levels in WT (n=7) and C3hu/hu (n=12). (E) Graph showing survival curve of WT (n=17) and C3hu/hu (n=137) mice. (F) Graph showing results of serum C3 levels postadministration of 1 mg CFH (n=3), 2 mg CFH (n=4), 4 mg CFH (n=3), CFI (n=2), or CFH and CFI (n=3) in C3hu/hu mice. ****P<0.001, versus WT. Chr17, chromosome 17; FPKM, fragments per kilobase of transcript per million mapped reads; pNHS, pooled normal human serum (BioIVT).
Figure 2.
Figure 2.
Increased staining of C3, MAC, and IgG in the kidneys of 13-week-old WT (n=6) and C3hu/hu (n=11) mice. Representative images showing cross-sections of kidney tissue stained for (A and B) human C3 protein (red), and (C and D) C5b-9 MAC (red). (E and F) IgG (red) of WT and C3hu/hu mice, respectively. (G and H) Graphs showing fold increase in C3b and C5b-9 staining, respectively, in C3hu/hu mice compared with WT mice. *P<0.05, **P<0.01.
Figure 3.
Figure 3.
Histopathology of the kidneys from C3hu/hu mice. Representative images (×40) and pathology score of H&E-stained kidney sections from WT (n=8) and C3hu/hu (n=12) mice of 13- to 16-week-old mice. (A) Normal glomerulus from WT mouse. (B) Normal tubulointerstitium from WT mouse. (C) Membranoproliferative glomerulopathy in a C3hu/hu mouse. (D) Glomerulus from a C3hu/hu mouse showing hypertrophy (yellow arrow) of mesangial cells. (E) Glomerulus from a C3hu/hu mouse showing global sclerosis of the glomerular capillary tufts. (F) Glomerulus from a C3hu/hu mouse showing fibrinoid necrosis of the glomerular capillary tufts. (G) Glomerulus from a C3hu/hu mouse showing fibrin (black arrow) and epithelial crescent (yellow arrow). (H) Tubular segment from a C3hu/hu mouse with epithelial cell degeneration, necrosis, and inflammatory cells in the lumen. (I) Glomerular pathology score in WT and C3hu/hu mice. (J) Tubular pathology score in WT and C3hu/hu mice. (K) Graphs showing quantification of PAS staining in the glomeruli. (J and K) Electron micrographs of a glomerular capillary loop (higher magnification in inset) and mesangium, respectively, from WT mice. The capillary loop shows normal ultrastructure where podocytes have regular interdigitating foot processes placed on the outer aspect of an intact GBM. The endothelial lining shows normally placed fenestrae. The mesangium is normal in appearance, where cells occupy a thinly distributed matrix. (L) Electron micrographs of capillary loops (higher magnification in inset) of glomeruli from C3hu/hu mice. The capillary loops illustrate abnormal ultrastructure where podocyte foot processes are effaced, resting on a thickened GBM, often showing subepithelial protrusions (white arrow). The GBM contains electron-lucent, subendothelial spaces (rarefactions), with or without flocculent material within them. (M and N) Electron-dense deposits in the mesangium and subepithelial space, respectively (white arrows). (O–Q) Graphs representing quantification of GBM thickness, foot process width, and foot process number, respectively. WT, n=7; C3hu/hu, n=7. *P<0.05, ***P<0.001, ****P<0.0001, versus WT. CL, capillary lumen; P, podocyte.
Figure 4.
Figure 4.
Functional and molecular characteristics of C3hu/hu mice. (A and B) Graphs depicting the results of BUN and sCysC, respectively, in WT (n=6) and C3hu/hu mice (n=9). (C) Graph depicting the results of urinary albumin per day and urinary albumin normalized to creatinine, respectively, in WT (n=6) and C3hu/hu mice (n=9). (D) Gene-set enrichment analysis of genes differentially expressed between C3hu/hu mice and their WT controls. Graph shows subset of the MsigDB hallmark gene sets with adjusted P value for enrichment <10−3. uAlb, urinary albumin; uCreat, urinary creatinine. *P<0.05, **P<0.01, ****P<0.0001.
Figure 5.
Figure 5.
Anti-C5 mAb improves survival, body condition, and kidney function in C3hu/hu mice. Shown are the survival curves of (A) WT and isotype control (n=5), C3hu/hu and isotype control (n=16), and C3hu/hu and anti-C5 mAb (n=16); (E) C3hu/hu and isotype control (n=16), C3hu/hu and anti-C5 mAb (n=15), and (F) C3hu/hu and isotype control (n=17), C3hu/hu and anti-C5 mAb_Stop1 (n=17), and C3hu/hu and Anti-C5 mAb_Stop2 (n=17). (B) Body weight and (C and D) BUN and sCysC of WT mice treated with isotype control and C3hu/hu mice treated with isotype control or anti-C5 mAb. For the experiment in (E), treatment stopped after 16 weeks. For the experiment in (F), one group treatment stopped at 16 weeks (stop 1) and another group treatment stopped at 24 weeks (stop 2). *P<0.05, **P<0.005, C3hu/hu and anti-C5 mAb versus C3hu/hu and isotype control.
Figure 6.
Figure 6.
Anti-C5 mAb offers histopathology benefit in C3hu/hu mice. (A–I) Representative histopathology images of WT mice treated with isotype control (n=10), and C3hu/hu mice treated with isotype control (n=6) or anti-C5 mAb M1M17628N (n=18). (A–C) Images from PAS-stained sections. (D–F) Images from Gr-1–stained sections for neutrophils. (G–I) Images from F4/80+-stained sections for macrophages. (K) Graph showing quantification of glomerular (glom) size. (L and M) Graphs showing glomerular and tubular pathology scores. (N) Graph showing quantification of Gr-1+ neutrophils. (O) Graph showing quantification of F4/80+ macrophages. (P) Graph showing urinary C5a levels. WT mice treated with isotype control (n=5), and C3hu/hu mice treated with isotype control (n=10) or anti-C5 mAb M1M17628N (n=12). *P<0.05, **P<0.01, ***P<0.001, ****P<0.0001.
Figure 7.
Figure 7.
Anti-C5 mAb rescues molecular signature in C3hu/hu mice. (A) Scatterplot demonstrating that anti-C5 antibody treatment reversed disease signature genes in C3hu/hu mice. Shown are log2 fold changes of all 3443 genes differentially expressed between isotype-treated C3hu/hu and WT mice (red dots), sorted by diminishing fold change. Each gene’s corresponding fold change when comparing C5 mAb-treated C3hu/hu mice with WT is plotted in blue at the same position along the x axis. Horizontal dotted lines indicate 50% up- or downregulation, corresponding to our fold change cutoff for identifying differential expression. (B) Heatmap showing representative genes (rows) for perturbed pathways and immune cell types. Each column represents an individual animal, and each cell represents an individual gene-expression measurement, normalized separately for each gene to the median of WT controls. Red and blue colors represent up- and downregulated genes, respectively. All pathways (although not all genes) of interest were perturbed in the C3hu/hu and isotype control mice, and then subsequently attenuated by anti-C5 mAb treatment.
Figure 8.
Figure 8.
The AP C3 convertase blocking mAbs, anti-C3b, or anti-CFB improve survival rate in C3hu/hu mice. (A) Survival curve with anti-C3b mAb (C3hu/hu and isotype control, n=14; C3hu/hu and anti-C3b, n=14). (B) Survival curve with anti-CFB mAb (WT and isotype control, n=4; n=C3hu/hu and isotype control, n=17; C3hu/hu and anti-C3b, n=16). (C) Survival curve with C2 KO (C3hu/WT, n=70; C3hu/WT and C2 KO, n=14). ***P<0.001, ****P<0.0001, versus C3hu/hu and isotype control.

References

    1. Pickering MC, D’Agati VD, Nester CM, Smith RJ, Haas M, Appel GB, et al. .: C3 glomerulopathy: Consensus report. Kidney Int 84: 1079–1089, 2013 - PMC - PubMed
    1. Zipfel PF, Skerka C, Chen Q, Wiech T, Goodship T, Johnson S, et al. .: The role of complement in C3 glomerulopathy. Mol Immunol 67: 21–30, 2015 - PubMed
    1. Servais A, Frémeaux-Bacchi V, Lequintrec M, Salomon R, Blouin J, Knebelmann B, et al. .: Primary glomerulonephritis with isolated C3 deposits: A new entity which shares common genetic risk factors with haemolytic uraemic syndrome. J Med Genet 44: 193–199, 2007 - PMC - PubMed
    1. Spartà G, Gaspert A, Neuhaus TJ, Weitz M, Mohebbi N, Odermatt U, et al. .: Membranoproliferative glomerulonephritis and C3 glomerulopathy in children: Change in treatment modality? A report of a case series. Clin Kidney J 11: 479–490, 2018 - PMC - PubMed
    1. Cook HT, Pickering MC: Histopathology of MPGN and C3 glomerulopathies. Nat Rev Nephrol 11: 14–22, 2015 - PubMed

Publication types

MeSH terms