. 2020 Dec 7;5(54):eabe0240.
doi: 10.1126/sciimmunol.abe0240.

Defining the features and duration of antibody responses to SARS-CoV-2 infection associated with disease severity and outcome

Affiliations

Defining the features and duration of antibody responses to SARS-CoV-2 infection associated with disease severity and outcome

Katharina Röltgen et al. Sci Immunol. .

Abstract

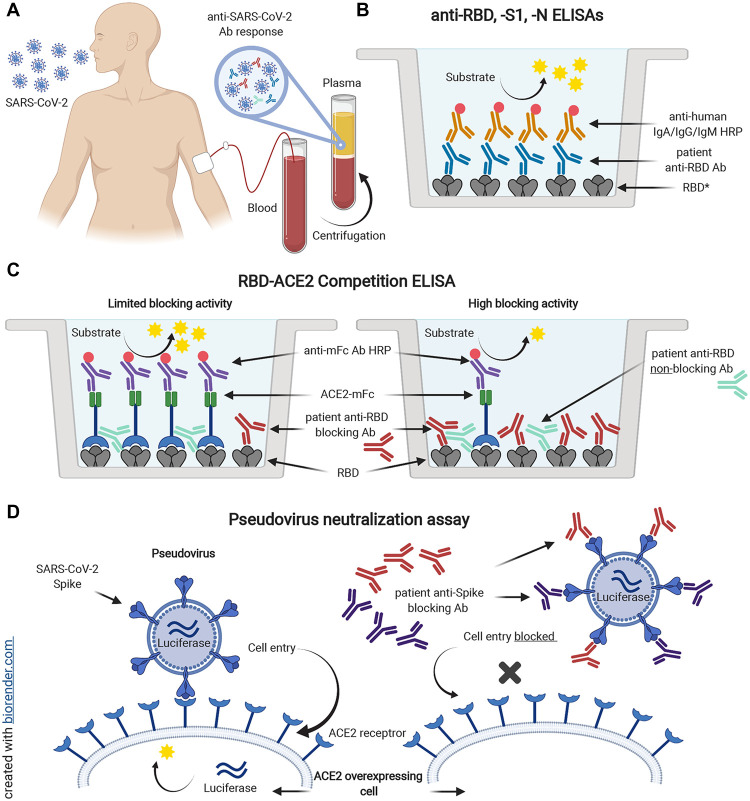
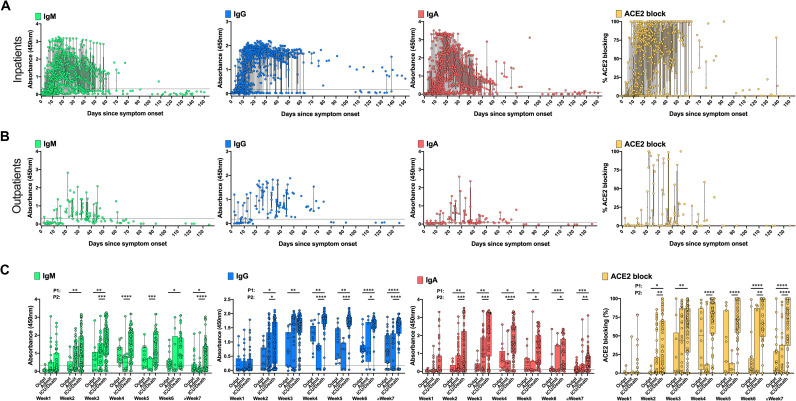
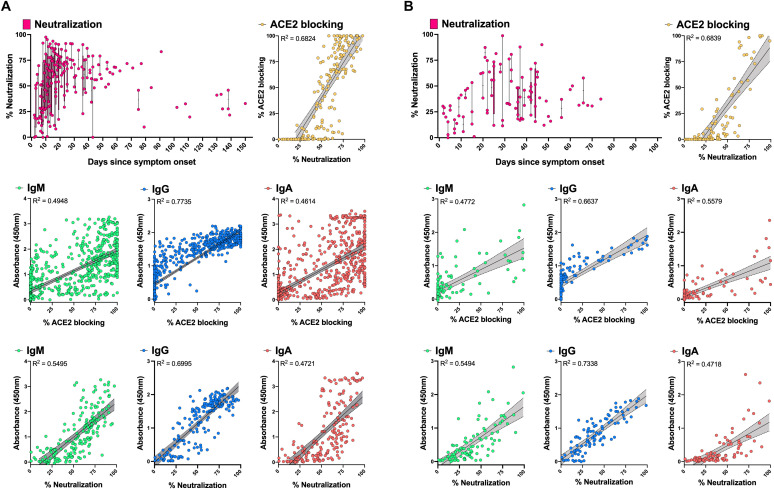
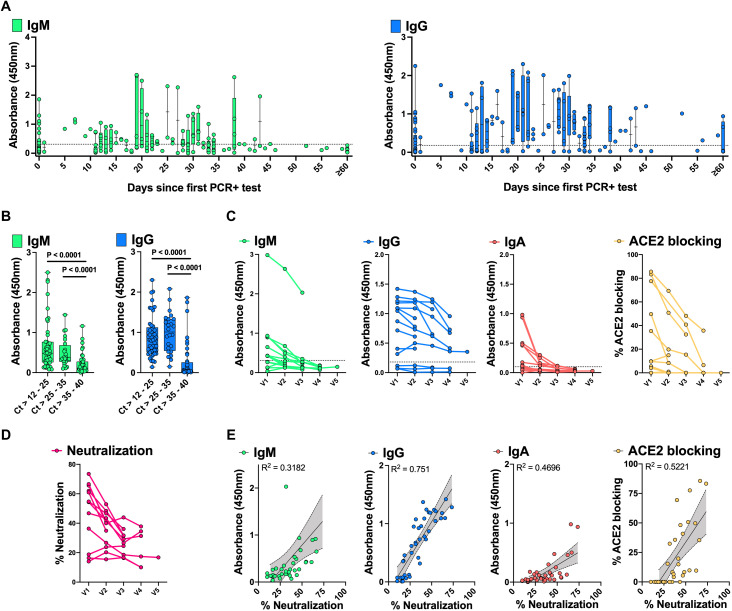
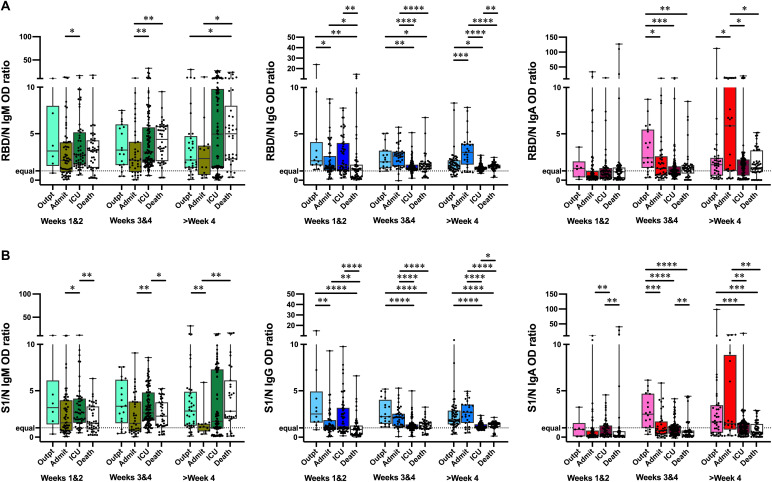
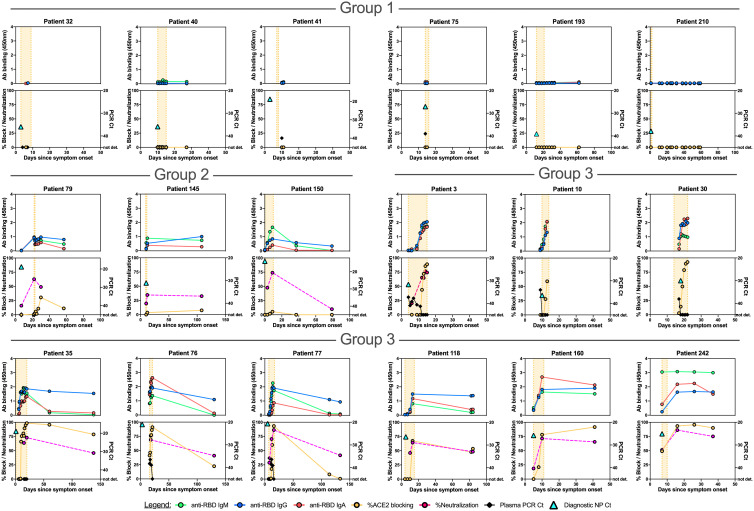
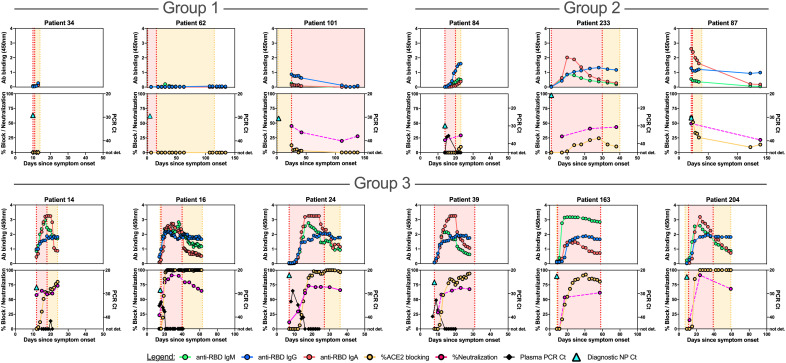
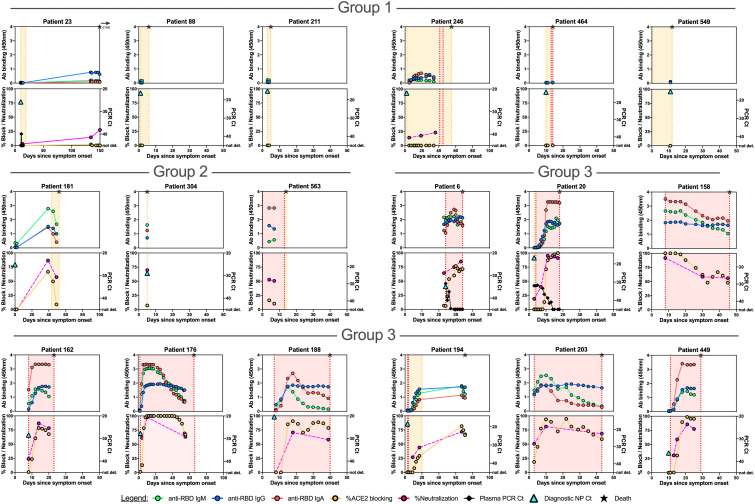
SARS-CoV-2-specific antibodies, particularly those preventing viral spike receptor binding domain (RBD) interaction with host angiotensin-converting enzyme 2 (ACE2) receptor, can neutralize the virus. It is, however, unknown which features of the serological response may affect clinical outcomes of COVID-19 patients. We analyzed 983 longitudinal plasma samples from 79 hospitalized COVID-19 patients and 175 SARS-CoV-2-infected outpatients and asymptomatic individuals. Within this cohort, 25 patients died of their illness. Higher ratios of IgG antibodies targeting S1 or RBD domains of spike compared to nucleocapsid antigen were seen in outpatients who had mild illness versus severely ill patients. Plasma antibody increases correlated with decreases in viral RNAemia, but antibody responses in acute illness were insufficient to predict inpatient outcomes. Pseudovirus neutralization assays and a scalable ELISA measuring antibodies blocking RBD-ACE2 interaction were well correlated with patient IgG titers to RBD. Outpatient and asymptomatic individuals' SARS-CoV-2 antibodies, including IgG, progressively decreased during observation up to five months post-infection.


Figures

Fig. 1
Fig. 1. Serological testing of plasma from SARS-CoV-2 rRT-PCR+ individuals.
Plasma samples from SARS-CoV-2 rRT-PCR-positive individuals (A) were analyzed for the presence of antibodies binding to SARS-CoV-2 spike RBD (B). *Plasma was also tested for antibodies specific for SARS-CoV-2 S1 and N proteins, and SARS-CoV RBD. In addition, samples were tested for antibodies blocking the interaction of ACE2 and RBD in an ACE2 competition ELISA (C). Spike SARS-CoV-2 pseudotyped lentiviral neutralization assays were performed on selected plasma samples (D). Spike-mediated virus entry into HeLa cells overexpressing the ACE2 receptor was measured via luciferase reporter activity.
Fig. 2
Fig. 2. Development of anti-SARS-CoV-2 RBD antibody responses in COVID-19 patients.
828 longitudinal plasma samples collected from 80 COVID-19 inpatients and deceased individuals (714 samples) (A) and 86 outpatients (114 samples) (B) were tested by ELISA at a dilution of 1:100 for the presence of SARS-CoV-2 RBD-specific IgM, IgG, and IgA antibodies and for antibodies blocking binding of ACE2 to RBD. ELISA data stratified by the 86 outpatients (Outpt), 35 hospitalized patients who did not require ICU care (Admit), and the 20 ICU patients and 25 patients who died, from week 1 to ≥ 7 weeks post-onset of symptoms (C). Boxes indicate the interquartile range and whiskers show the minimum and maximum values for each group. Dotted lines denote the assay cutoff. Mean values for duplicate measurements are shown. Statistical testing comparisons are P1 = Outpt vs Admit/ICU/Deceased, P2 = Admit vs ICU/Deceased, by two-sided Wilcoxon rank sum test. * P < 0.05, ** P < 0.01, *** P < 0.001, **** P < 0.0001. Data for 14 samples from 2 patients (one admitted non-ICU and one deceased patient) are not plotted because the time of symptom onset was unknown. Mean ELISA OD450 values of duplicate measurements are shown for each sample.
Fig. 3
Fig. 3. Correlation of spike-pseudotyped viral neutralization, RBD-ACE2 blocking and RBD-specific serology results.
Plasma samples from inpatients (n = 188) (A) and outpatients (n = 96) (B) collected at different time points post-onset of symptoms were tested at a dilution of 1:1250 for their pseudovirus neutralization activity. Correlations with RBD IgM, IgG, IgA (1:100 diluted plasma samples), and RBD-ACE2 blocking ELISA (1:10 diluted plasma samples) data were assessed with simple linear regression and 95% confidence bands (grey shading) of the best-fit line. Correlations between RBD IgM, IgG, and IgA data and RBD-ACE2 blocking ELISA results were done on the full sample set from inpatients (n = 714) and outpatients (n = 114). Plots show mean ELISA OD450 values of duplicate measurements and average percent neutralization from duplicate testing in each of two replicate experiments.
Fig. 4
Fig. 4. Development of anti-SARS-CoV-2 spike RBD antibody responses in SARS-CoV-2 rRT-PCR+ asymptomatic individuals and outpatients over time.
176 plasma samples from 136 SARS-CoV-2 rRT-PCR+ individuals were tested for RBD IgM and IgG. The x-axis indicates the time following the first positive rRT-PCR test (A). Dotted lines denote the assay cutoff for positive results. RBD IgM and IgG are shown for the latest available timepoint for subjects with low (Ct >12-25), middle (Ct >25-35) and high (Ct >35-40) SARS-CoV-2 rRT-PCR Ct at diagnosis (B). 45 plasma samples collected from 14 rRT-PCR+ asymptomatic individuals and outpatients sampled at monthly intervals (V1 = enrollment, V2 to V5 = months 1 to 4 post-enrollment) were tested for RBD IgM, IgG, IgA at a dilution of 1:100, as well as RBD-ACE2 blocking antibodies at a dilution of 1:10 (C). The 45 plasma samples were further tested for pseudoviral neutralization at a dilution of 1:1250 (D). Box-whisker ELISA OD450 and blocking/neutralization percent plots show the interquartile range as the box and the minimum and maximum values as the ends of the whiskers. Correlations between virus neutralization and RBD IgM, IgG, IgA, and RBD-ACE2 blocking are shown with superimposed simple linear regression and 95% confidence bands (grey shading) of the best-fit line (E). Plots show mean ELISA OD450 values of duplicate measurements and average percent neutralization from duplicate testing in each of two replicate experiments.
Fig. 5
Fig. 5. RBD/N and S1/N antibody response ratios in patients with different disease severity.
Ratios of RBD/N (A) and anti-S1/N (B) IgM, IgG, and IgA ELISA OD450 values are shown for outpatients (Outpt), hospitalized patients who did not (Admit) or did (ICU) require ICU care, and deceased patients (Death) over time. Box-whisker ELISA OD450 ratio plots illustrate the interquartile range as the box and the minimum and maximum values as the ends of the whiskers. Comparisons between groups were by the two-sided Wilcoxon rank sum test. * P < 0.05, ** P < 0.01, *** P < 0.001, **** P < 0.0001. The dotted line denotes an equal ratio of antigen-specific antibodies.
Fig. 6
Fig. 6. Correlations between anti-SARS-CoV-2 spike RBD antibody responses, spike pseudovirus neutralization activity, and viral RNA in individual hospitalized patients who did not require ICU care.
Individual patient plots show the development of RBD IgM, IgG, and IgA antibody responses (upper panels for each patient) and RBD-ACE2 blocking antibodies (lower panels for each patient) for all available plasma sample time points. Orange shading indicates time admitted in the hospital. Representative plots for individuals with no (Group 1), up to 25% (Group 2) and greater than 25% (Group 3) RBD-ACE2 blocking activity are shown. Plots for the remaining admitted patients are shown in fig. S10. Viral RNAemia and pseudovirus neutralization activity are displayed in the lower panels of patients in which these were measured. The time point and Ct value for the diagnostic NP swab SARS-CoV-2 rRT PCR is shown as a turquoise triangle in the lower panel.
Fig. 7
Fig. 7. Correlations between anti-SARS-CoV-2 spike RBD antibody responses, spike pseudovirus neutralization activity, and viral RNA in individual ICU patients.
Individual patient plots show the development of RBD IgM, IgG, and IgA antibody responses (upper panels for each patient) and RBD-ACE2 blocking antibodies (lower panels for each patient) for all available plasma sample time points. Orange shading indicates time admitted in the hospital, red shading represents the timeframe patients were treated in the ICU. Representative plots for individuals with no (Group 1), up to 25% (Group 2), and over 25% (Group 3) RBD-ACE2 blocking activity at the time point closest to discharge from hospital are shown here. Plots for the remaining ICU patients are shown in fig. S11A. The time point and Ct value for the diagnostic NP swab SARS-CoV-2 rRT PCR is shown as a turquoise triangle in the lower panel.
Fig. 8
Fig. 8. Correlations between anti-SARS-CoV-2 spike RBD antibody responses, spike pseudovirus neutralization activity, and viral RNA in individual deceased patients.
Individual patient plots show the development of RBD IgM, IgG, and IgA antibody responses (upper panels for each patient) and RBD-ACE2 blocking antibodies (lower panels for each patient) for all available plasma sample time points. Orange shading indicates time admitted in the hospital, while red shading represents the timeframe patients were treated in the ICU. The time of death is indicated in each plot with a star. Representative plots for individuals with no (Group 1), up to 25% (Group 2) and over 25% (Group 3) RBD-ACE2 blocking activity are shown here. Plots for the remaining deceased patients are shown in fig. S11B. The time point and Ct value for the diagnostic NP swab SARS-CoV-2 rRT PCR is shown as a turquoise triangle in the lower panel.

References

    1. Zhou P., Yang X.-L., Wang X.-G., Hu B., Zhang L., Zhang W., Si H.-R., Zhu Y., Li B., Huang C.-L., Chen H.-D., Chen J., Luo Y., Guo H., Jiang R.-D., Liu M.-Q., Chen Y., Shen X.-R., Wang X., Zheng X.-S., Zhao K., Chen Q.-J., Deng F., Liu L.-L., Yan B., Zhan F.-X., Wang Y.-Y., Xiao G.-F., Shi Z.-L., A pneumonia outbreak associated with a new coronavirus of probable bat origin. Nature 579, 270–273 (2020). 10.1038/s41586-020-2012-7 - DOI - PMC - PubMed
    1. Wu Z., McGoogan J. M., Characteristics of and Important Lessons From the Coronavirus Disease 2019 (COVID-19) Outbreak in China: Summary of a Report of 72 314 Cases From the Chinese Center for Disease Control and Prevention. JAMA 323, 1239–1242 (2020). 10.1001/jama.2020.2648 - DOI - PubMed
    1. Huang C., Wang Y., Li X., Ren L., Zhao J., Hu Y., Zhang L., Fan G., Xu J., Gu X., Cheng Z., Yu T., Xia J., Wei Y., Wu W., Xie X., Yin W., Li H., Liu M., Xiao Y., Gao H., Guo L., Xie J., Wang G., Jiang R., Gao Z., Jin Q., Wang J., Cao B., Clinical features of patients infected with 2019 novel coronavirus in Wuhan, China. Lancet 395, 497–506 (2020). 10.1016/S0140-6736(20)30183-5 - DOI - PMC - PubMed
    1. Chen N., Zhou M., Dong X., Qu J., Gong F., Han Y., Qiu Y., Wang J., Liu Y., Wei Y., Xia J., Yu T., Zhang X., Zhang L., Epidemiological and clinical characteristics of 99 cases of 2019 novel coronavirus pneumonia in Wuhan, China: A descriptive study. Lancet 395, 507–513 (2020). 10.1016/S0140-6736(20)30211-7 - DOI - PMC - PubMed
    1. Zhou F., Yu T., Du R., Fan G., Liu Y., Liu Z., Xiang J., Wang Y., Song B., Gu X., Guan L., Wei Y., Li H., Wu X., Xu J., Tu S., Zhang Y., Chen H., Cao B., Clinical course and risk factors for mortality of adult inpatients with COVID-19 in Wuhan, China: A retrospective cohort study. Lancet 395, 1054–1062 (2020). 10.1016/S0140-6736(20)30566-3 - DOI - PMC - PubMed

Publication types

MeSH terms

Substances