Comparative Study
. 2021 Jan 20;13(577):eabd2223.
doi: 10.1126/scitranslmed.abd2223. Epub 2020 Dec 7.

IgA dominates the early neutralizing antibody response to SARS-CoV-2

Affiliations
Comparative Study

IgA dominates the early neutralizing antibody response to SARS-CoV-2

Delphine Sterlin et al. Sci Transl Med. .

Abstract

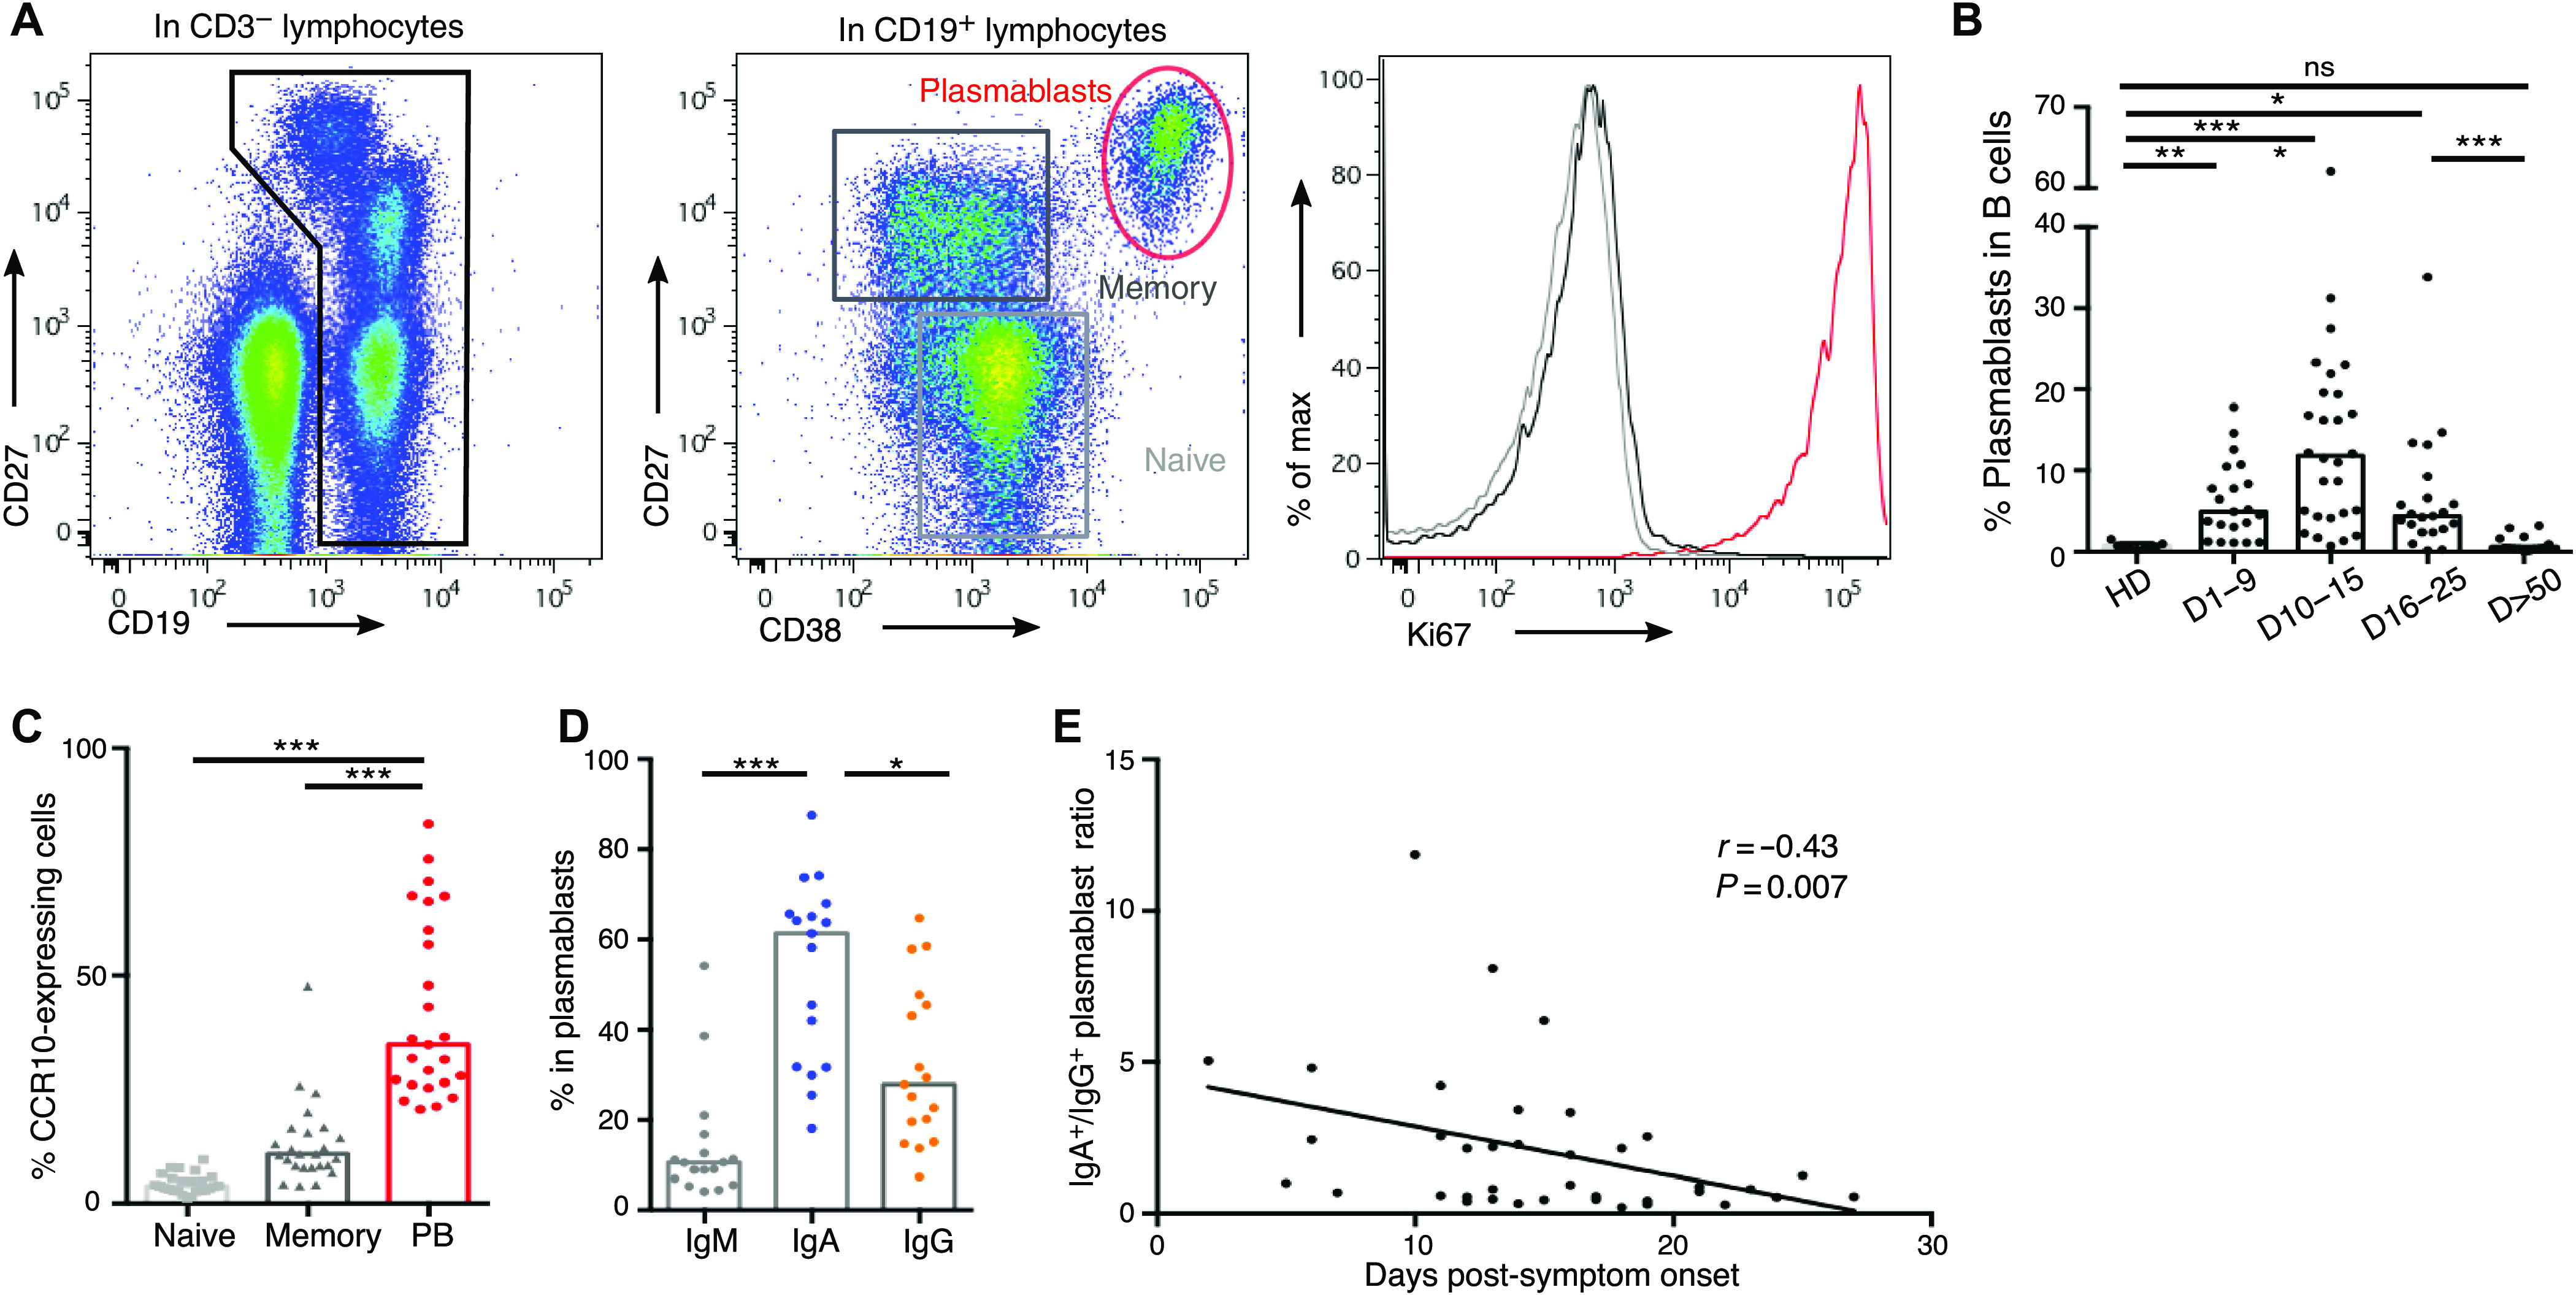
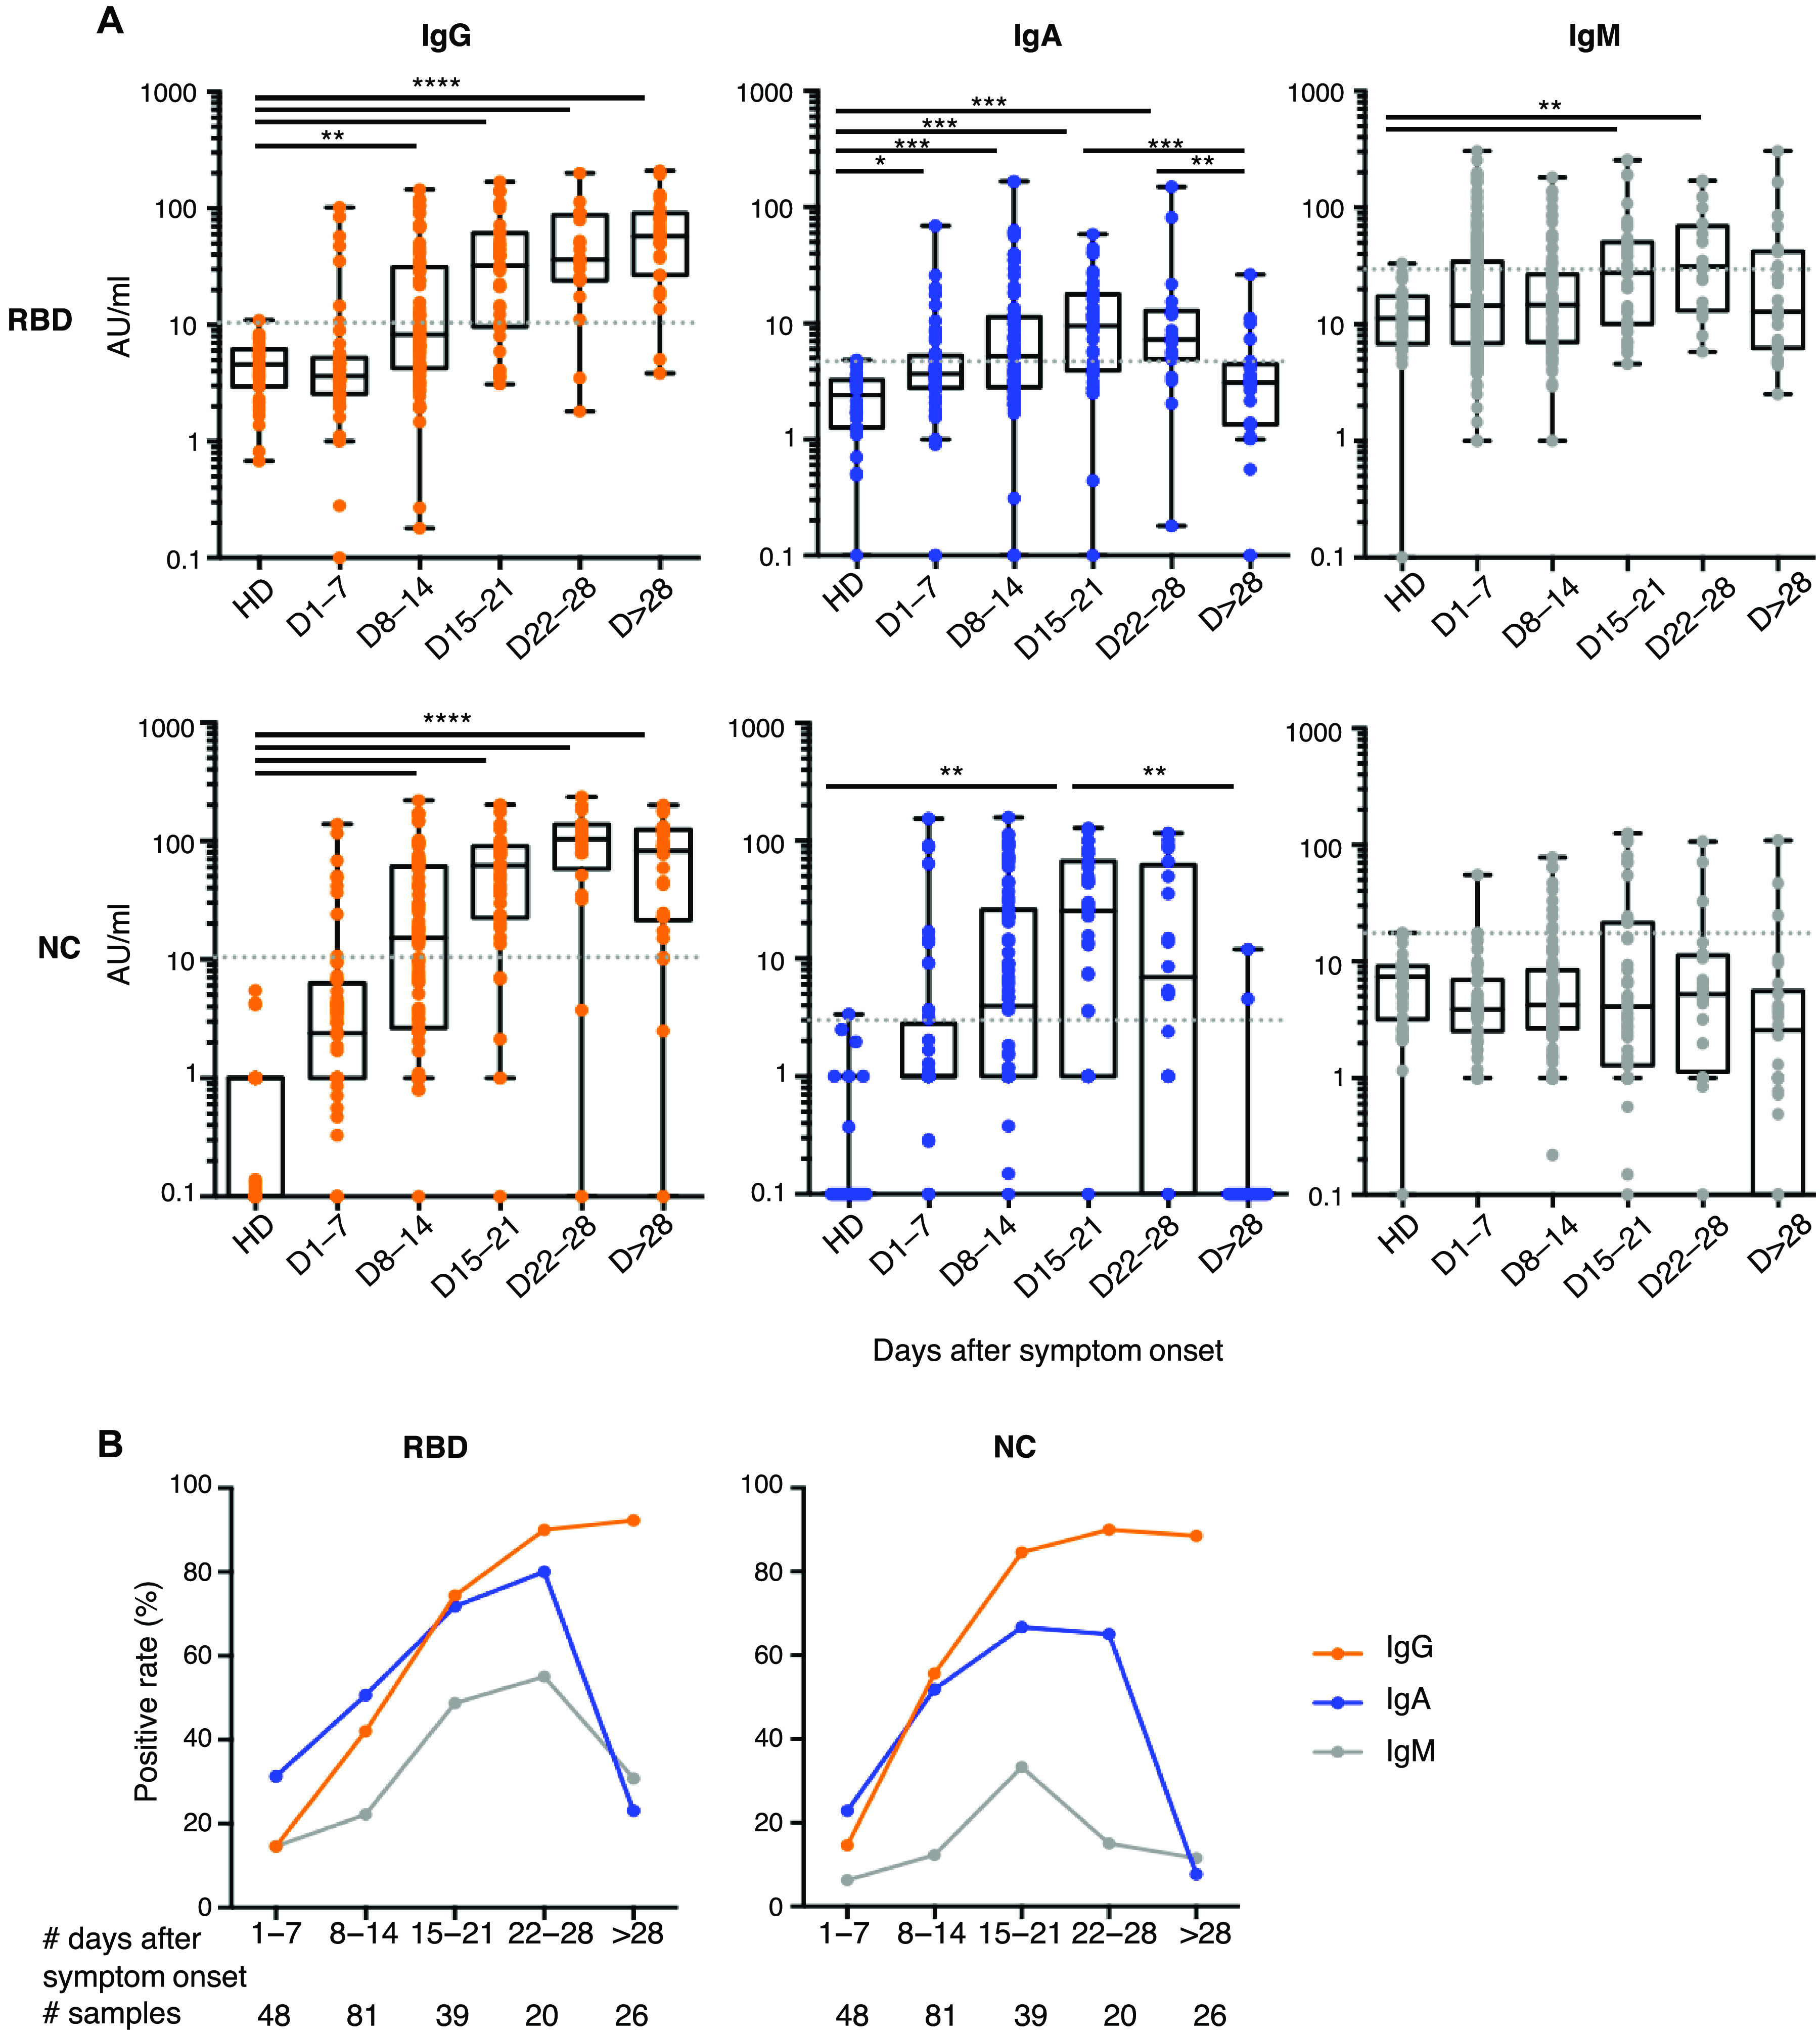
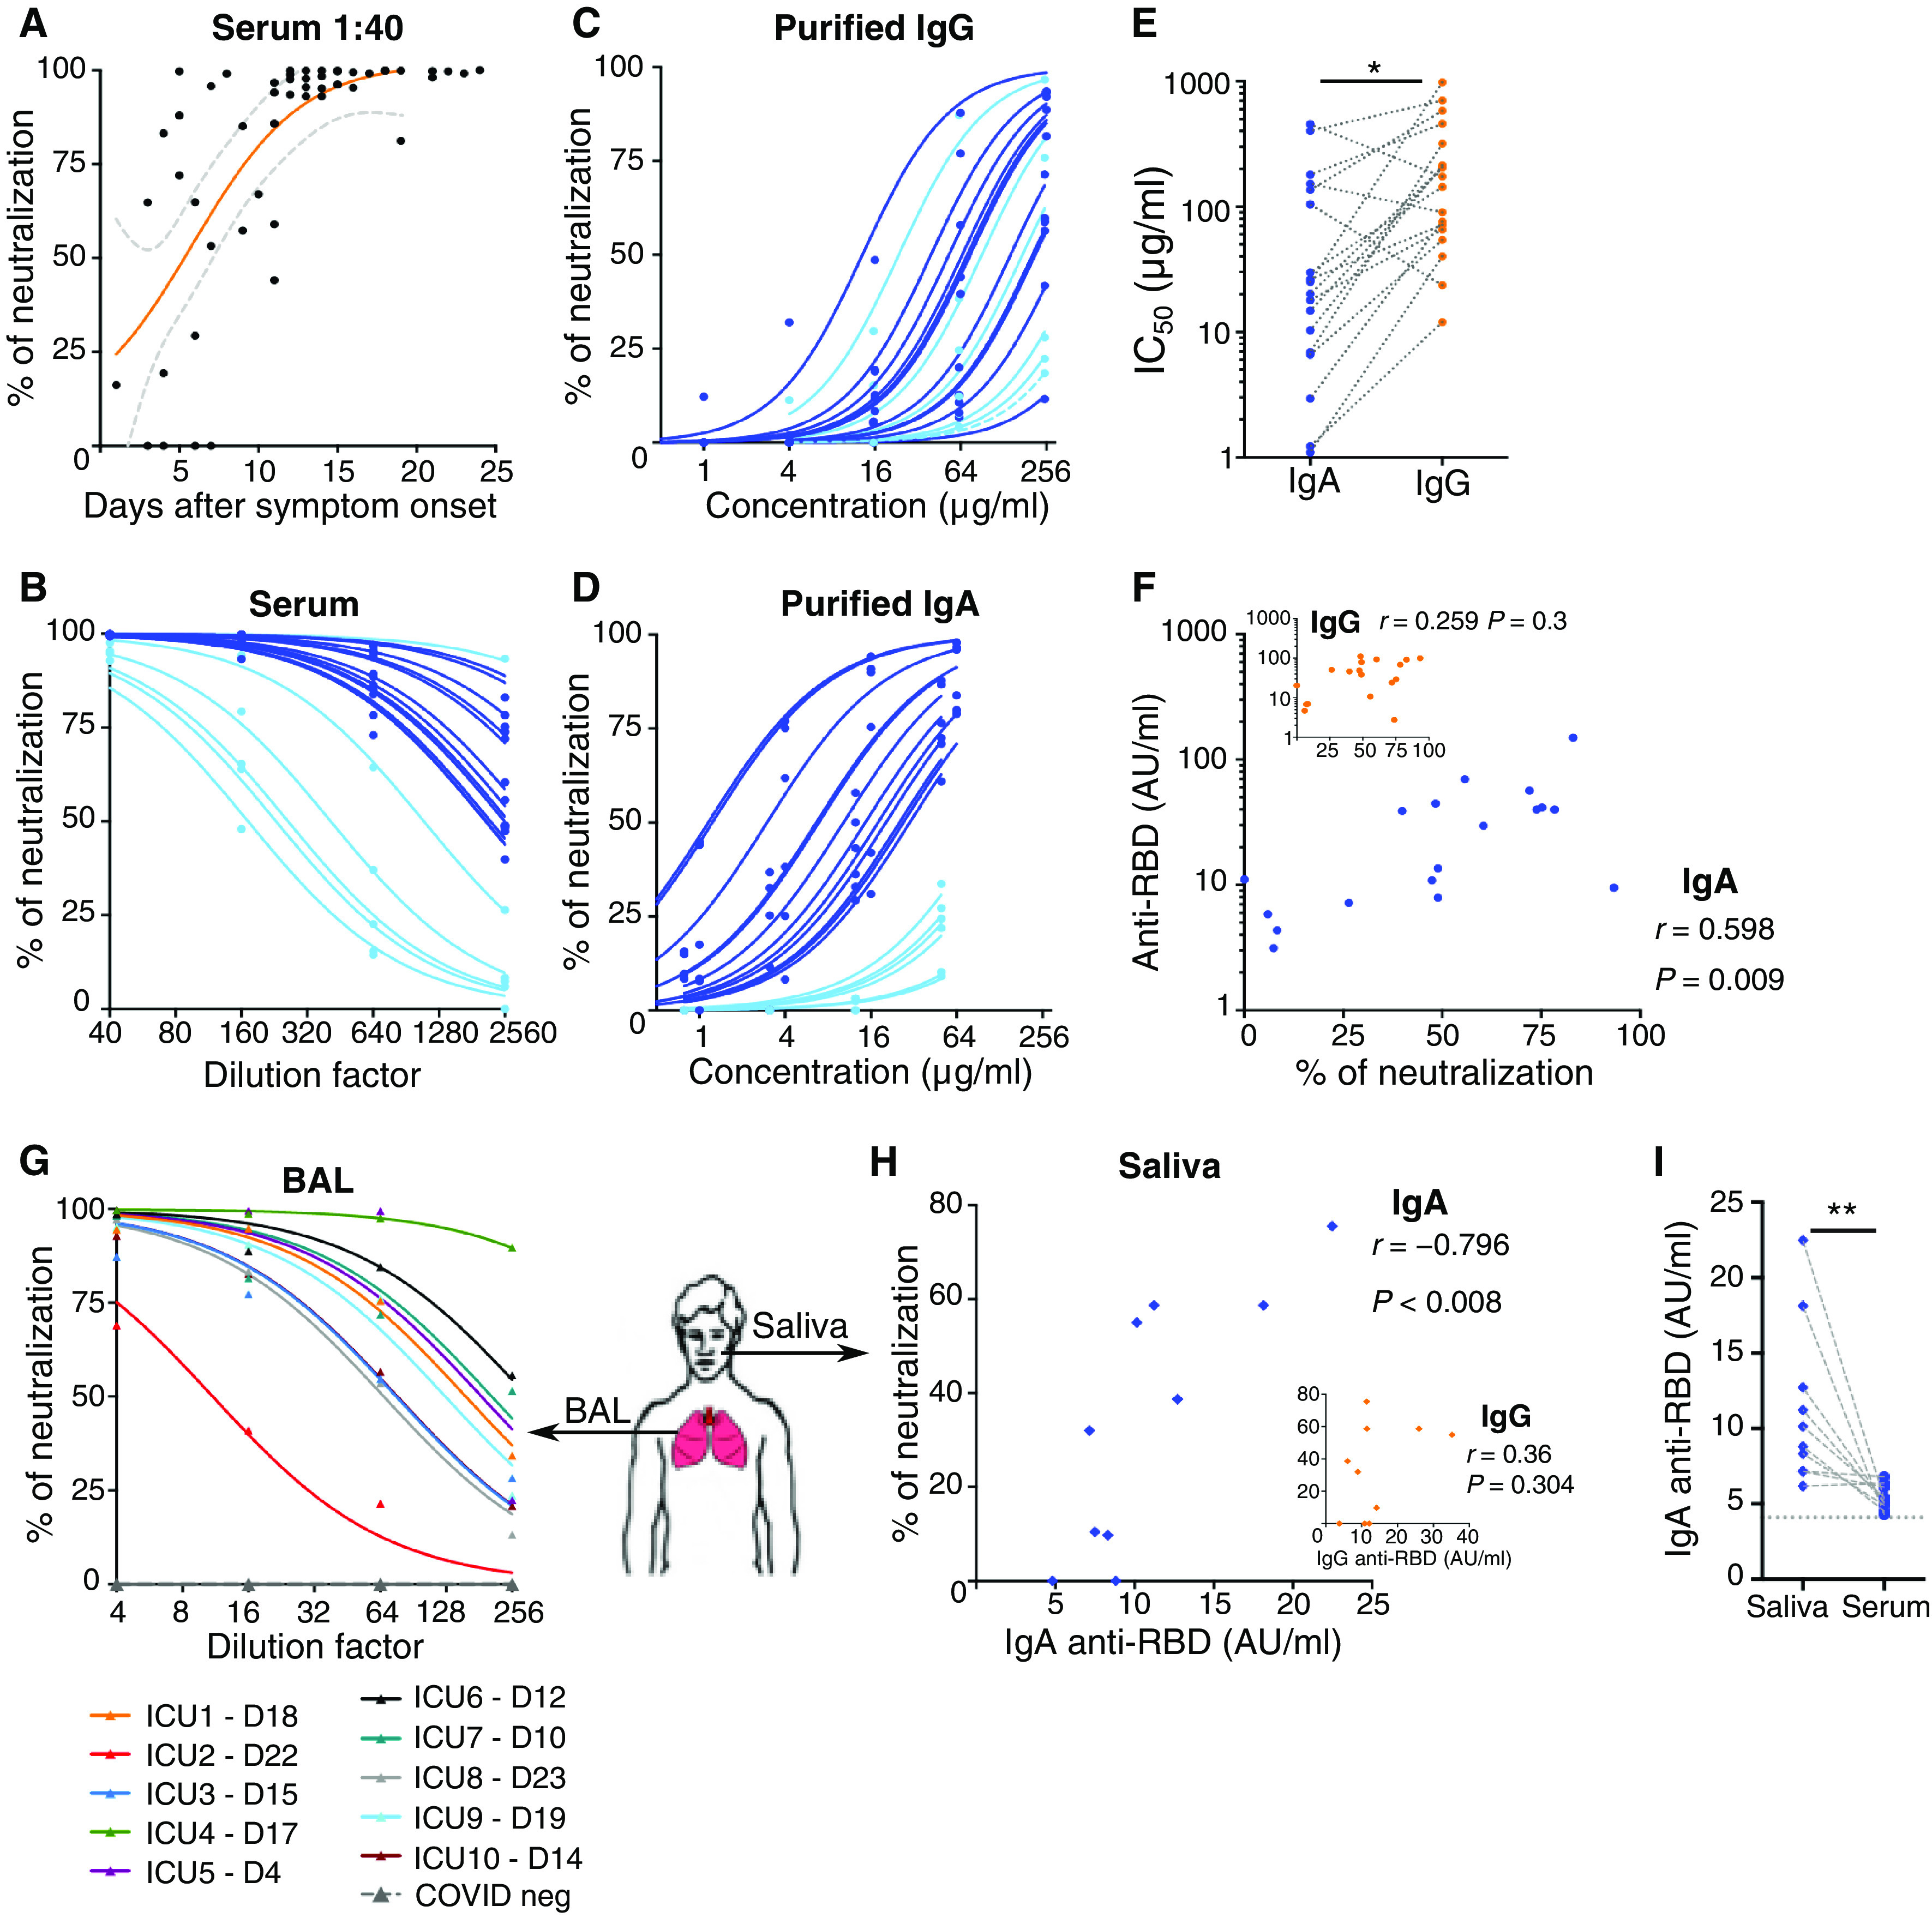
Humoral immune responses are typically characterized by primary IgM antibody responses followed by secondary antibody responses associated with immune memory and composed of IgG, IgA, and IgE. Here, we measured acute humoral responses to SARS-CoV-2, including the frequency of antibody-secreting cells and the presence of SARS-CoV-2-specific neutralizing antibodies in the serum, saliva, and bronchoalveolar fluid of 159 patients with COVID-19. Early SARS-CoV-2-specific humoral responses were dominated by IgA antibodies. Peripheral expansion of IgA plasmablasts with mucosal homing potential was detected shortly after the onset of symptoms and peaked during the third week of the disease. The virus-specific antibody responses included IgG, IgM, and IgA, but IgA contributed to virus neutralization to a greater extent compared with IgG. Specific IgA serum concentrations decreased notably 1 month after the onset of symptoms, but neutralizing IgA remained detectable in saliva for a longer time (days 49 to 73 post-symptoms). These results represent a critical observation given the emerging information as to the types of antibodies associated with optimal protection against reinfection and whether vaccine regimens should consider targeting a potent but potentially short-lived IgA response.


Figures

Fig. 1
Fig. 1. Plasmablast dynamics after SARS-CoV-2 infection.
(A) Representative flow cytometry analysis of B cell subpopulations in the blood of SARS-CoV-2–infected patients. Doublets and dead cells were excluded before CD3CD19+ gating. Plasmablasts are defined as Ki67+CD19lowCD27highCD38high cells, memory B cells as Ki67CD19+CD27+IgD, and naive B cells as Ki67CD19+CD27IgD+ cells. (B) Plasmablast frequency in B cell compartment in blood of SARS-CoV-2–infected patients (n = 38, clinical characteristics in table S1) compared with healthy donors (HD; n = 9). Histograms represent medians. P values were calculated using Dunn’s multiple comparison test (*P < 0.05, **P < 0.01, and ***P < 0.001). ns, not significant. (C) Flow cytometry analysis of CCR10 expression in B cell subpopulations in blood of SARS-CoV-2–infected patients (n = 25). Samples used in this analysis were collected from day 3 to day 27 after symptom onset. Histograms represent medians. P values were calculated using Wilcoxon test (***P < 0.001). (D) Intracellular antibody expression in circulating plasmablasts in blood of SARS-CoV-2–infected patients (n = 17) using flow cytometry. Samples used in this analysis were collected from days 2 to 23 after symptom onset. Histograms represent medians. P values were calculated using Dunn’s multiple comparison test (*P < 0.05 and ***P < 0.001). (E) Intracellular IgA versus IgG expression in plasmablasts according to disease duration. Each dot represents one patient. Nonparametric Spearman correlation was calculated.
Fig. 2
Fig. 2. Antibody response kinetics to SARS-CoV-2 proteins.
(A) Specific IgG, IgA, and IgM against spike-1 receptor-binding domain (RBD) and nucleocapsid protein (NC) were measured using photonic ring immunoassay in 132 patients (clinical characteristics detailed in tables S2 and S3). Antibody levels are expressed as arbitrary units/ml (AU/ml). Cutoff lines are represented as gray dotted lines. The boxplots show medians (middle line) and first and third quartiles, and the whiskers indicate minimal and maximal values. P value was calculated using Dunn’s multiple comparison test (*P < 0.05, **P < 0.01, ***P < 0.001, and ****P < 0.0001). (B) Positive rates of specific serum IgG, IgA, and IgM in 132 patients at different times after symptom onset, from days 1 to 78.
Fig. 3
Fig. 3. Neutralizing activity of serum, BAL and saliva antibodies to SARS-CoV-2.
(A) Neutralizing activity of 52 sera (dilution of 1:40) from 38 SARS-CoV-2–infected patients (see clinical characteristics in table S1) was determined using a pseudovirus neutralization assay. Orange curve represents significant sigmoidal interpolation (P = 0.0082). Gray dotted curves represent 95% confidence intervals. (B) Neutralizing activity of 18 sera measured by pseudovirus neutralization assay at different indicated dilutions. Samples used for this analysis were collected between days 6 and 24 after symptom onset. Light blue color corresponds to samples with low IgA neutralization potential. (C) Neutralizing activity of purified IgG was measured at indicated concentrations from 18 sera collected between day 6 and day 24 post-symptom onset. Curves were drawn according to nonlinear regression. Light blue color corresponds to samples with low IgA neutralization potential. (D) Neutralizing activity of purified IgA from paired samples in (C). Light blue color corresponds to samples with low IgA neutralization potential. (E) Paired purified IgA and IgG IC50 values in samples tested in (C) and (D). P value was calculated using Wilcoxon test (*P < 0.05). (F) Comparison of serum anti-RBD IgA (main panel) or IgG (inset) levels measured by photonic ring immunoassay with neutralizing capacity of corresponding purified isotypes measured by pseudovirus neutralization assay. Spearman coefficient (r) and P value (P) are indicated. (G) Neutralizing activity of bronchoalveolar lavages (BALs) collected in 10 SARS-CoV-2 patients between days 4 and 23 after symptom onset (clinical characteristics are detailed in table S5). Indicated BAL dilutions were tested using pseudovirus neutralization assay. BALs obtained from SARS-CoV-2–negative patients (n = 3) showed no neutralization activity (dotted gray lines). Each colored line represents one patient. (H) Neutralizing activity and anti-RBD IgA levels (both tested at a dilution of 1:4) of saliva collected in 10 SARS-CoV-2 patients between days 49 and 73 after symptom onset. r and P are indicated. (I) Anti-RBD levels in paired saliva and serum from patients tested in (H). P value was calculated using Wilcoxon test (**P < 0.01).

References

    1. Su S., Wong G., Shi W., Liu J., Lai A. C. K., Zhou J., Liu W., Bi Y., Gao G. F., Epidemiology, genetic recombination, and pathogenesis of coronaviruses. Trends Microbiol. 24, 490–502 (2016). - PMC - PubMed
    1. Long Q.-X., Liu B.-Z., Deng H.-J., Wu G.-C., Deng K., Chen Y.-K., Liao P., Qiu J.-F., Lin Y., Cai X.-F., Wang D.-Q., Hu Y., Ren J.-H., Tang N., Xu Y.-Y., Yu L.-H., Mo Z., Gong F., Zhang X.-L., Tian W.-G., Hu L., Zhang X.-X., Xiang J.-L., Du H.-X., Liu H.-W., Lang C.-H., Luo X.-H., Wu S.-B., Cui X.-P., Zhou Z., Zhu M.-M., Wang J., Xue C.-J., Li X.-F., Wang L., Li Z.-J., Wang K., Niu C.-C., Yang Q.-J., Tang X.-J., Zhang Y., Liu X.-M., Li J.-J., Zhang D.-C., Zhang F., Liu P., Yuan J., Li Q., Hu J.-L., Chen J., Huang A.-L., Antibody responses to SARS-CoV-2 in patients with COVID-19. Nat. Med. 26, 845–848 (2020). - PubMed
    1. Guo L., Ren L., Yang S., Xiao M., Chang D., Yang F., Dela Cruz C. S., Wang Y., Wu C., Xiao Y., Zhang L., Han L., Dang S., Xu Y., Yang Q.-W., Xu S.-Y., Zhu H.-D., Xu Y.-C., Jin Q., Sharma L., Wang L., Wang J., Profiling early humoral response to diagnose novel coronavirus disease (COVID-19). Clin. Infect. Dis. 71, 778–785 (2020). - PMC - PubMed
    1. Okba N. M. A., Müller M. A., Li W., Wang C., GeurtsvanKessel C. H., Corman V. M., Lamers M. M., Sikkema R. S., de Bruin E., Chandler F. D., Yazdanpanah Y., Le Hingrat Q., Descamps D., Houhou-Fidouh N., Reusken C. B. E. M., Bosch B.-J., Drosten C., Koopmans M. P. G., Haagmans B. L., Severe acute respiratory syndrome coronavirus 2-specific antibody responses in coronavirus disease patients. Emerg. Infect. Dis. 26, 1478–1488 (2020). - PMC - PubMed
    1. Mazanec M. B., Coudret C. L., Fletcher D. R., Intracellular neutralization of influenza virus by immunoglobulin A anti-hemagglutinin monoclonal antibodies. J. Virol. 69, 1339–1343 (1995). - PMC - PubMed

Publication types

MeSH terms