. 2020 Dec 22;117(51):32251-32259.
doi: 10.1073/pnas.2011504117. Epub 2020 Dec 7.

The mechanoresponse of bone is closely related to the osteocyte lacunocanalicular network architecture

Affiliations

The mechanoresponse of bone is closely related to the osteocyte lacunocanalicular network architecture

Alexander Franciscus van Tol et al. Proc Natl Acad Sci U S A. .

Abstract

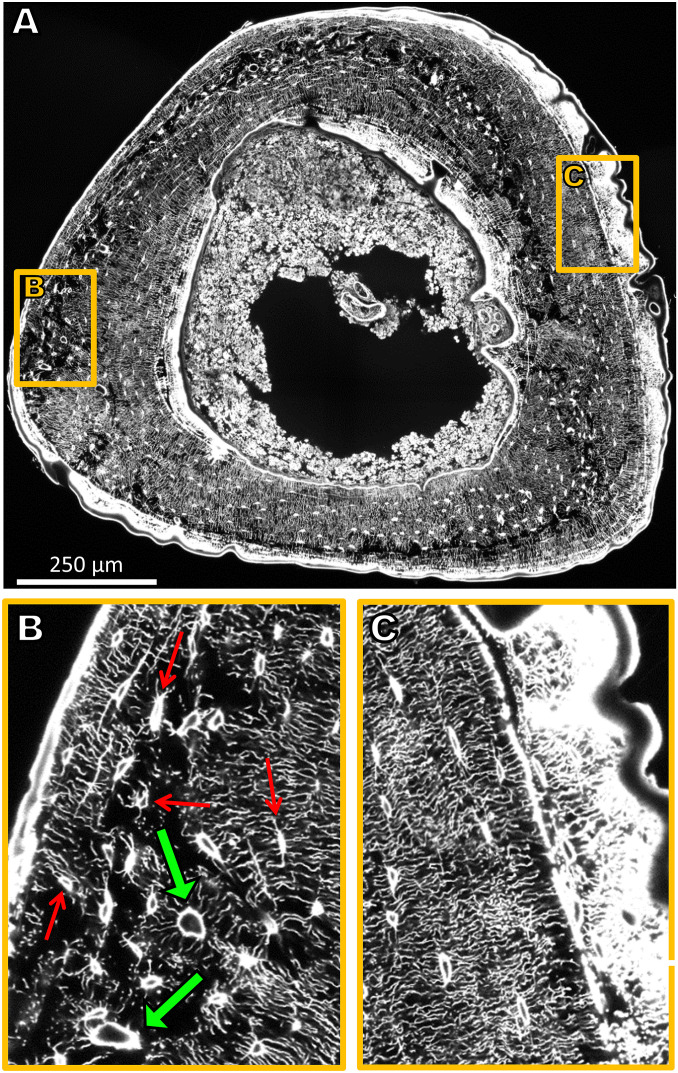
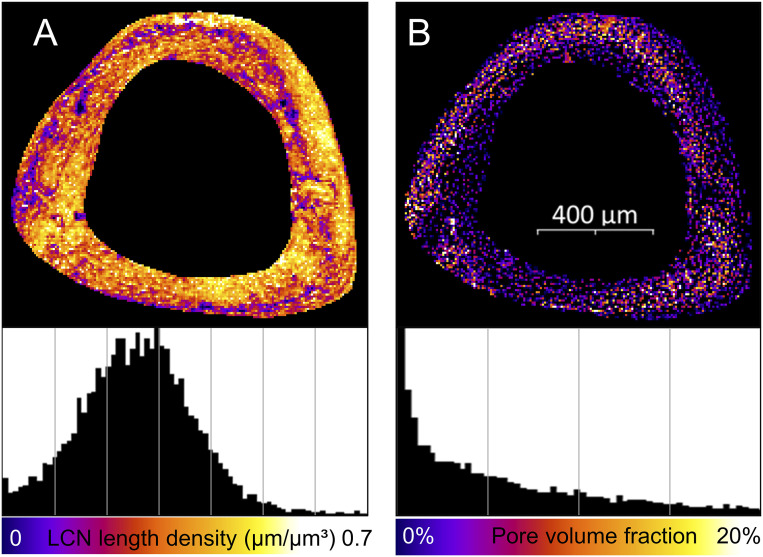
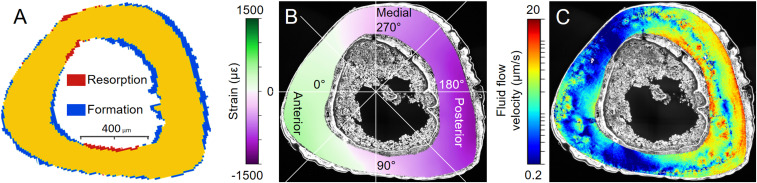
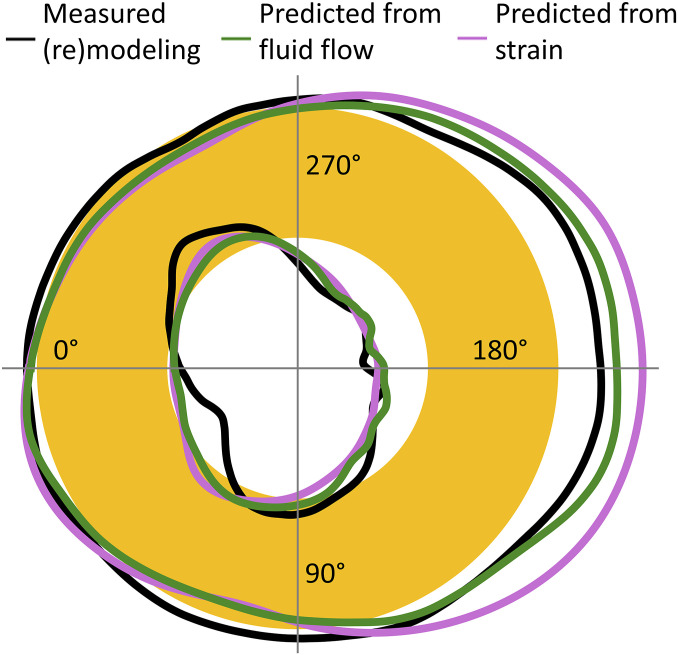
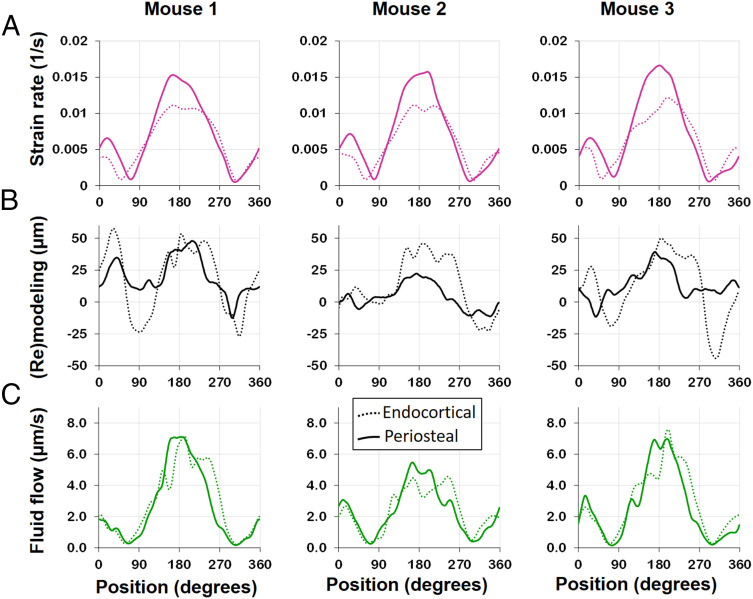
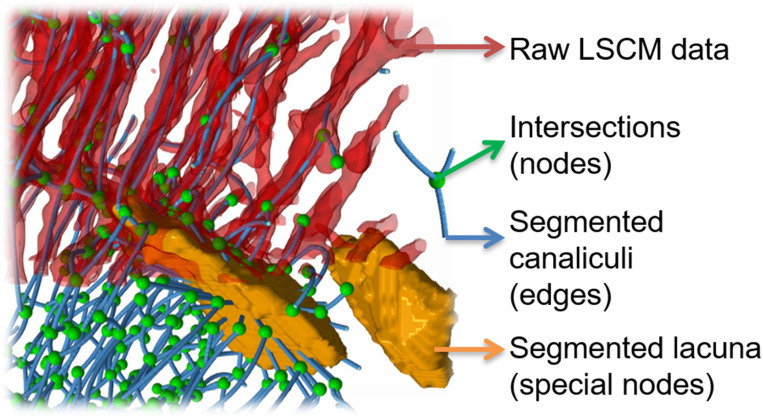
Organisms rely on mechanosensing mechanisms to adapt to changes in their mechanical environment. Fluid-filled network structures not only ensure efficient transport but can also be employed for mechanosensation. The lacunocanalicular network (LCN) is a fluid-filled network structure, which pervades our bones and accommodates a cell network of osteocytes. For the mechanism of mechanosensation, it was hypothesized that load-induced fluid flow results in forces that can be sensed by the cells. We use a controlled in vivo loading experiment on murine tibiae to test this hypothesis, whereby the mechanoresponse was quantified experimentally by in vivo micro-computed tomography (µCT) in terms of formed and resorbed bone volume. By imaging the LCN using confocal microscopy in bone volumes covering the entire cross-section of mouse tibiae and by calculating the fluid flow in the three-dimensional (3D) network, we could perform a direct comparison between predictions based on fluid flow velocity and the experimentally measured mechanoresponse. While local strain distributions estimated by finite-element analysis incorrectly predicts preferred bone formation on the periosteal surface, we demonstrate that additional consideration of the LCN architecture not only corrects this erroneous bias in the prediction but also explains observed differences in the mechanosensitivity between the three investigated mice. We also identified the presence of vascular channels as an important mechanism to locally reduce fluid flow. Flow velocities increased for a convergent network structure where all of the flow is channeled into fewer canaliculi. We conclude that, besides mechanical loading, LCN architecture should be considered as a key determinant of bone adaptation.

Keywords: bone adaptation; fluid flow; in vivo µCT; lacunocanalicular network; mechanobiology.


Conflict of interest statement

The authors declare no competing interest.

Figures

Fig. 1.
Fig. 1.
(A) Sixteen confocal laser-scanning microscopy (CLSM) image stacks stitched together amounting to a volume of 1,000 × 1,200 × 50 µm3 and covering the complete cross-section of the tibia. Due to the rhodamine staining, osteocyte lacunae and canaliculi are clearly visible. For reasons of presentation, a single 2D section of the 3D image is shown. (B) Enlargement of a region close to the periosteal surface with a loose network of low connectivity comprising vascular channels (green arrows). Some lacunae are marked with thin red arrows. (C) Enlargement of a region close to the periosteal surface with a dense, ordered, and well-connected LCN architecture. Newly formed bone as a response to mechanical stimulation (to the Right) is highly stained and, therefore, appears bright white.
Fig. 2.
Fig. 2.
Structural heterogeneity of the lacunocanalicular network (LCN) within the tibial cross-section averaged over the imaging depth of 50 µm. (A) Map of the canalicular density (Ca.Dn, total length of canaliculi per unit volume). (B) Map of the pore density (i.e., volume of both lacunae and vascular canals per unit volume). Below, frequency distributions are shown for both quantities with x-axis ticks as lines.
Fig. 3.
Fig. 3.
(A) Outcome of the in vivo µCT experiment showing where in the diaphyseal region of the tibia, bone was formed or resorbed in response to mechanical loading (blue denotes newly formed bone, red resorbed bone, and yellow quiescent bone; 2D cross-section of an imaged 3D volume). (B) Spatial distribution of the peak strains induced by the in vivo loading experiment calculated using FE modeling. Green colors correspond to tensile, and violet to compressive strains. The figure also introduces the angular coordinate system used to indicate locations at the endocortical and periosteal surfaces. The anterior direction is at 15°, and angles increase counterclockwise. (C) Pattern of fluid flow velocities through the LCN. Based on the loading conditions from B and the 3D network architecture of Fig. 1A, the fluid flow velocity is calculated in each canaliculus using circuit theory. The fluid flow velocity information of all of the canaliculi was rendered in a 3D image stack. For reasons of presentation, this 3D image is averaged over the imaging depth to obtain the shown flow pattern. Results shown are for mouse 1 (Fig. 5).
Fig. 4.
Fig. 4.
Result of in vivo µCT measurements in terms of bone formation and resorption after 2 wk of controlled loading of the tibia. The tibial cross-section is represented schematically as a circular annulus (yellow). The black line denotes the amount of resorbed bone (line entering yellow cortex) and formed bone (depiction not to scale). The pink line denotes the prediction of the mechanoresponse based on strain only; the green line is the prediction based on load-induced fluid flow, which considers not only the loading condition but also the architecture of the lacunocanalicular network (LCN). Strain rate and fluid flow velocity were integrated over regions close to the surface (Materials and Methods) to obtain a single value.
Fig. 5.
Fig. 5.
Evaluation of absolute surface strain rate (A), (re)modeling thickness (B), defined as new bone thickness minus resorption cavity depth, and surface fluid flow velocity (C) for all three investigated mice (see Fig. 3B for definition of angles). Strain rate and fluid flow velocity were integrated over regions close to the surface (Materials and Methods) to obtain a single value. (A) Strain rates at the endocortical surface (dotted line) are lower compared to the periosteal surface (solid line), and the spatial distribution and peak values are very similar between mice. (B) The mechanoresponse shows individual differences in bone (re)modeling, with mouse 2 showing less (re)modeling compared to the two other mice. (C) Also surface fluid velocity was found to be lower in mouse 2, while for all animals the flow velocities show similar distributions on the endocortical and periosteal surfaces.
Fig. 6.
Fig. 6.
Different stages of the image analysis methods of confocal laser-scanning microscopy (CLSM) data. After thresholding of CLSM raw data with a fixed threshold, segmentation (based on bulkiness and local change in curvature by “expanding” the lacunae into the canaliculi) allows a separation between canaliculi (red tubes) and lacunae (orange blobs) (36). Skeletonization converts the image into a mathematical network with edges representing canaliculi (blue lines) and nodes representing intersection between canaliculi (green spheres) and lacunae.

References

    1. Verbruggen S. W., Mechanobiology in Health and Disease (Academic Press, 2018).
    1. le Noble F., et al. , Control of arterial branching morphogenesis in embryogenesis: Go with the flow. Cardiovasc. Res. 65, 619–628 (2005). - PubMed
    1. Gilbert R. M., Morgan J. T., Marcin E. S., Gleghorn J. P., Fluid mechanics as a driver of tissue-scale mechanical signaling in organogenesis. Curr. Pathobiol. Rep. 4, 199–208 (2016). - PMC - PubMed
    1. Tschumperlin D. J., Boudreault F., Liu F., Recent advances and new opportunities in lung mechanobiology. J. Biomech. 43, 99–107 (2010). - PMC - PubMed
    1. Klein-Nulend J., Bakker A. D., Bacabac R. G., Vatsa A., Weinbaum S., Mechanosensation and transduction in osteocytes. Bone 54, 182–190 (2013). - PubMed

Publication types

Grants and funding

LinkOut - more resources