

Comparing crime rates between undocumented immigrants, legal immigrants, and native-born US citizens in Texas
- PMID: 33288713
- PMCID: PMC7768760
- DOI: 10.1073/pnas.2014704117
Comparing crime rates between undocumented immigrants, legal immigrants, and native-born US citizens in Texas
Abstract
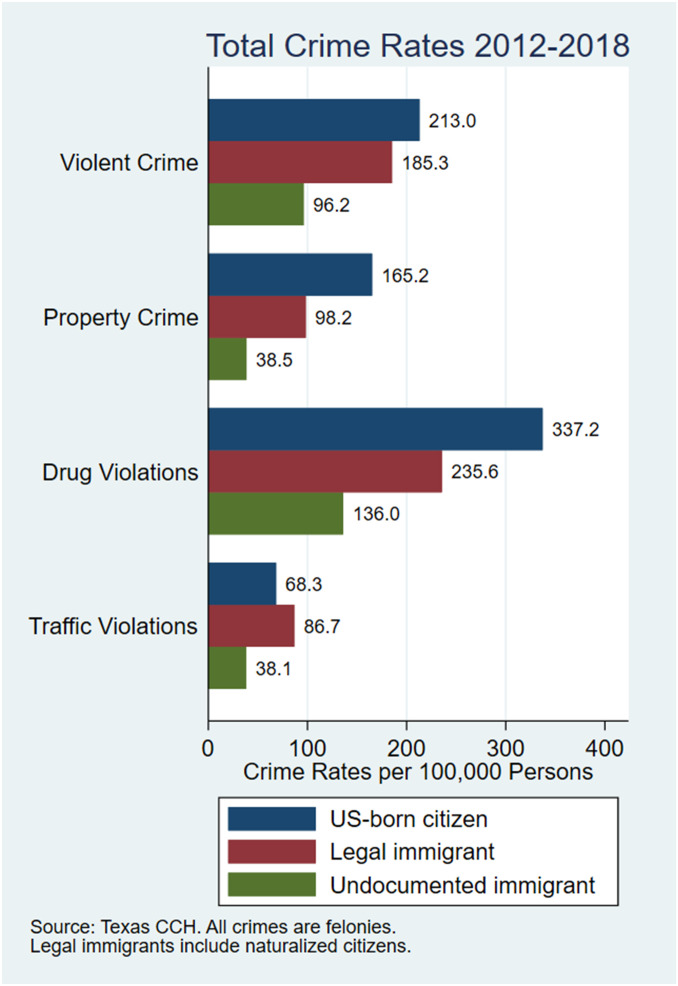
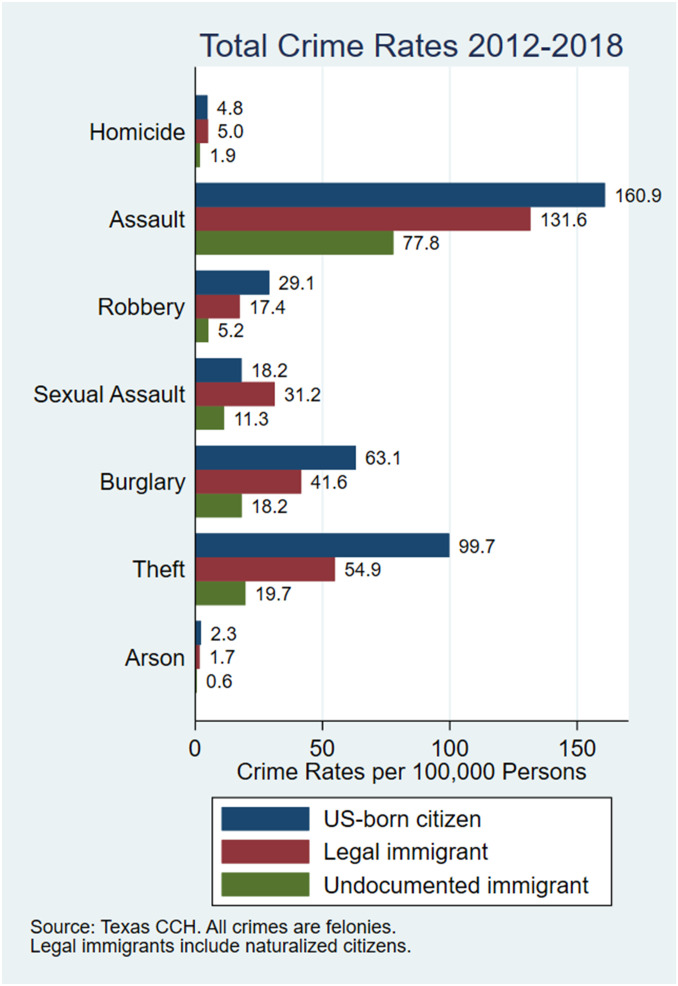
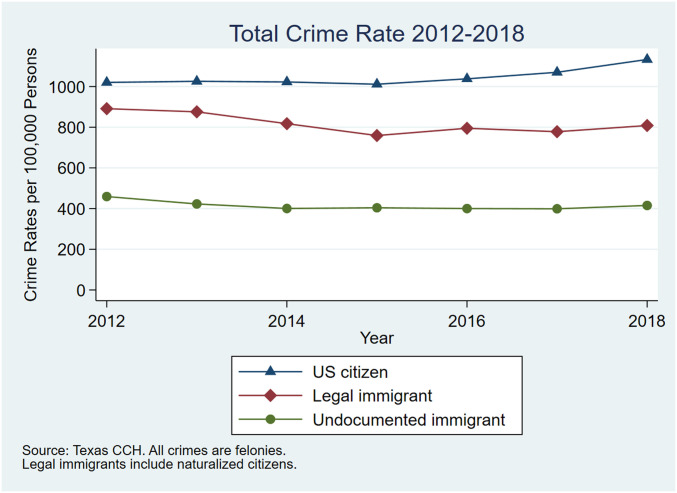
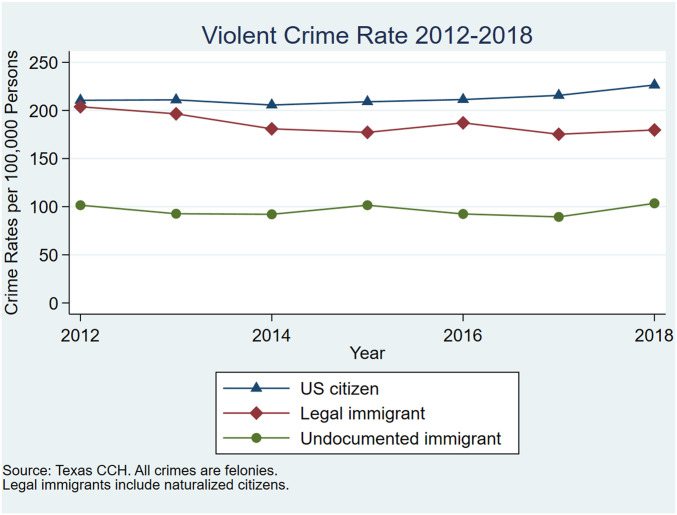
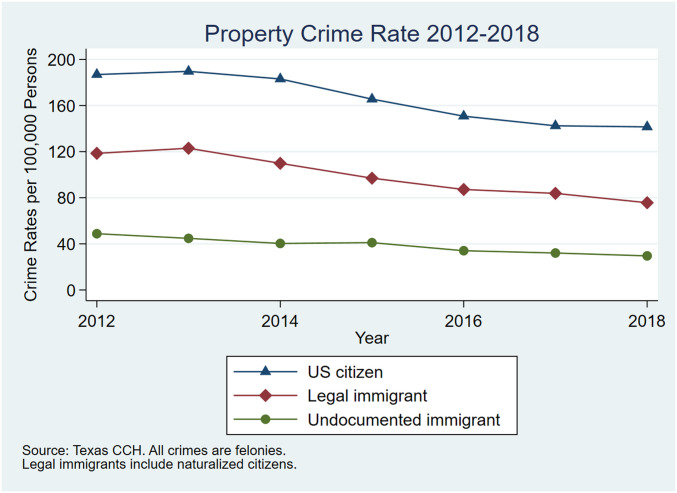
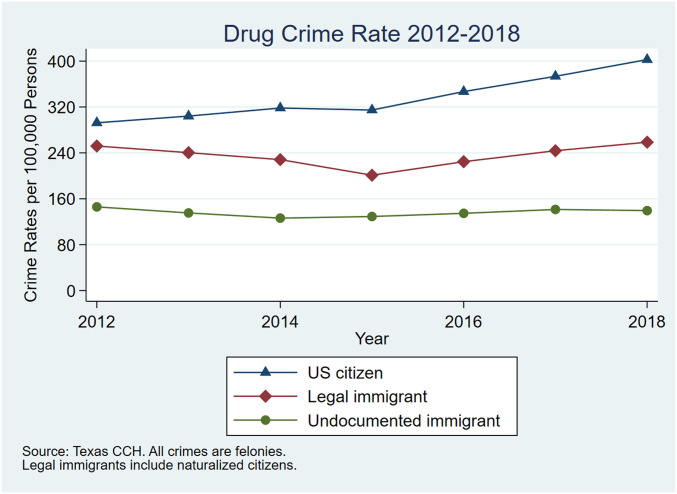
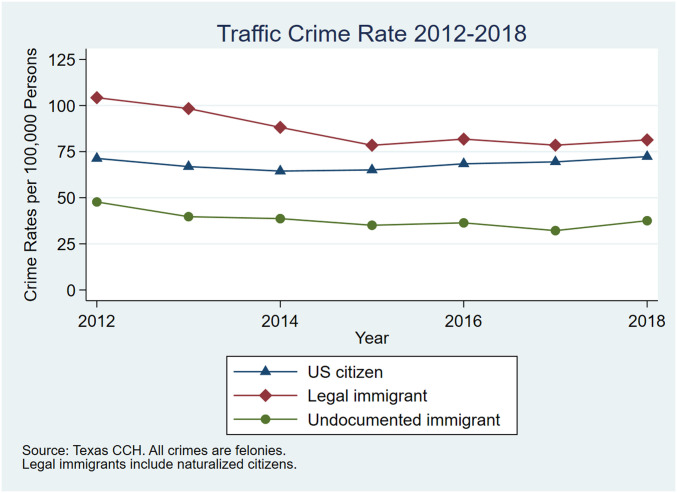
We make use of uniquely comprehensive arrest data from the Texas Department of Public Safety to compare the criminality of undocumented immigrants to legal immigrants and native-born US citizens between 2012 and 2018. We find that undocumented immigrants have substantially lower crime rates than native-born citizens and legal immigrants across a range of felony offenses. Relative to undocumented immigrants, US-born citizens are over 2 times more likely to be arrested for violent crimes, 2.5 times more likely to be arrested for drug crimes, and over 4 times more likely to be arrested for property crimes. In addition, the proportion of arrests involving undocumented immigrants in Texas was relatively stable or decreasing over this period. The differences between US-born citizens and undocumented immigrants are robust to using alternative estimates of the broader undocumented population, alternate classifications of those counted as "undocumented" at arrest and substituting misdemeanors or convictions as measures of crime.
Keywords: crime; undocumented immigration; violence.
Copyright © 2020 the Author(s). Published by PNAS.
Conflict of interest statement
The authors declare no competing interest.
Figures
References
-
- Manuel Krogstad J., Passel J. S., Cohn D’Vera, “5 facts about illegal immigration in the US” (Pew Research Center, Washington, DC, 2019).
-
- Bohn S., Lofstrom M., Raphael S., Did the 2007 Legal Arizona Workers Act reduce the state’s unauthorized immigrant population. Rev. Econ. Stat. 96, 258–269 (2014).
-
- Petition for writ of certiorari of petitioner United States of America, United States of America v. State of California, 590 U. S. _ 2020 (No. 19-532). https://www.supremecourt.gov/docket/docketfiles/html/public/19-532.html. (2020). Accessed 19 November 2020.
-
- Capps R., Chishti M., Gelatt J., Bolter J., Ruiz Soto A. G., “Revving up the deportation machinery: Enforcement and pushback under Trump” (Migration Policy Institute, Washington, DC, 2018).
-
- Meissner D., Kerwin D. M., Chishti M., Bergeron C., Immigration Enforcement in the United States: The Rise of a Formidable Machinery (Migration Policy Institute, Washington, DC, 2013).
Publication types
LinkOut - more resources
Full Text Sources
