. 2020 Dec 22;117(51):32806-32815.
doi: 10.1073/pnas.2020197117. Epub 2020 Dec 7.

DIA-based systems biology approach unveils E3 ubiquitin ligase-dependent responses to a metabolic shift

Affiliations

DIA-based systems biology approach unveils E3 ubiquitin ligase-dependent responses to a metabolic shift

Ozge Karayel et al. Proc Natl Acad Sci U S A. .

Abstract

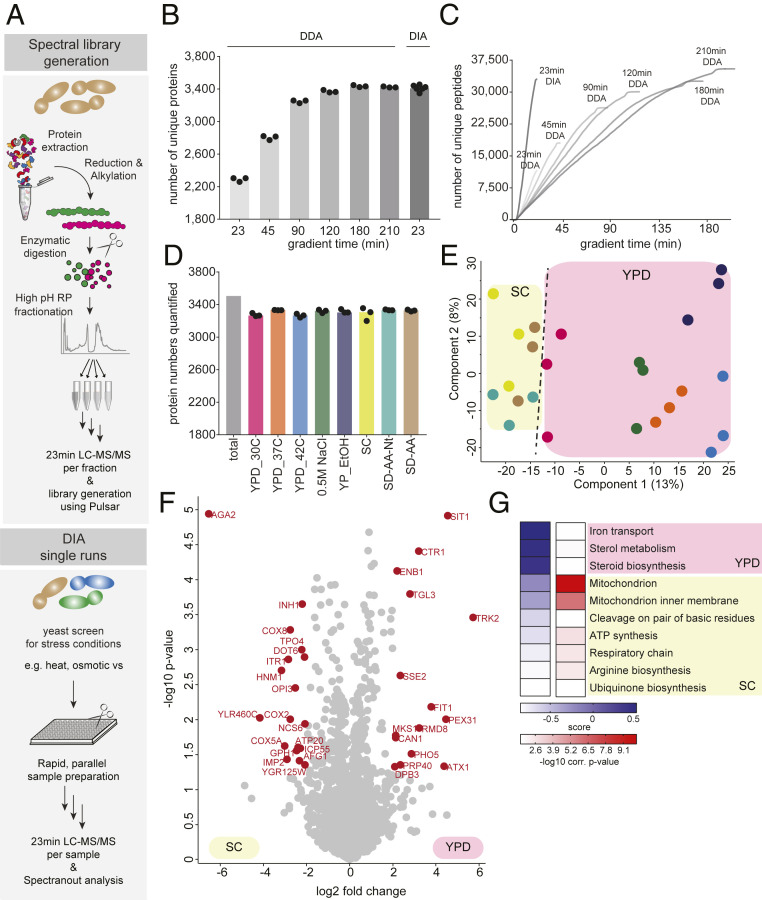
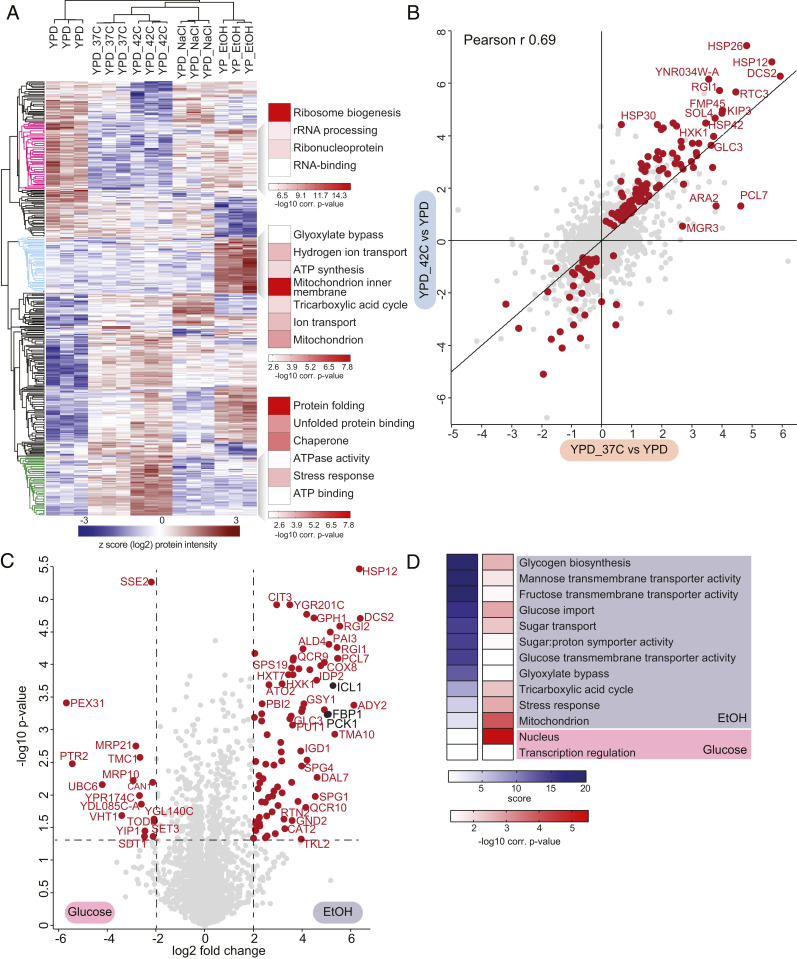
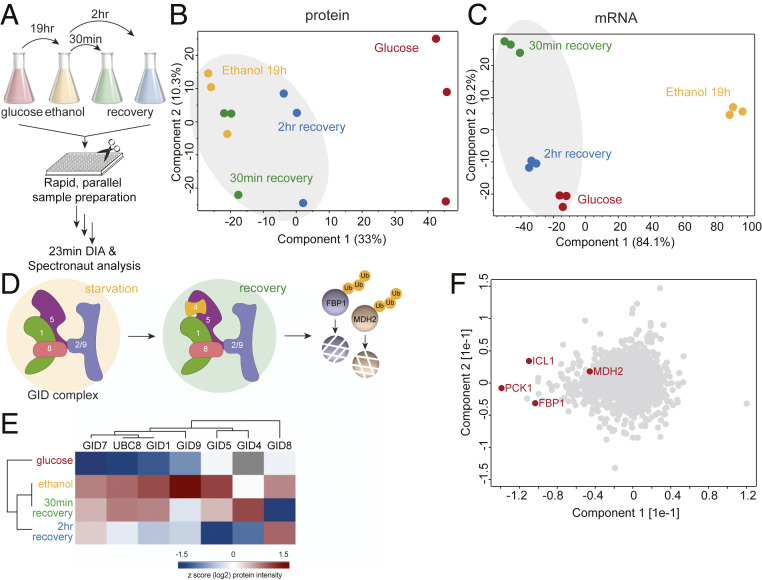
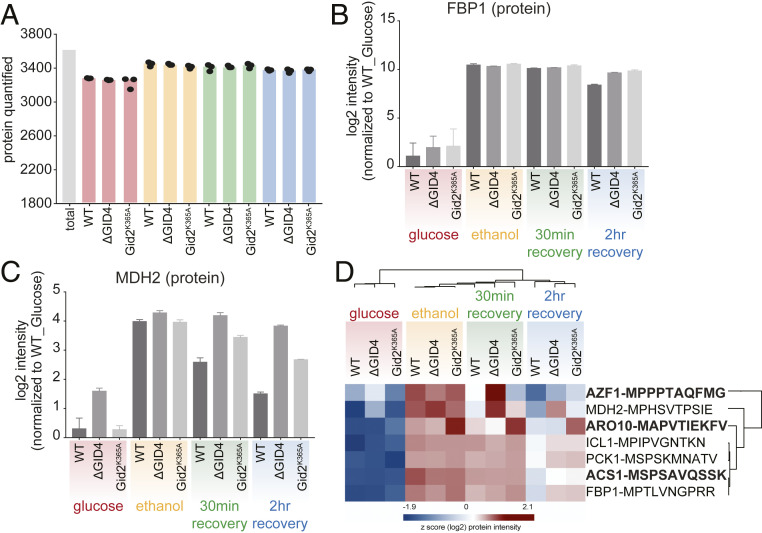
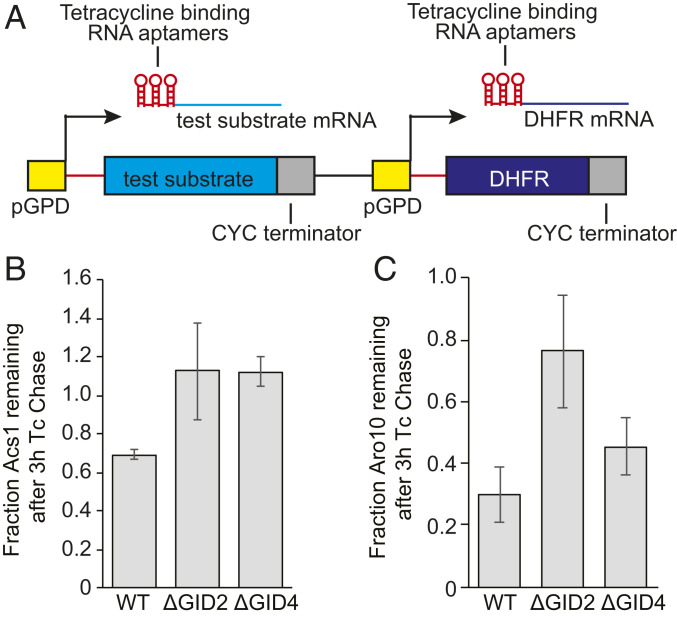
The yeast Saccharomyces cerevisiae is a powerful model system for systems-wide biology screens and large-scale proteomics methods. Nearly complete proteomics coverage has been achieved owing to advances in mass spectrometry. However, it remains challenging to scale this technology for rapid and high-throughput analysis of the yeast proteome to investigate biological pathways on a global scale. Here we describe a systems biology workflow employing plate-based sample preparation and rapid, single-run, data-independent mass spectrometry analysis (DIA). Our approach is straightforward, easy to implement, and enables quantitative profiling and comparisons of hundreds of nearly complete yeast proteomes in only a few days. We evaluate its capability by characterizing changes in the yeast proteome in response to environmental perturbations, identifying distinct responses to each of them and providing a comprehensive resource of these responses. Apart from rapidly recapitulating previously observed responses, we characterized carbon source-dependent regulation of the GID E3 ligase, an important regulator of cellular metabolism during the switch between gluconeogenic and glycolytic growth conditions. This unveiled regulatory targets of the GID ligase during a metabolic switch. Our comprehensive yeast system readout pinpointed effects of a single deletion or point mutation in the GID complex on the global proteome, allowing the identification and validation of targets of the GID E3 ligase. Moreover, this approach allowed the identification of targets from multiple cellular pathways that display distinct patterns of regulation. Although developed in yeast, rapid whole-proteome-based readouts can serve as comprehensive systems-level assays in all cellular systems.

Keywords: GID E3 ligase; mass spectrometry; proteomics; stress; yeast systems biology.


Conflict of interest statement

The authors declare no competing interest.

Figures

Fig. 1.
Fig. 1.
Fast and scalable yeast proteome analysis using DIA. (A) Experimental workflow for yeast spectral library construction (Top) and fast, single-run DIA-based analysis of yeast proteomes (Bottom). (B) Number of identified proteins using DDA with varying LC gradient lengths compared to 23-min DIA. (C) Cumulative number of identified unique yeast peptides over time using DDA with varying LC gradient lengths and the 23-min DIA method. (D) Number of quantified proteins in growth and stress conditions. (E) PCA of conditions along with their biological replicates based on their proteomic expression profiles. (F) Volcano plot of the (−log10) P values vs. the log2 protein abundance differences between yeast grown in YPD vs. SC. The proteins marked in red change significantly (P < 0.05 and at least fourfold change in both directions). (G) GO-term enrichment in the YPD vs. SC fold change dimension (one-dimensional annotation enrichment, FDR <5%). Terms with positive enrichment scores are enriched in YPD over SC and vice versa.
Fig. 2.
Fig. 2.
Large-scale and quantitative analysis of yeast proteomes under different stresses. (A) Heat map of z-scored protein abundances (log2 DIA intensities) of the differentially expressed proteins (ANOVA, FDR <0.01) after hierarchical clustering of stress conditions performed in YPD and YPE. Fisher exact test was performed to identify significantly enriched GO terms in the most prominent profiles (FDR <5%). (B) Correlation of log2 fold-changes of all the quantified proteins during heat shock. The proteins that change significantly in either 37 °C or 42 °C compared to 30 °C YPD control are colored in red (t test, FDR <5%). (C) Volcano plot of the (−log10) P values vs. the log2 protein abundance differences between glucose starvation (ethanol) vs. YPD. Red dots indicate significantly different proteins, determined based on P < 0.05 and at least fourfold change in both directions. (D) GO-term enrichment in the ethanol vs. YPD fold change dimension (one-dimensional annotation enrichment, FDR <5%). Terms with positive enrichment scores are enriched in stress condition over glucose (YPD) control and vice versa.
Fig. 3.
Fig. 3.
Global proteome changes of yeast under glucose starvation and recovery. (A) Rapid yeast proteome profiling under glucose starvation and recovery. (B and C) PCA plot of growth conditions along with their biological replicates based on their protein expression (B) and mRNA abundance (C) profiles. (D) The GID E3 ubiquitin ligase is a key regulator of the switch from gluconeogenic to glycolytic growth as it degrades the gluconeogenic enzymes, including Fbp1 and Mdh2. (E) Heat map of z-scored protein abundances (log2) of the GID complex subunits under glucose starvation and recovery in wild-type yeast cells. (F) PCA plot of proteins during glucose starvation and recovery. Proteins marked in red represent the known GID complex substrates.
Fig. 4.
Fig. 4.
Rapid and robust DIA-based approach identifies GID substrates during recovery after glucose starvation. (A) Number of quantified proteins in wild type (WT), ΔGID4, and Gid2K365A yeast cells during glucose starvation and recovery. (B and C) Bar graphs showing abundances (log2) of Fbp1 (B) and Mdh2 (C) proteins that are normalized to WT glucose (never starved) condition in WT, ΔGID4, and Gid2K365A yeast cells during glucose starvation and recovery. (D) Heat map of z-scored protein abundances (log2) of the proteins which have the criteria of GID substrates.
Fig. 5.
Fig. 5.
In vivo validation of GID targets. (A) Schematic of constructs used in the promoter reference technique. (B and C) Quantification of Acs1 (B) and Aro10 (C) degradation, based on at least four independent replicates. Bars represent mean values, and error bars represent SD.

References

    1. Sui X., et al. , Widespread remodeling of proteome solubility in response to different protein homeostasis stresses. Proc. Natl. Acad. Sci. U.S.A. 117, 2422–2431 (2020). - PMC - PubMed
    1. Berner N., Reutter K. R., Wolf D. H., Protein quality control of the endoplasmic reticulum and ubiquitin-proteasome-triggered degradation of aberrant proteins: Yeast pioneers the path. Annu. Rev. Biochem. 87, 751–782 (2018). - PubMed
    1. Hanna J., Guerra-Moreno A., Ang J., Micoogullari Y., Protein degradation and the pathologic basis of disease. Am. J. Pathol. 189, 94–103 (2019). - PMC - PubMed
    1. Hipp M. S., Park S. H., Hartl F. U., Proteostasis impairment in protein-misfolding and -aggregation diseases. Trends Cell Biol. 24, 506–514 (2014). - PubMed
    1. Steinmetz L. M., et al. , Systematic screen for human disease genes in yeast. Nat. Genet. 31, 400–404 (2002). - PubMed

Publication types

MeSH terms

LinkOut - more resources