. 2020 Dec 7;11(12):1039.
doi: 10.1038/s41419-020-03256-5.

Calcium cytotoxicity sensitizes prostate cancer cells to standard-of-care treatments for locally advanced tumors

Affiliations

Calcium cytotoxicity sensitizes prostate cancer cells to standard-of-care treatments for locally advanced tumors

Alessandro Alaimo et al. Cell Death Dis. .

Abstract

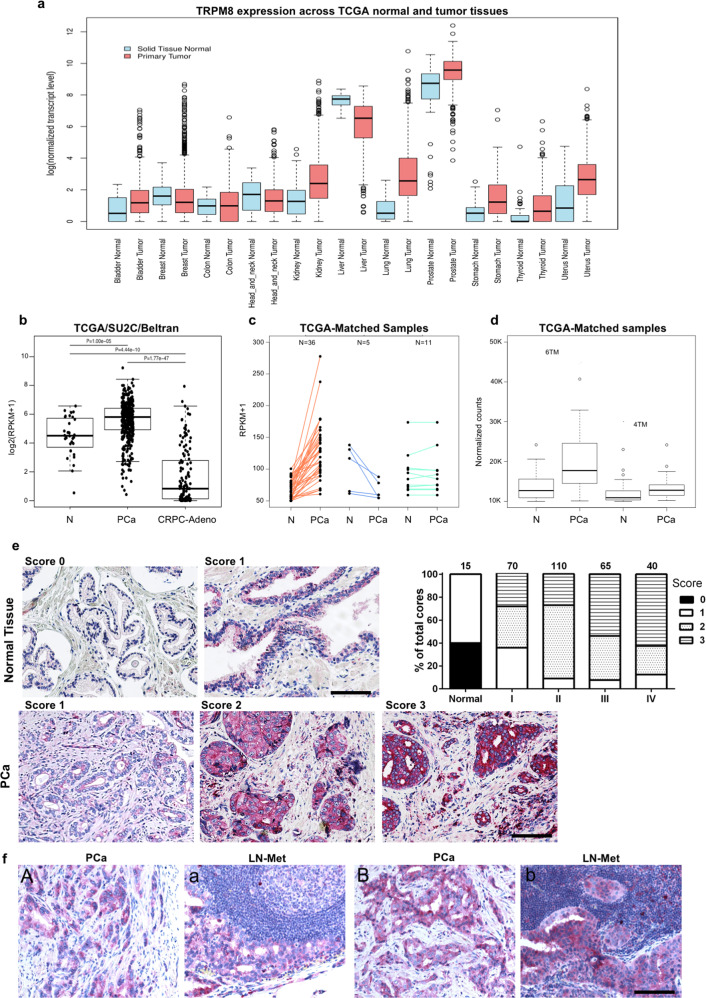
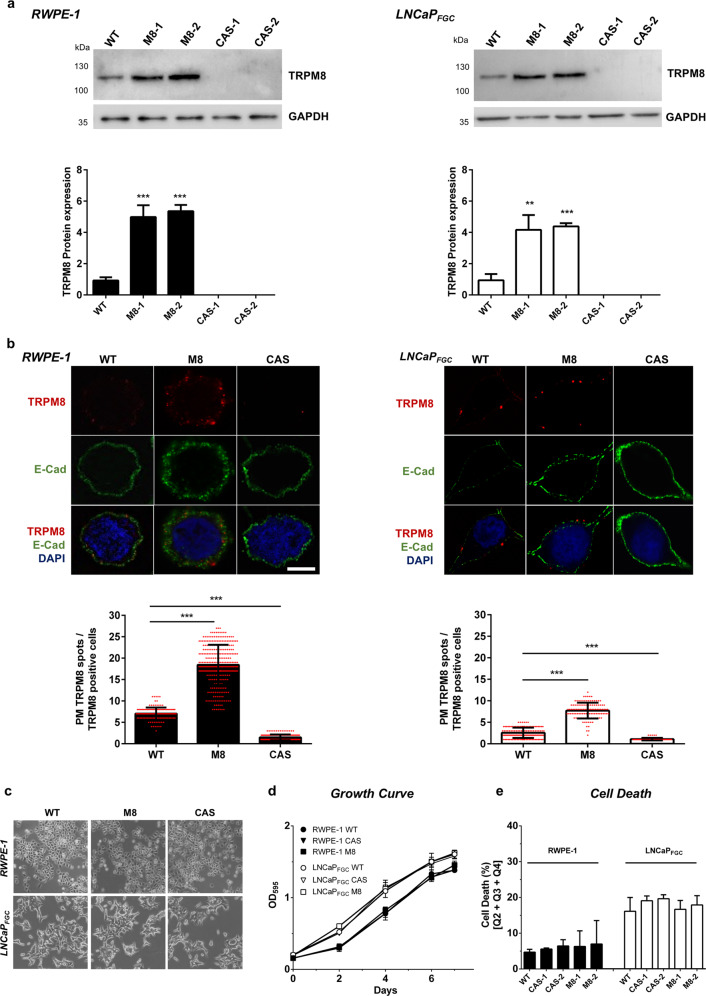
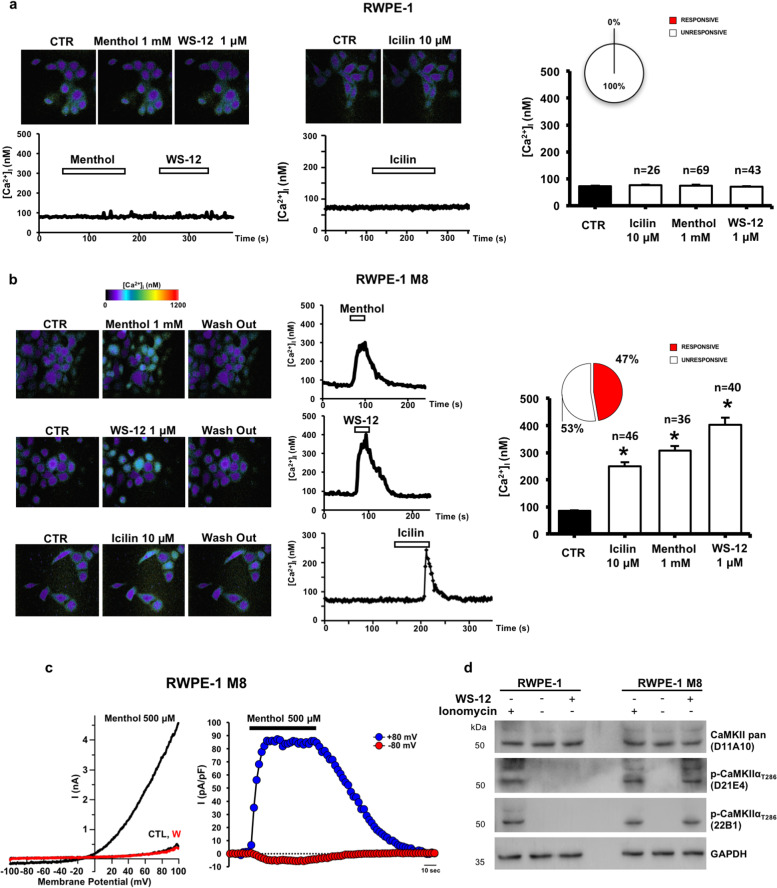
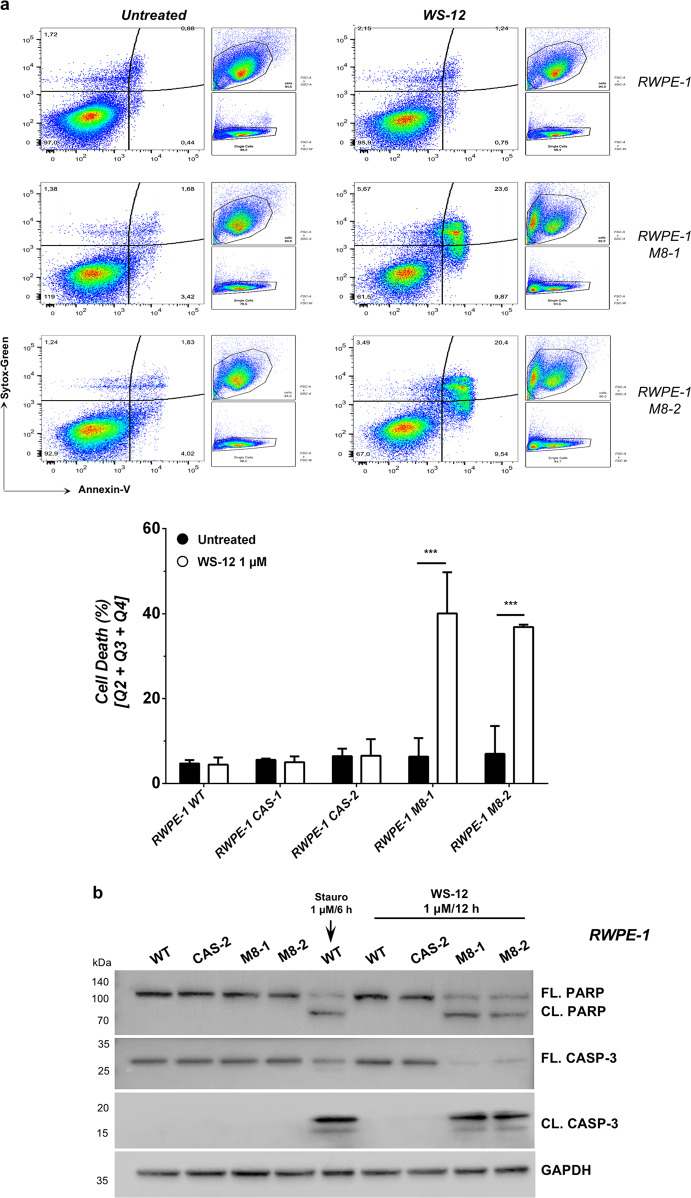
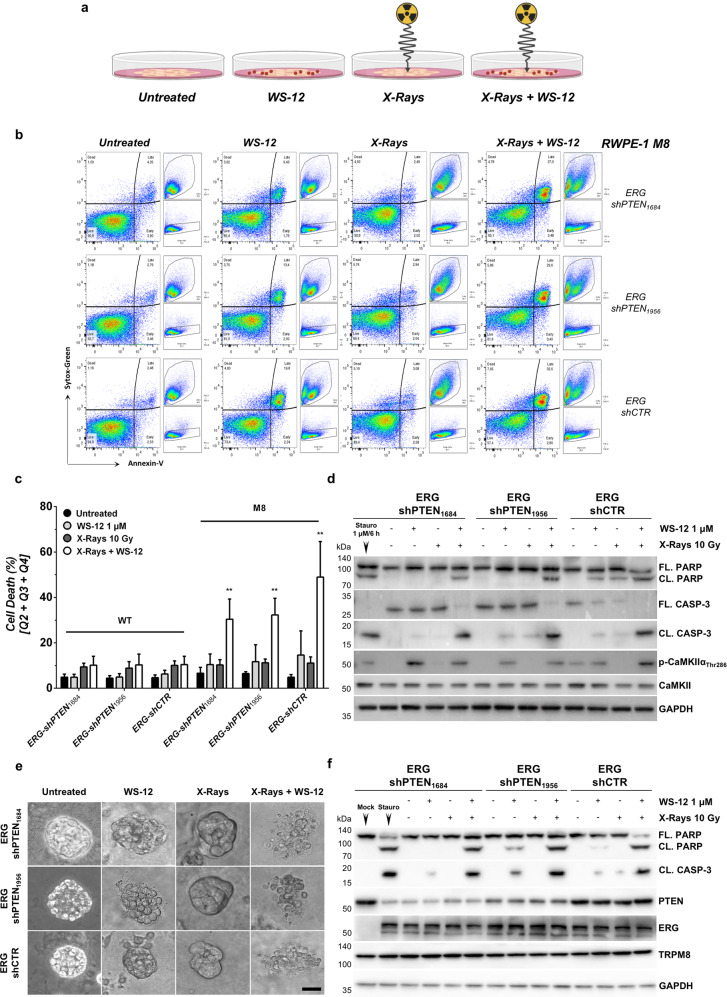
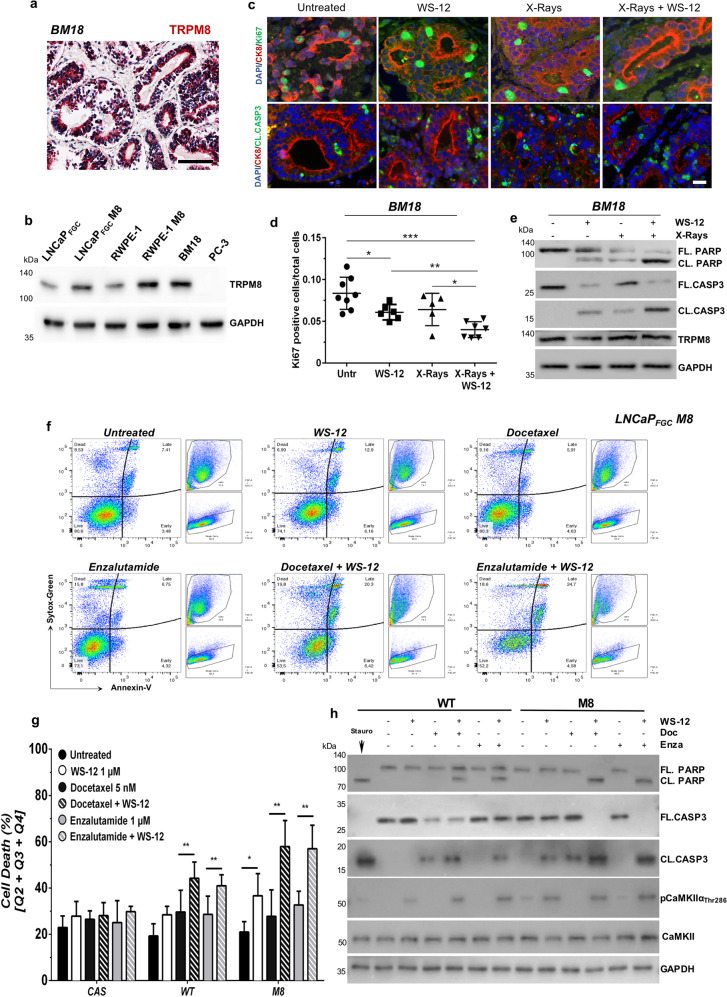
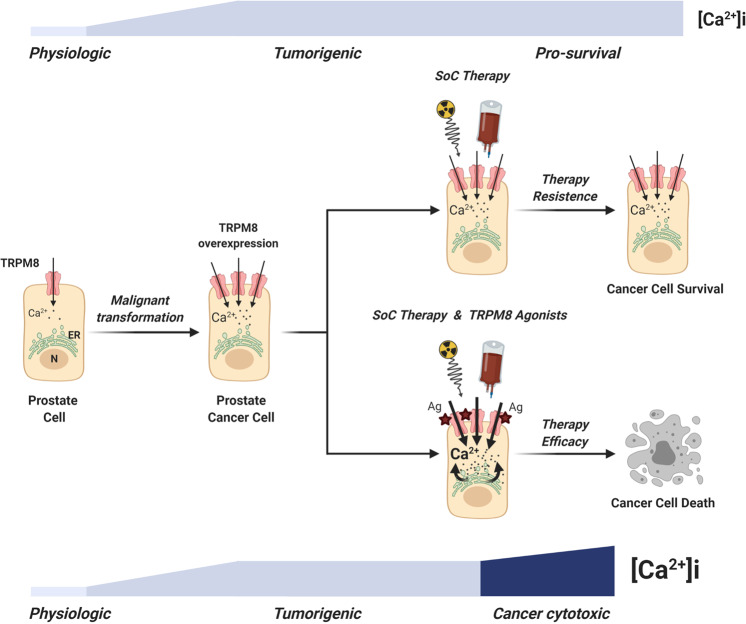
Therapy resistance is a major roadblock in oncology. Exacerbation of molecular dysfunctions typical of cancer cells have proven effective in twisting oncogenic mechanisms to lethal conditions, thus offering new therapeutic avenues for cancer treatment. Here, we demonstrate that selective agonists of Transient Receptor Potential cation channel subfamily M member 8 (TRPM8), a cation channel characteristic of the prostate epithelium frequently overexpressed in advanced stage III/IV prostate cancers (PCa), sensitize therapy refractory models of PCa to radio, chemo or hormonal treatment. Overall, our study demonstrates that pharmacological-induced Ca2+ cytotoxicity is an actionable strategy to sensitize cancer cells to standard therapies.


Conflict of interest statement

A.C. and G.P. are cofounders and scientific advisors of Alia Therapeutics. The other authors disclosed no potential conflicts of interest.

Figures

Fig. 1
Fig. 1. TRPM8 expression in human PCa.
a TCGA RNA-seq dataset showing TRPM8 expression levels in normal tissues and related primary tumors. b TCGA, SU2C, and Beltran RNA-seq datasets analysis stating TRPM8 expression levels in benign prostate tissue, primary PCa and castration resistant metastatic adeno-PCa. Data were analyzed using a two-tailed Wilcoxon–Mann–Whitney test with a significance level set at 5%. c TRPM8 mRNA levels in 52 matched normal and adjacent PCa samples showing increased expression of TRPM8 in PCa compared to adjacent normal tissue in 36 cases, reduction in 5 and comparable levels in 11. d Relative amount of PM-associated 6TM (full length) and ER-associated 4TM TRPM8 transcript isoforms in 52 matched normal (N) and primary PCa (PCa) samples, as retrieved in TCGA RNA-seq dataset. e TRPM8 immunostaining score of a commercially available PCa tissue microarray (TMA). TRPM8 immunostaining was scored as weak (0), moderate (1), high (2), or very high (3) on 5 normal prostate cores and 171 PCa cores representing 57 different cases (3 cores × tumor). Representative images of scored normal prostate tissue and prostate adenocarcinoma cores are shown. Results are presented as percentage of tumors scored 0-to-3 respect to tumor stage. Stage I: score 1 = 36%; score 2 = 36%; score 3 = 28%; stage II: score 1 = 9%, score 2 = 64%, score 3 = 27%; stage III: score 1 = 8%; score 2 = 38%; score 3 54%; stage IV: score 1 = 12%, score 2 = 25%, score 3 = 63%. Scale bars, 100 μm. f TRPM8 immunostaining of matched primary PCa (A, B) and hormone naïve lymph node metastases (a, b). Scale bars, 100 μm.
Fig. 2
Fig. 2. Modeling different levels of TRPM8 in RWPE-1 and LNCaPFGC prostate cell lines.
a Western blot analysis and quantification of full-length 6TM TRPM8 amount in RWPE-1 and LNCaPFGC cell lines expressing endogenous (WT), overexpressed (M8) or knocked-out (CAS) levels of the protein. b Immunofluorescence analysis and quantification of PM-associated full-length 6TM TRPM8 in RWPE-1 and LNCaPFGC cell lines with endogenous (WT), overexpressed (M8), or knocked-out (CAS) levels of the channel. For quantification of PM TRPM8 positive cells a total of 6000 cells were counted from different fields. Scale bar, 5 μm. c–e Morphology (c), growth (d), and cell death (e) analyses of RWPE-1 and LNCaPFGC cell lines with endogenous (WT), overexpressed (M8), or knocked-out (CAS) levels of TRPM8. Error bars, mean ± SD. Experiments were performed in triplicate; data were analyzed using a two-tailed Student’s t-test. **P ≤ 0.01; ***P ≤ 0.001.
Fig. 3
Fig. 3. TRPM8 channel activity in RWPE-1 prostate cells.
a Representative images (upper panels) and traces (lower panels) showing [Ca2+]i changes under control solution (CTR) or upon perfusion with menthol (1 mM), WS-12 (1 μM), or icilin (10 μM) on RWPE-1 cells. Time of drugs exposure is indicated by the bar on top of the traces. Quantification of [Ca2+]i peaks measured upon perfusion with TRPM8 activators is reported on the right panel (n = number of analyzed cells). The inset graph indicates the quantification of the total % of cells responsive to tested drugs. b Representative images (left panels) and traces (middle panels) showing [Ca2+]i under control solution (CTR), upon perfusion with menthol (1 mM), WS-12 (1 μM), or icilin (10 μM), or after drugs washout on RWPE-1 M8 cells. Time of drugs exposure is indicated by the bar on top of the traces. Quantification of the [Ca2+]i peaks measured upon perfusion with TRPM8 activators is reported on the right panel (n = number of analyzed cells). The inset graph indicates the percentage of cells responsive to the drugs tested. c Left panel, representative traces of currents evoked by a 100 ms voltage ramp ranging from −100 mV to +100 mV applied every 4 s in control solution (CTL), during application of menthol (500 μM) or after drug washout (W). Right panel, representative time-courses of currents recorded at +80 mV (blue symbols) or −80 mV (red symbols) in single RWPE-1 M8 cells upon exposure to menthol (500 μM). Time of menthol exposure is indicated by the line on top of the traces. d Western blotting analysis with two independent antibodies (D21E4 and 22B1) showing CaMKIIα activation (phosphorylation of Thr286) following WS-12 treatment of RWPE-1 M8 cells. Cells treated with ionomycin were used as positive control for calcium dependent CaMKIIα phosphorylation. Error bars, mean ± SEM. Experiments were performed in at least three experimental sessions; data were analyzed using a two-tailed Student’s t-test. *P ≤ 0.05.
Fig. 4
Fig. 4. RWPE-1 response to TRPM8 agonist WS-12.
a Cell death response by FACS (Annexin-V; Sytox-Green) in RWPE-1 cells expressing endogenous, increased (M8) or knocked-out (CAS) TRPM8 levels following 12 h WS-12 (1 μM) administration. Quantification is reported as percentage of total cells (lower panel). b Western blotting analysis showing molecular signature of apoptotic cell death (Caspase-3 and PARP cleavage). Staurosporine was used as positive control. Error bars, mean ± SD. Experiments were performed in triplicate; data were analyzed using a two-tailed Student’s t-test. ***P ≤ 0.001.
Fig. 5
Fig. 5. Apoptotic response to X-rays, WS-12 or their combination in RWPE-1 based models of premalignant and malignant prostate lesions.
a Diagram of the experimental design. Genetically engineered RWPE-1 cells were treated as indicated (BioRender.com). b Representative flow cytometry analysis of cell death in ERG + and ERG + /PTEN-deficient RWPE-1 M8 cells treated with WS-12 (1 μM, 12 h), X-rays (10 Gy) or the combination of both. Untreated cells were used as control. c Cell death quantification of RWPE-1 M8 cells treated as described in b is reported as percentage of total cells. d Western blotting analysis of samples described in b shows CaMKIIα activation (phosphorylation of Thr286) following WS-12 treatment of RWPE-1 M8 and the classical molecular signature of apoptotic cell death (Caspase-3 and PARP cleavage) in RWPE-1 M8-based premalignant (ERG-shCTR) and malignant (ERG + shPTEN) models of human prostatic disease treated with X-rays plus WS-12. e Representative ERG+ and ERG+/PTEN-deficient RWPE-1 M8 3D prostopheres treated with WS-12 (1 μM, 12 h), X-rays (10 Gy) or the combination of both. Untreated spheroids were used as control. Scale bar, 50 μm. f Western blotting analysis of treated prostopheres described in e showing classical molecular hallmarks of apoptotic cell death (Caspase-3 and PARP cleavage). Error bars, mean ± SD. Experiments were performed in quadruplicate; data were analyzed using a two-way ANOVA test. **P ≤ 0.01.
Fig. 6
Fig. 6. TRPM8 immunoscoring predicts X-rays + WS-12 efficacy.
a TRPM8 immunostaining of BM-18 PDX. Scale bars, 100 μm. b Western blotting analysis shows comparable expression levels of TRPM8 in BM-18 and RWPE-1 M8 cells. c Immunofluorescence images showing co-staining of Ki-67 (green, upper panel) or Cleaved Caspase-3 (green, lower panel) with CK8 (red) and DAPI (blue). d Percentage of Ki-67 positive cells on a total of 30,000 cells in at least five different areas of the sample. Scale bars, 50 μm. e Western blotting analysis in BM-18 PDX tissues slices upon WS-12 (1 μM, 48 h), X-rays (10 Gy), or X-ray + WS-12 treatments showing molecular hallmarks of apoptotic cell death (Caspase-3 and PARP cleavage). Error bars, mean ± SD. Data were analyzed using a two-tailed Student’s t-test. *P ≤ 0.05; **P ≤ 0.01; ***P ≤ 0.001. f Representative flow cytometry analysis of apoptotic cell death by Annexin-V/Sytox-Green labeling in LNCaPFGC M8 cells treated with WS-12 (1 μM), docetaxel (5 nM), enzalutamide (1 μM), WS-12 + docetaxel, or WS-12 + enzalutamide for 48 h. Untreated cells were used as control. g Quantification of dying cells in LNCaPFGC expressing endogenous (WT), increased (M8) or knocked-out (CAS) levels of TRPM8 treated as indicated in f. h Western blotting analysis of the indicated samples showing CaMKIIα activation (phosphorylation of Thr286) following WS-12 treatment of LNCaPFGC WT and M8 cells and the molecular signature of apoptotic cell death (Caspase-3 and PARP cleavage) upon treatment with combination of WS-12 with docetaxel or enzalutamide. Error bars, mean ± SD. Experiments were performed in quadruplicate; data were analyzed using a two-way ANOVA test. **P ≤ 0.01.
Fig. 7
Fig. 7. Proposed model for therapy resistance bypass in PCa cells.
The scheme shows the lethal synergy between standard-of-care therapies and Ca2+ cytotoxicity induced by potent TRPM8 agonists in PCa cells expressing increased amounts of the channel (BioRender.com).

References

    1. Ferlay J, et al. Cancer incidence and mortality worldwide: sources, methods and major patterns in GLOBOCAN 2012. Int. J. Cancer. 2015;136:E359–E386. doi: 10.1002/ijc.29210. - DOI - PubMed
    1. Lee C-H, Kantoff P. Treatment of metastatic prostate cancer in 2018. JAMA Oncol. 2019;5:263–264. doi: 10.1001/jamaoncol.2018.5621. - DOI - PMC - PubMed
    1. Rosenthal SA, et al. Effect of chemotherapy with docetaxel with androgen suppression and radiotherapy for localized high-risk prostate cancer: the randomized phase III NRG Oncology RTOG 0521 Trial. J. Clin. Oncol. 2019;37:1159–1168. doi: 10.1200/JCO.18.02158. - DOI - PMC - PubMed
    1. Rizzuto R, et al. Calcium and apoptosis: facts and hypotheses. Oncogene. 2003;22:8619–8627. doi: 10.1038/sj.onc.1207105. - DOI - PubMed
    1. Marchi S, Pinton P. Alterations of calcium homeostasis in cancer cells. Curr. Opin. Pharmacol. 2016;29:1–6. doi: 10.1016/j.coph.2016.03.002. - DOI - PubMed

Publication types