. 2020 Dec 7;11(1):6258.
doi: 10.1038/s41467-020-20087-2.

Improving the informativeness of Mendelian disease-derived pathogenicity scores for common disease

Affiliations

Improving the informativeness of Mendelian disease-derived pathogenicity scores for common disease

Samuel S Kim et al. Nat Commun. .

Abstract

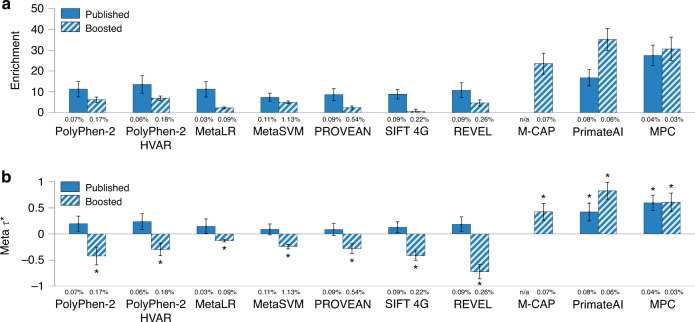
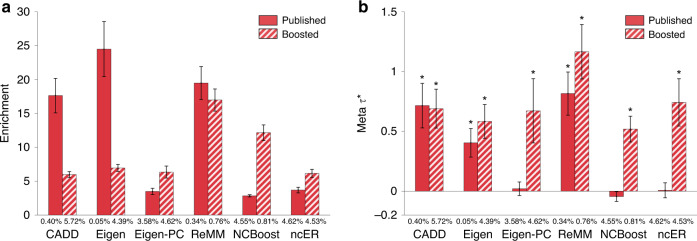
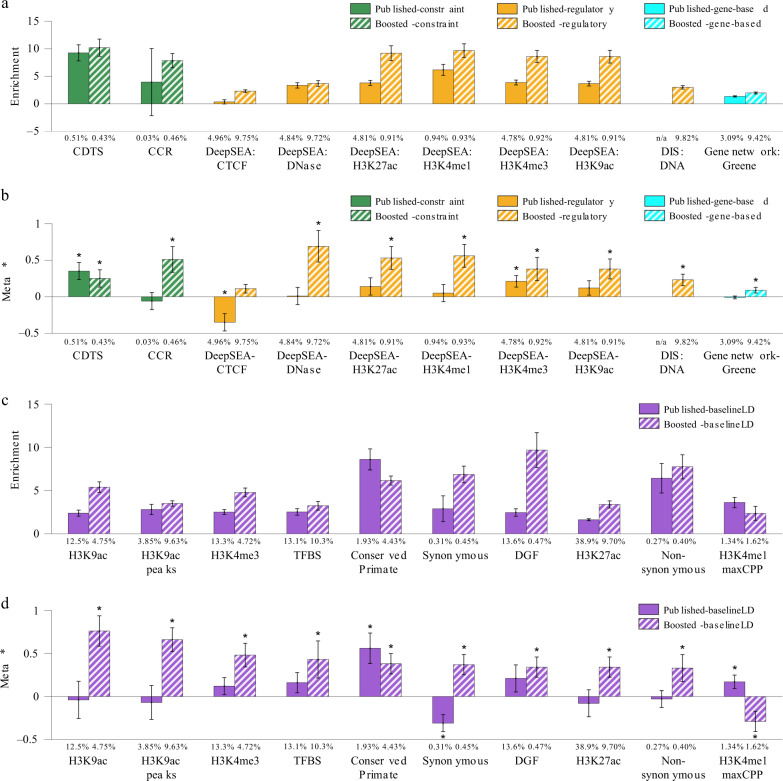
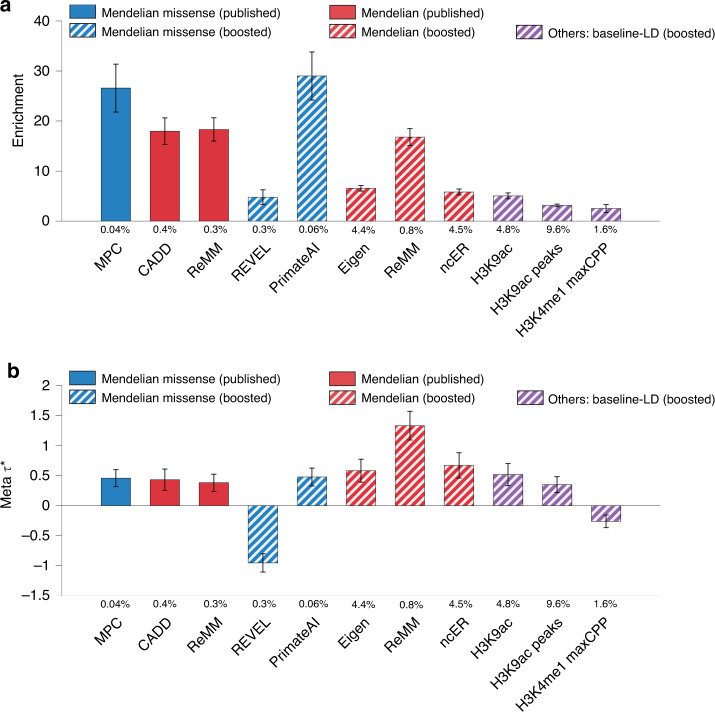
Despite considerable progress on pathogenicity scores prioritizing variants for Mendelian disease, little is known about the utility of these scores for common disease. Here, we assess the informativeness of Mendelian disease-derived pathogenicity scores for common disease and improve upon existing scores. We first apply stratified linkage disequilibrium (LD) score regression to evaluate published pathogenicity scores across 41 common diseases and complex traits (average N = 320K). Several of the resulting annotations are informative for common disease, even after conditioning on a broad set of functional annotations. We then improve upon published pathogenicity scores by developing AnnotBoost, a machine learning framework to impute and denoise pathogenicity scores using a broad set of functional annotations. AnnotBoost substantially increases the informativeness for common disease of both previously uninformative and previously informative pathogenicity scores, implying that Mendelian and common disease variants share similar properties. The boosted scores also produce improvements in heritability model fit and in classifying disease-associated, fine-mapped SNPs. Our boosted scores may improve fine-mapping and candidate gene discovery for common disease.


Conflict of interest statement

The authors declare no competing interests.

Figures

Fig. 1
Fig. 1. Informativeness for a common disease of binary annotations derived from 11 Mendelian disease-derived missense scores and corresponding boosted scores.
We report (a) heritability enrichment of binary annotations derived from published and boosted Mendelian disease-derived missense scores, meta-analyzed across 41 independent traits; b conditional τ* values, conditioning on the baseline-LD model (for annotations derived from published scores) or the baseline-LD model and corresponding published annotations (for annotations derived from boosted scores). We report results for 10 Mendelian disease-derived missense scores (of 11 analyzed) for which annotations derived from published and/or boosted scores were conditionally significant; the published M-CAP score spanned too few SNPs to be included in the S-LDSC analysis. The percentage under each bar denotes the proportion of SNPs in the annotation; the proportion of top SNPs included in each annotation was optimized to maximize informativeness (largest ∣τ*∣ among Bonferroni-significant annotations, or most significant p-value if no annotation was Bonferroni-significant). Error bars denote 95% confidence intervals. In (b), * denotes conditionally significant annotations. Numerical results are reported in Supplementary Data 1. Results for standardized enrichment, defined as enrichment times the standard deviation of annotation value (to adjust for annotation size), are reported in Supplementary Data 23.
Fig. 2
Fig. 2. Informativeness for a common disease of binary annotations derived from 6 genome-wide Mendelian disease-derived scores and corresponding boosted scores.
We report (a) heritability enrichment of binary annotations derived from published and boosted genome-wide Mendelian disease-derived scores, meta-analyzed across 41 independent traits; b conditional τ* values, conditioning on the baseline-LD model (for annotations derived from published scores) or the baseline-LD model and corresponding published annotations (for annotations derived from boosted scores). We report results for six genome-wide Mendelian disease-derived scores (of six analyzed) for which annotations derived from published and/or boosted scores were conditionally significant. The percentage under each bar denotes the proportion of SNPs in the annotation; the proportion of top SNPs included in each annotation was optimized to maximize informativeness (largest ∣τ*∣ among Bonferroni-significant annotations, or top 5% if no annotation was Bonferroni-significant; top 5% was the average optimized proportion among significant annotations). Error bars denote 95% confidence intervals. In panel (b), * denotes marginally conditionally significant annotations. Numerical results are reported in Supplementary Data 11. Results for standardized enrichment, defined as enrichment times the standard deviation of annotation value (to adjust for annotation size), are reported in Supplementary Data 23.
Fig. 3
Fig. 3. Informativeness for a common disease of binary annotations derived from 18 additional genome-wide scores + 47 baseline-LD model annotations and corresponding boosted scores.
We report (a) heritability enrichments of binary annotations derived from published and boosted additional genome-wide scores, meta-analyzed across 41 independent traits; (b) conditional τ* values, conditioning on the baseline-LD model and eight Roadmap annotations (for annotations derived from published scores) or the baseline-LD model, 8 Roadmap annotations, and corresponding published annotations (for annotations derived from boosted scores); (c) heritability enrichments of binary annotations derived from published and boosted baseline-LD model annotations; and (d) conditional τ* values of binary annotations derived from published and boosted baseline-LD model annotations. In (a) and (b), we report results for the 10 most informative additional genome-wide scores (of 18 analyzed). In (c) and (d), we report results for the 10 most informative baseline-LD model annotations (of 47 analyzed). The percentage under each bar denotes the proportion of SNPs in the annotation; the proportion of top SNPs included in each annotation was optimized to maximize informativeness (largest ∣τ*∣ among Bonferroni-significant annotations, or top 5% if no annotation was Bonferroni-significant; top 5% was the average optimized proportion among significant annotations). Error bars denote 95% confidence intervals. In panels (b) and (d), * denotes conditionally significant annotations. Numerical results are reported in Supplementary Data 14. Results for standardized enrichment, defined as enrichment times the standard deviation of annotation value (to adjust for annotation size), are reported in Supplementary Data 23.
Fig. 4
Fig. 4. Informativeness for a common disease of 11 jointly significant binary annotations from combined joint model.
We report (a) heritability enrichment of 11 jointly significant binary annotations, meta-analyzed across 41 independent traits; b joint τ* values, conditioned on the baseline-LD model, eight Roadmap annotations, and each other. We report results for the 11 jointly conditionally informative annotations in the combined joint model (S-LDSC τ*P < 0.0001 and ∣τ*∣ ≥ 0.25). The percentage under each bar denotes the proportion of SNPs in the annotation. Error bars denote 95% confidence intervals. Numerical results are reported in Supplementary Data 19. Results for standardized enrichment, defined as enrichment times the standard deviation of annotation value (to adjust for annotation size), are reported in Supplementary Data 23.
Fig. 5
Fig. 5. Evaluation of improvement in heritability model fit.
We report (a) average ΔloglSS (an approximate model likelihood metric) across 30 UKBB traits; b ΔloglSS of the baseline-LD and baseline-LD + marginal models for each trait. ΔloglSS is computed as loglSS of a given model - loglSS of a model with no functional annotations (baseline-LD-nofunct model: MAF/LD annotations only). In (a), k denotes the number of new annotations beyond the baseline-LD model. Numerical results are reported in Supplementary Data 20.

References

    1. Adzhubei IA, et al. A method and server for predicting damaging missense mutations. Nat. Methods. 2010;7:248. doi: 10.1038/nmeth0410-248. - DOI - PMC - PubMed
    1. Kircher M, et al. A general framework for estimating the relative pathogenicity of human genetic variants. Nat. Genet. 2014;46:310. doi: 10.1038/ng.2892. - DOI - PMC - PubMed
    1. Ionita-Laza I, McCallum K, Xu B, Buxbaum JD. A spectral approach integrating functional genomic annotations for coding and noncoding variants. Nat. Genet. 2016;48:214. doi: 10.1038/ng.3477. - DOI - PMC - PubMed
    1. Smedley D, et al. A whole-genome analysis framework for effective identification of pathogenic regulatory variants in Mendelian disease. Am. J. Hum. Genet. 2016;99:595–606. doi: 10.1016/j.ajhg.2016.07.005. - DOI - PMC - PubMed
    1. Vaser R, Adusumalli S, Leng SN, Sikic M, Ng PC. Sift missense predictions for genomes. Nat. Protoc. 2016;11:1. doi: 10.1038/nprot.2015.123. - DOI - PubMed

Publication types

MeSH terms