. 2020 Dec 7;11(1):6256.
doi: 10.1038/s41467-020-20062-x.

Phase imaging with computational specificity (PICS) for measuring dry mass changes in sub-cellular compartments

Affiliations

Phase imaging with computational specificity (PICS) for measuring dry mass changes in sub-cellular compartments

Mikhail E Kandel et al. Nat Commun. .

Abstract

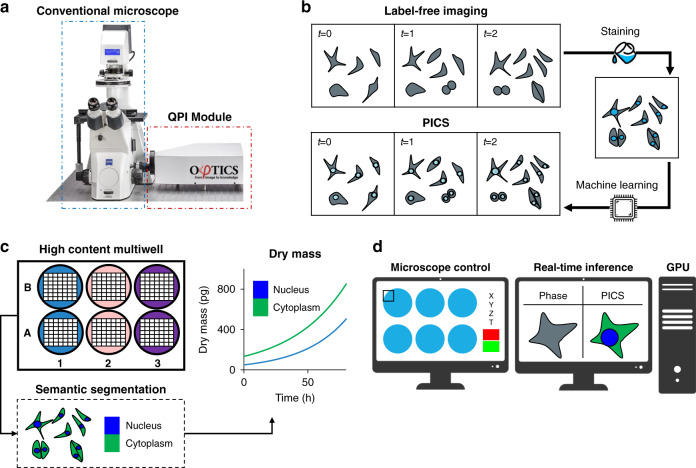
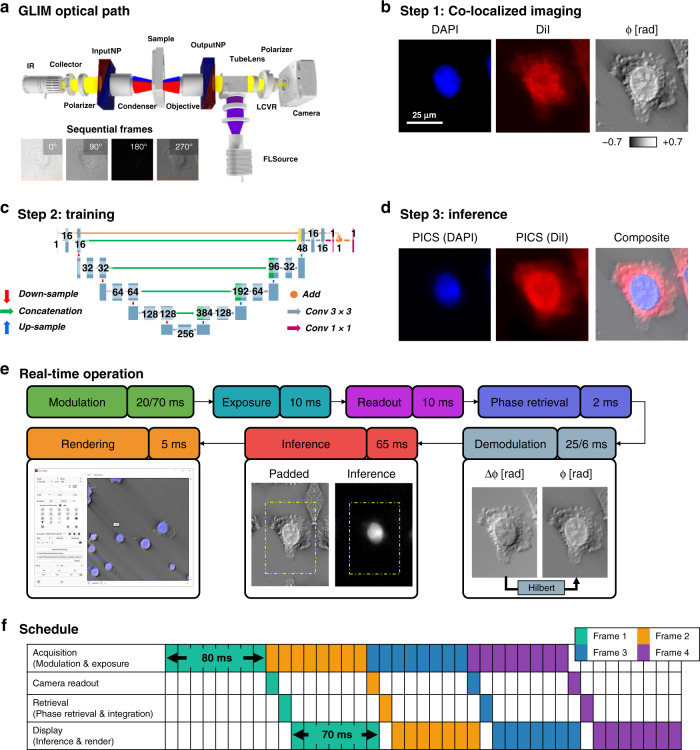
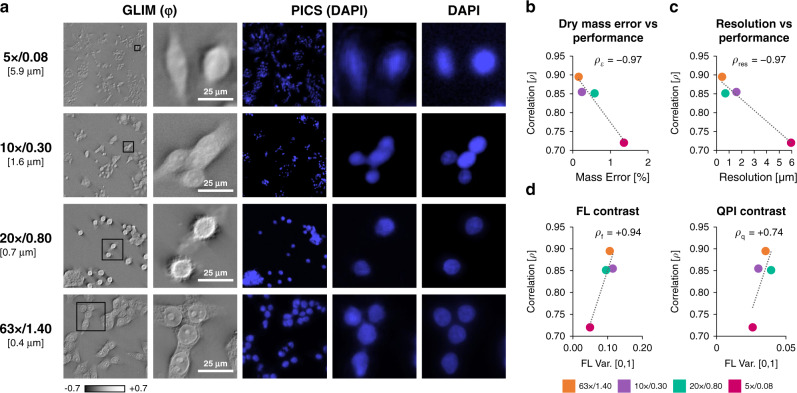
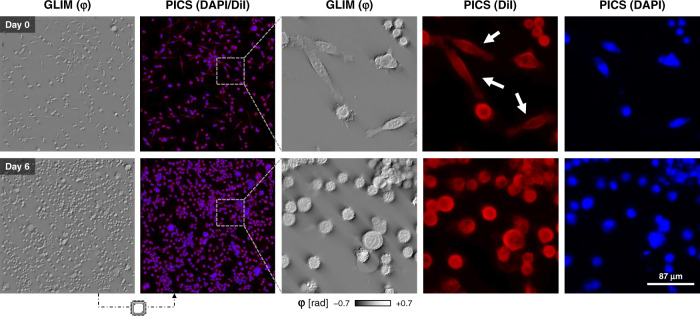
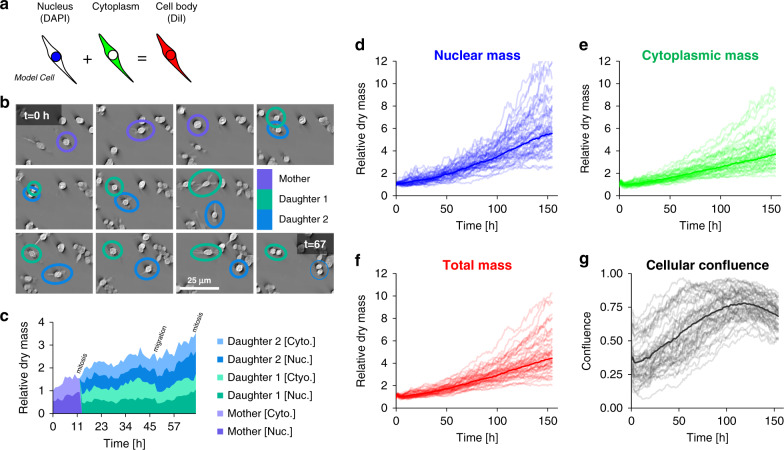
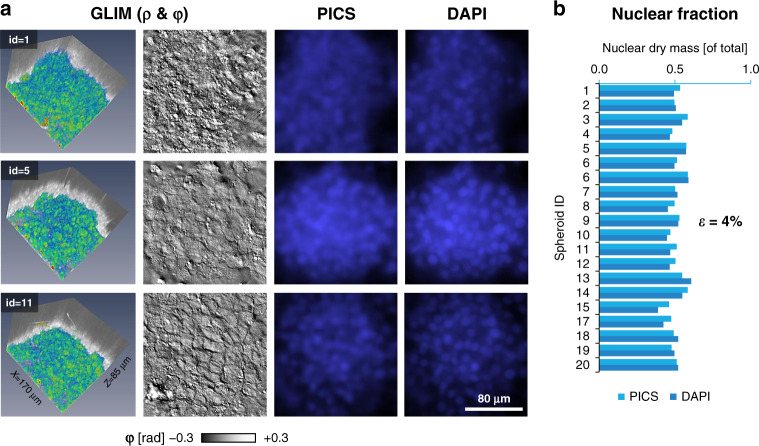
Due to its specificity, fluorescence microscopy has become a quintessential imaging tool in cell biology. However, photobleaching, phototoxicity, and related artifacts continue to limit fluorescence microscopy's utility. Recently, it has been shown that artificial intelligence (AI) can transform one form of contrast into another. We present phase imaging with computational specificity (PICS), a combination of quantitative phase imaging and AI, which provides information about unlabeled live cells with high specificity. Our imaging system allows for automatic training, while inference is built into the acquisition software and runs in real-time. Applying the computed fluorescence maps back to the quantitative phase imaging (QPI) data, we measured the growth of both nuclei and cytoplasm independently, over many days, without loss of viability. Using a QPI method that suppresses multiple scattering, we measured the dry mass content of individual cell nuclei within spheroids. In its current implementation, PICS offers a versatile quantitative technique for continuous simultaneous monitoring of individual cellular components in biological applications where long-term label-free imaging is desirable.


Conflict of interest statement

G.P. has a financial interest in Phi Optics, Inc., a company developing quantitative phase imaging technology for materials and life science applications. The remaining authors declare no competing interests.

Figures

Fig. 1
Fig. 1. PICS method for label-free measurements of compartment-specific cellular dry mass.
a We upgrade a conventional transmitted light microscope with a quantitative phase imaging add-on module. b To avoid the intrinsic toxicity of fluorescent stains, we develop a two-step protocol imaging protocol where label-free images are recorded followed by fixation and staining. From the toxic stain recorded at the end of the experiment, we train a neural network capable of digitally staining the time-lapse sequence, thus enabling time-lapse imaging of otherwise toxic stains. c The digital stain is used to introduce specificity to label-free imaging by providing a semantic segmentation map labeling the components of the cell. From the time-lapse sequence, we calculate organelle-specific dry mass doubling times, in this case, the rates of growth for the nucleus and cytoplasm. d The PICS method is integrated into a fully automated plate reading instrument capable of displaying the machine learning results in real-time.
Fig. 2
Fig. 2. The stain location is “learned” from co-localized phase and fluorescent images.
a Quantitative phase images are acquired with a compact Gradient Light Interference Microscopy (GLIM) module that attaches to the output port of a differential interference contrast microscope (DIC/Nomarksi). By using a liquid crystal variable retarder (LCVR) the instrument introduces controlled phase shifts between the orthogonal polarizations in DIC. GLIM images are the result of a four-frame reconstruction process to retrieve the phase associated with a differential interference contrast microscope. Insets show a zoomed portion of the field of view at 0°, 90°, 180°, 270° phase shifts. b The same light path is used for reflected light fluorescence imaging, providing a straightforward way to co-localize fluorescence and phase images. In this work, we focused on two popular stains used to assay the nucleus and cell body (DAPI and DiI). To recover the phase-shift associated with the object’s scattering potential, we remove the shear artifact associated with the DIC field by performing integration using a Hilbert transform to obtain φ, the phase shift measured along the DIC shear direction. Zoomed portion of a field of view showing a typical SW620 cell (×20/0.8). c Next, to learn the mapping between the label-free and stained image, we train a U-Net style deep convolutional neural network. d Once this model is trained we can perform real-time interference and rendering to obtain the equivalent fluorescence signal (PICS) directly from the label-free image. e In SLIM and GLIM, the acquisition process begins by introducing a controlled modulation which is allowed some time to stabilize (20 ms on SLIM, 70 ms on GLIM). In this work, we acquire full camera frame sizes at minimal exposure (10 ms exposure, 10 ms readout). Phase retrieval is comparably quick (2 ms, 2070 GTX Super, NVIDIA). Phase images typically require further demodulation to correct for system-specific imaging artifacts. In SLIM we perform halo removal to correct for spatial incoherence (25 ms), while GLIM images are integrated along the direction of the DIC shear (6 ms). To avoid edge artifacts, we perform GPU based inference (65 ms) on a larger, mirror padded version of the image, followed by rendering (6 ms). f These steps are performed in parallel to optimally overlap computation with acquisition. As the computation is typically quicker than the acquisition, during real-time operation all reconstruction steps are performed every time a new frame is received. In GLIM, the effective frame rate is limited by the modulation of the variable retarder, resulting in one phase image every 80 ms. In practice, it is possible to achieve faster performance, by using high performing graphics card and faster modulators.
Fig. 3
Fig. 3. The PICS method is applicable across microscope objectives and resolutions.
a To investigate the effect of resolution on performance we run a computational experiment where we train our network on SW cells acquired at different resolutions. To control for training sample size, we selected the most images shared between all sets. We note that the performance of the network improves with more data or training epochs. Even at low resolutions (10x, 1.6 μm resolution), we achieved adequate performance. b We use ρ, the correlation between the actual and the digital fluorescent signals over the entire set, as a quality metric. Comparing semantic segmentation maps generated form PICS and DAPI we find that even at low-resolution there is less than 2% error in estimating the dry mass. (Pearson correlation, ρε = −0.97). c There appears to be a clear relationship (Pearson correlation, ρres = −0.97) between resolution (better objectives) and performance. d The origin of the relationship between resolution and performance is attributable to differences in contrast recorded by these objectives. We find that the ρf coefficient between the variance of training scaled fluorescence images and quality metric ρ is statistically significant while the correlation between the variance of the training scaled phase images ρq is weaker. Overall, these results suggest that the relationship between performance associated with resolution can be largely attributed to better overall contrast, especially for the fluorescent signal, rather than directly due to resolving capabilities.
Fig. 4
Fig. 4. Time-lapse PICS of unstained cells.
To demonstrate time-lapse imaging and high-content screening capabilities, we seeded a multiwell with three distinct concentrations of SW cells (×20/0.8). These conditions were imaged over the course of a week by acquiring mosaic tiles consisting of a 2.5 mm2 square area in each well using a ×20/0.8 objective. The machine learning classifier, trained at the final time point after paraformaldehyde fixation, is applied to the previously unseen sequence to yield a DiI and DAPI equivalent image. Interestingly, the neural network was able to correctly reproduce the DiI stain on more elongated fibroblast-like cells, even though few such cells are present when the training data was acquired (white arrows).
Fig. 5
Fig. 5. Tracking dry mass changes in cellular compartments using PICS.
a The DiI and DAPI stains are specific to the cell body and nucleus, respectively. The difference between the two areas produces a semantic segmentation map that distinguishes between the nuclear and non-nuclear content of the cell (cytoplasm). b Throughout the experiment, we observe cellular growth and proliferation with cells often traveling a substantial distance between division events. c Using the semantic segmentation map we can track the nuclear and cytoplasmic dry mass. We find that nuclear and cytoplasmic dry mass steadily increases until mitosis, with some loss of dry mass due to cellular migration. dg Semantic segmentation maps enable us to track the nuclear and cytoplasmic dry mass and area over 155 h. The dark curve represents the median of the growth rate across forty-nine fields of view (lighter curves). The dry mass and area are normalized by the average measured value from the first six hours. In this experiment we observe that total nuclear dry mass grows faster than total cytoplasmic mass, providing further evidence that cells can divide without growing. As the cells reach optimal confluence (t ≈ 114 h), we observe a decrease in the growth rate of nuclear mass, although less difference in cytoplasmic dry mass growth.
Fig. 6
Fig. 6. PICS for digitally staining 3D cellular systems.
a Representative images of PICS applied to HepG2 spheroids (×63/1.4, 170 μm × 170 μm × ~85 μm). The scattering potential, GLIM (ρ) was recovered, as in the original GLIM paper, by nonlinear filtering where the absolute value of the phase map is displayed on a log scale. PICS and DAPI insets were bilaterally filtered to improve contrast. b To compare the performance of PICS to conventional DAPI staining we constructed a semantic segmentation map by thresholding the DAPI and PICS image and calculating the dry mass within this map. When comparing total dry mass across twenty samples, we find the average percentage change between the PICS and DAPI images to be 4%.

References

    1. Diaspro, A. (ed) Optical Fluorescence Microscopy. Vol. 1 (Springer, Springer, 2011). ISBN: 978-3-642-15174-3 1 (2011).
    1. Mycek, M.-A. & Pogue, B. W. Handbook of Biomedical Fluorescence (Marcel Dekker, 2003).
    1. Campagnola PJ, Wei MD, Lewis A, Loew LM. High-resolution nonlinear optical imaging of live cells by second harmonic generation. Biophys. J. 1999;77:3341–3349. doi: 10.1016/S0006-3495(99)77165-1. - DOI - PMC - PubMed
    1. Dixit R, Cyr R. Cell damage and reactive oxygen species production induced by fluorescence microscopy: effect on mitosis and guidelines for non-invasive fluorescence microscopy. Plant J. 2003;36:280–290. doi: 10.1046/j.1365-313X.2003.01868.x. - DOI - PubMed
    1. Hoebe RA, et al. Controlled light-exposure microscopy reduces photobleaching and phototoxicity in fluorescence live-cell imaging. Nat. Biotechnol. 2007;25:249–253. doi: 10.1038/nbt1278. - DOI - PubMed

Publication types