. 2020 Dec 7;10(1):21373.
doi: 10.1038/s41598-020-77864-8.

Confidence in subjective pain is predicted by reaction time during decision making

Affiliations

Confidence in subjective pain is predicted by reaction time during decision making

Troy C Dildine et al. Sci Rep. .

Abstract

Self-report is the gold standard for measuring pain. However, decisions about pain can vary substantially within and between individuals. We measured whether self-reported pain is accompanied by metacognition and variations in confidence, similar to perceptual decision-making in other modalities. Eighty healthy volunteers underwent acute thermal pain and provided pain ratings followed by confidence judgments on continuous visual analogue scales. We investigated whether eye fixations and reaction time during pain rating might serve as implicit markers of confidence. Confidence varied across trials and increased confidence was associated with faster pain rating reaction times. The association between confidence and fixations varied across individuals as a function of the reliability of individuals' association between temperature and pain. Taken together, this work indicates that individuals can provide metacognitive judgments of pain and extends research on confidence in perceptual decision-making to pain.


Conflict of interest statement

The authors declare no competing interests.

Figures

Figure 1
Figure 1
Task design. A. Schematic of trial design. Trials began with a Heat Stimulus, followed by a three-second looking period, during which participants could look at the pain rating scale (while their eye movements were tracked) but could not make a pain rating. After three-seconds of pain rating scale presentation, an arrow appeared on the scale and participants made a pain rating for the preceding stimulus. Finally, participants provided confidence ratings. There was no time limit for pain ratings or confidence ratings. B. Heat stimulus. Each 8-s heat stimulus included 5 s of stimulation at a peak destination temperature ranging from 36 °C to 50 °C, as well as 1.5-s ramps to and from a baseline of 32 °C. After 5 s at peak temperature, the stimulus ramped down to 32 degrees Celsius in 1.5 s. C. Looking period. Example of gaze position data during the Looking period, prior to pain rating. Each circle represents a fixation on the pain rating scale. Area and numbers denote the duration of the fixation, which was not used for the current analysis. D. Confidence rating. Following pain rating, participants rated their confidence using a visual analogue scale that ranged from “Completely Certain” to “Completely Uncertain”.
Figure 2
Figure 2
Distribution of uncertainty. This figure depicts uncertainty ratings across participants, smoothed via a kernel density function (top) and depicted as raw ratings (below). Uncertainty was present during the task (Muncertainty = 9.48, SDuncertainty = 15.63); however, the scores were zero-inflated confirmed via a zero-inflation score test based on a χ12 distribution (S(β~) = 4,145,914, p < 0.001. We therefore used a two-part model to account for zero-inflated data (see Fig. 4).
Figure 3
Figure 3
Distribution of within-subject associations between Reaction Time and Uncertainty & between Time and Uncertainty. Here we depict distributions of within-subject associations with uncertainty based on rho coefficients, smoothed with a kernel density function (top) with boxplot and individual subject’s rho coefficients below. Correlations were run between uncertainty and reaction time (RT) and between uncertainty and time across trials within each participant. We ran a one sample t-test against zero on the subject-level rho coefficients for each predictor respectively. (a) There was a positive association between uncertainty and reaction time (Mrho = 0.12, SDrho = 0.24, t(71) = 4.38, p < 0.001, CI [.07, .18]) such that participants took a longer time to rate their pain when they reported more uncertainty. (b) There was a negative association between uncertainty and time (Mrho = − 0.08, SDrho = 0.34, t(71) =  − 2.05, p = 0.04, CI [− 0.16, − 0.002], such that participants reported less uncertainty on later trials (i.e. with more experience in the task).
Figure 4
Figure 4
Associations between reaction time and uncertainty based on two-part multilevel model. Top: Confidence ratings were heavily weighted toward zero (i.e. complete certainty; see also Fig. 2). We therefore used a two-part multilevel model to measure associations with uncertainty. The first (logistic) part classified trials into either ‘trials with uncertainty’ OR ‘trials with no uncertainty’ across all participant while the second (linear) part tested associations with variations in uncertainty within non-zero (i.e. uncertain) trials. Lower left: In the logistic part of the model, we evaluated whether fixations or reaction time (reaction time is shown) predicted the likelihood that a trial was rated with uncertainty or not across all participants. The solid black line represents the group estimate (exponentiated to transform from log odds to odds) and the dashed lines represents the confidence interval. Lower right: The linear part of the model evaluated whether fixations or reaction time (reaction time is shown) predict the variations in uncertainty within uncertain trials. The solid black line represents the group estimate and the dashed lines represents the confidence interval.
Figure 5
Figure 5
Differences in reaction time between certain and uncertain trials. Participants were quicker to rate pain during certain trials (t(36) = 2.70, p = .01, CI = [.03, 0.18], mean difference = 0.11 log RT (RT in ms)). (A) We used violin plots to present participant’s mean log reaction time during certain trials (left violin plot; MlogRT = 7.86 log RT, SDlogRT = 0.48) and uncertain trials (right violin plot; MlogRT = 7.96 log RT, SDlogRT = 0.45) and lines to indicate change in reaction between certain and uncertain trials for each participant. (B) We present participant difference scores (Mdifference score = 0.10, SEMdifference score = 0.038), computed by subtracting the mean reaction time during certain trials from the mean reaction time during uncertain trials for each participant. A boxplot shows the median difference value (Mediandifference score = 0.07) and interquartile range (IQR = 0.23; Q1: − 0.05, Q3: 0.18).
Figure 6
Figure 6
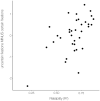
Association between reliability and the difference in fixations during certain and uncertain trials. For each participant, we computed a difference score by subtracting the average number of fixations during certain trials from the average number of fixations made during uncertain trials. The effect of certainty on fixations (y-axis) was significantly correlated with reliability (x-axis), the strength of the association between temperature and pain (r = 0.57, p < .001). This association is still present, although weaker, when the outlier near the graph’s origin is removed (r = 0.4, p = .02).

References

    1. Atlas LY, Wager TD. How expectations shape pain. Neurosci. Lett. 2012;520:140–148. doi: 10.1016/j.neulet.2012.03.039. - DOI - PubMed
    1. Eccleston C, Crombez G. Pain demands attention: a cognitive-affective model of the interruptive function of pain. Psychol. Bull. 1999;125:356–366. doi: 10.1037/0033-2909.125.3.356. - DOI - PubMed
    1. Gracely, R. H., & Dubner, R. Reliability and vapidity of verbal descriptor scales of painfulness. Pain29, 175–185 10.1016/0304-3959(87)91034-7 (1987). - PubMed
    1. Lumley, M. A. et al. Pain and Emotion: A Biopsychosocial review of recent research. J. clin. psychol.67, 942–968 (2011). - PMC - PubMed
    1. Price DD, Harkins SW, Baker C. Sensory-affective relationships among different types of clinical and experimental pain. Pain. 1987;28:297–307. doi: 10.1016/0304-3959(87)90065-0. - DOI - PubMed

Publication types