. 2021 May;28(5):1705-1719.
doi: 10.1038/s41418-020-00695-7. Epub 2020 Dec 7.

Functional crosstalk between myeloid Foxo1-β-catenin axis and Hedgehog/Gli1 signaling in oxidative stress response

Affiliations

Functional crosstalk between myeloid Foxo1-β-catenin axis and Hedgehog/Gli1 signaling in oxidative stress response

Changyong Li et al. Cell Death Differ. 2021 May.

Abstract

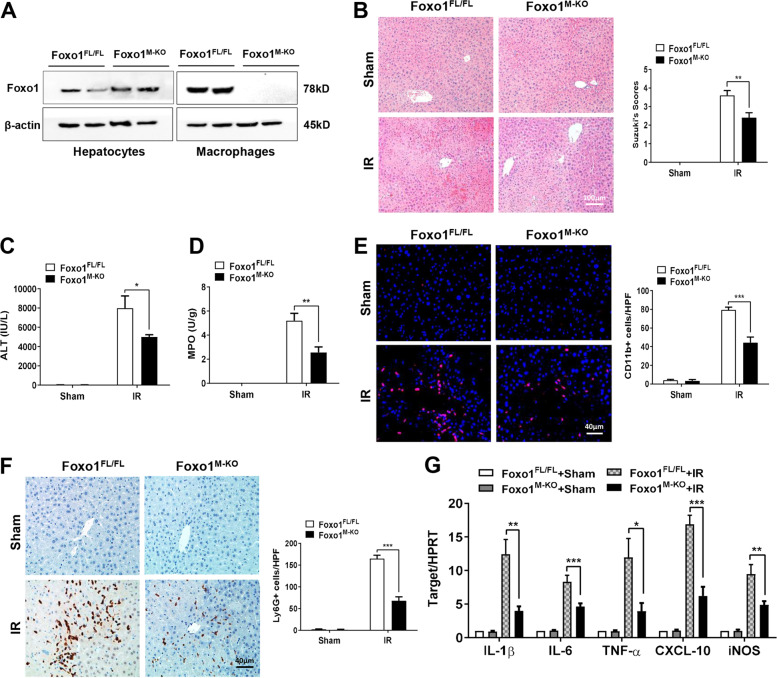
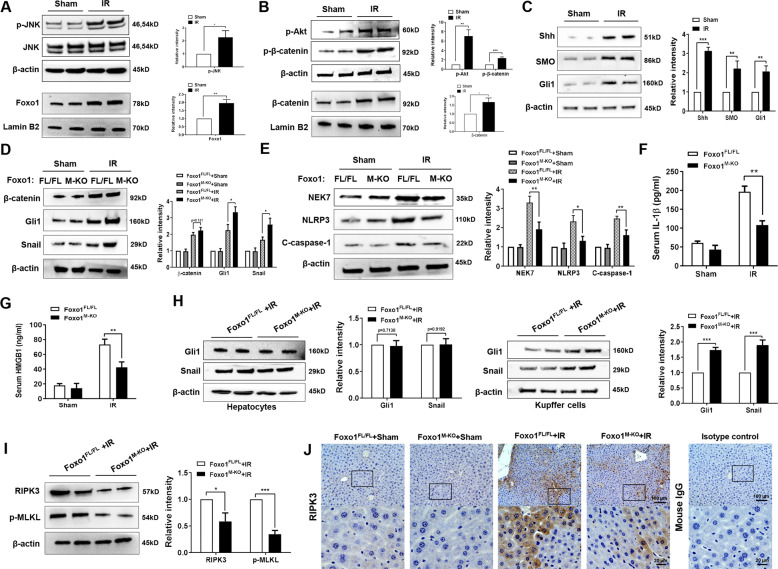
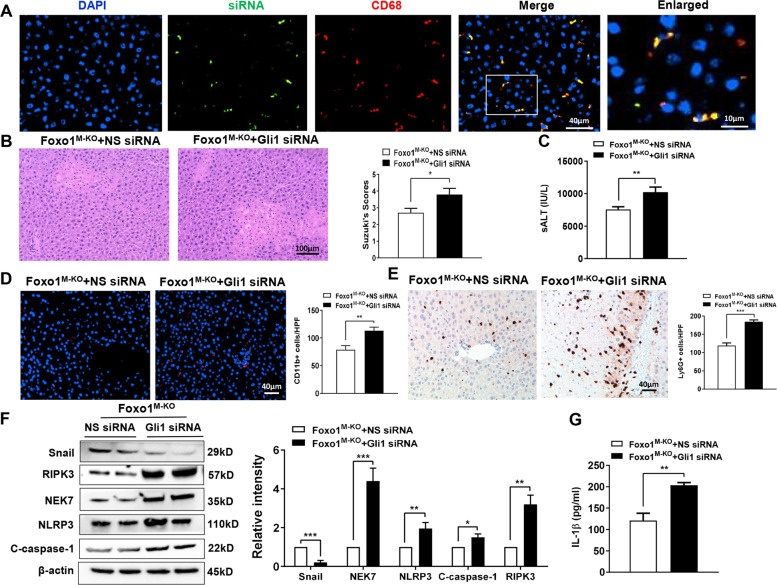
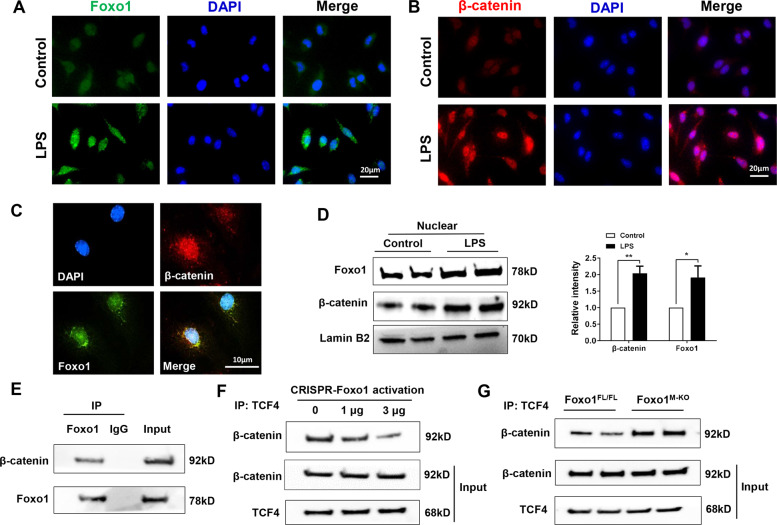
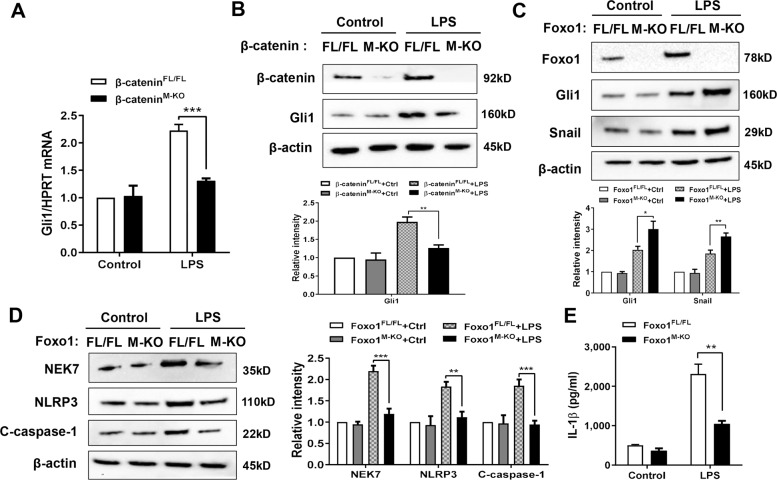
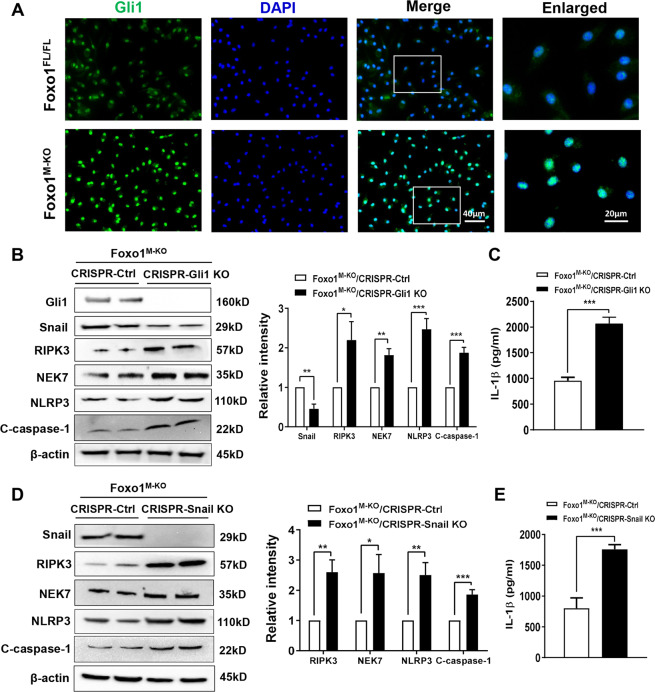
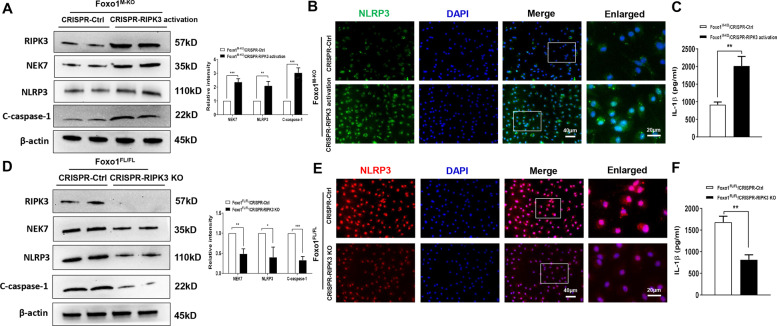
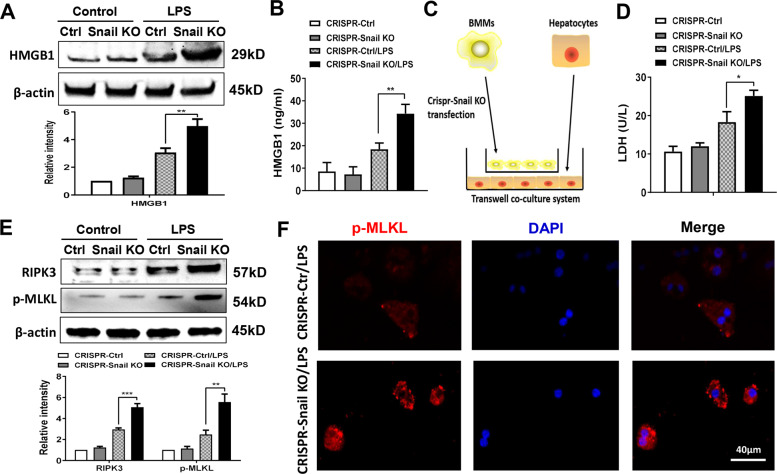
Foxo1 transcription factor is an evolutionarily conserved regulator of cell metabolism, oxidative stress, inflammation, and apoptosis. Activation of Hedgehog/Gli signaling is known to regulate cell growth, differentiation, and immune function. However, the molecular mechanisms by which interactive cell signaling networks restrain oxidative stress response and necroptosis are still poorly understood. Here, we report that myeloid-specific Foxo1 knockout (Foxo1M-KO) mice were resistant to oxidative stress-induced hepatocellular damage with reduced macrophage/neutrophil infiltration, and proinflammatory mediators in liver ischemia/reperfusion injury (IRI). Foxo1M-KO enhanced β-catenin-mediated Gli1/Snail activity, and reduced receptor-interacting protein kinase 3 (RIPK3) and NIMA-related kinase 7 (NEK7)/NLRP3 expression in IR-stressed livers. Disruption of Gli1 in Foxo1M-KO livers deteriorated liver function, diminished Snail, and augmented RIPK3 and NEK7/NLRP3. Mechanistically, macrophage Foxo1 and β-catenin colocalized in the nucleus, whereby the Foxo1 competed with T-cell factor (TCF) for interaction with β-catenin under inflammatory conditions. Disruption of the Foxo1-β-catenin axis by Foxo1 deletion enhanced β-catenin/TCF binding, activated Gli1/Snail signaling, leading to inhibited RIPK3 and NEK7/NLRP3. Furthermore, macrophage Gli1 or Snail knockout activated RIPK3 and increased hepatocyte necroptosis, while macrophage RIPK3 ablation diminished NEK7/NLRP3-driven inflammatory response. Our findings underscore a novel molecular mechanism of the myeloid Foxo1-β-catenin axis in regulating Hedgehog/Gli1 function that is key in oxidative stress-induced liver inflammation and necroptosis.


Conflict of interest statement

The authors declare that they have no conflict of interest.

Figures

Fig. 1
Fig. 1. Disruption of myeloid-specific Foxo1 alleviates IR-induced liver injury and reduces macrophage/neutrophil infiltration and proinflammatory mediators in IR- stressed liver.
A The Foxo1 expression was detected by western blot assay in hepatocytes and liver macrophages from the Foxo1FL/FL and Foxo1M-KO ischemic livers. Representative of three experiments. B Representative histological staining (H&E) of ischemic liver tissue (n = 4–6 mice/group) and Suzuki’s histological score. Scale bars, 100 μm. C Liver function in serum samples was evaluated by serum ALT levels (IU/L; n = 4–6 samples/group). D Liver neutrophil accumulation, analyzed by MPO activity (U/g; n = 4–6 samples/group). E Immunofluorescence staining of CD11b+ macrophages in ischemic livers (n = 4–6 mice/group). Quantification of CD11b+ macrophages, Scale bars, 40 μm. F Immunohistochemistry staining of Ly6G+ neutrophils in ischemic livers (n = 4–6 mice/group). Quantification of Ly6G+ neutrophils, Scale bars, 40 μm. G Quantitative RT-PCR-assisted detection of IL-1β, IL-6, TNF-α, CXCL-10, and iNOS in ischemic livers (n = 3–4 samples/group). All data represent the mean ± SD. *p < 0.05, **p < 0.01, ***p < 0.001.
Fig. 2
Fig. 2. Disruption of myeloid-specific Foxo1 activates the Hedgehog/Gli1 signaling, and inhibits RIPK3 and NEK7/NLRP3 activation in IR-stressed liver.
Western-assisted analysis and relative density ratio of A p-JNK, Foxo1, B p-Akt, p-β-catenin, β-catenin, C Shh, SMO, and Gli1 in the WT ischemic livers. Western-assisted analysis and relative density ratio of D β-catenin, Gli1, Snail, E NEK7, NLRP3, and cleaved caspase-1 in the Foxo1FL/FL and Foxo1M-KO ischemic livers. ELISA analysis of serum IL-1β (F) and HMGB1 (G) levels in the Foxo1FL/FL and Foxo1M-KO mice after liver IRI (n = 3–4 samples/group). H The expression of Gli1 and Snail was detected in hepatocytes and Kupffer cells by western blot assay. I Western-assisted analysis and relative density ratio of RIPK3 and p-MLKL in the Foxo1FL/FL and Foxo1M-KO ischemic livers. J Immunohistochemistry staining of RIPK3 expression in ischemic livers (n = 4–6 mice/group). Scale bars, 100 and 20 μm. All western blots represent three experiments and the data represent the mean ± SD. *p < 0.05, **p < 0.01, ***p < 0.001.
Fig. 3
Fig. 3. Hedgehog/Gli1 signaling is required for the regulation of NEK7/NLRP3 and RIPK3 activation in myeloid Foxo1-deficient livers in response to IR stress.
A Immunofluorescence staining of AlexaFluor488-labeled control siRNA and CD68-positive macrophages in ischemic liver tissue (n = 3–4 mice/group), Scale bars, 40 and 10 μm. B Representative histological staining (H&E) of ischemic liver tissue (n = 4–6 mice/group) and Suzuki’s histological score. Scale bars, 100 μm. C Serum ALT levels (IU/L; n = 4–6 samples/group). D Immunofluorescence staining of CD11b+ macrophages in ischemic livers (n = 4–6 mice/group). Quantification of CD11b+ macrophages, Scale bars, 40 μm. E Immunohistochemistry staining of Ly6G+ neutrophils in ischemic livers (n = 4–6 mice/group). Quantification of Ly6G+ neutrophils, Scale bars, 40 μm. F Western-assisted analysis and relative density ratio of Snail, NEK7, NLRP3, cleaved caspase-1, and RIPK3. Representative of three experiments. G ELISA analysis of serum IL-1β levels (n = 3–4 samples/group). All data represent the mean ± SD. *p < 0.05, **p < 0.01, ***p < 0.001.
Fig. 4
Fig. 4. Foxo1 competes with TCF for interaction with β-catenin and inhibits β-catenin/TCF activity in macrophages.
Bone marrow-derived macrophages (BMMs) were cultured with or without LPS for 6 h. Immunofluorescence staining of A nuclear Foxo1 (green) and B β-catenin (red) in LPS-stimulated macrophages. DAPI was used to visualize nuclei (blue). Scale bars, 20 μm. C Immunofluorescence staining for macrophage Foxo1 (green) and β-catenin (red) colocalization in the nucleus after LPS stimulation. Scale bars, 10 μm. D Western blot-assisted analysis and relative density ratio of nuclear Foxo1 and β-catenin in LPS-stimulated macrophages. Representative of three experiments. E Immunoprecipitation analysis of Foxo1 and β-catenin in LPS-stimulated macrophages. Representative of three experiments. F BMMs were transfected with CRISPR-Foxo1 activation vector (1 and 3 µg, respectively). Immunoprecipitation analysis of β-catenin and TCF4 in macrophages after LPS stimulation. G Immunoprecipitation analysis of β-catenin and TCF4 in LPS-stimulated macrophages from Foxo1FL/FL and Foxo1M-KO mice. All data represent the mean ± SD. *p < 0.05, **p < 0.01.
Fig. 5
Fig. 5. Foxo1 deficiency promotes β-catenin-mediated Gli1 activation and inhibits NEK7/NLRP3-driven inflammatory response in macrophages.
BMMs were isolated from Foxo1FL/FL, Foxo1M-KO, β-cateninFL/FL, and β-cateninM-KO mice and incubated with LPS. A Quantitative RT-PCR-assisted analysis of Gli1 mRNA in LPS-stimulated BMMs (n = 3–4 samples/group). Western blots analysis and relative density ratio of B β-catenin and Gli1, C Foxo1, Gli1, and Snail, D NEK7, NLRP3, and cleaved caspase-1. Representative of three experiments. E ELISA analysis of supernatant IL-1β levels (n = 3–4 samples/group). All data represent the mean ± SD. *p < 0.05, **p < 0.01, ***p < 0.001.
Fig. 6
Fig. 6. Gli1 is crucial for the myeloid Foxo1 signaling-mediated immune regulation of RIPK3 and NEK7/NLRP3 activation in macrophages.
A BMMs were isolated from Foxo1M-KO mice and incubated with LPS. Representative immunofluorescence staining for the Gli1 expression in macrophages (n = 3–4 samples/group). DAPI was used to visualize nuclei. Scale bars, 40 and 20 μm. B BMMs from Foxo1M-KO mice were transfected with p-CRISPR-Gli1 KO or control vector followed by LPS stimulation. Western blots analysis and relative density ratio of Gli1, Snail, RIPK3, NEK7, NLRP3, and cleaved caspase-1. Representative of three experiments. C ELISA analysis of supernatant IL-1β levels (n = 3–4 samples/group). D BMMs from Foxo1M-KO mice were transfected with the p-CRISPR-Snail KO or control vector followed by LPS stimulation. Western-assisted analysis and relative density ratio of Snail, RIPK3, NEK7, NLRP3, and cleaved caspase-1. E ELISA analysis of supernatant IL-1β levels (n = 3–4 samples/group). Representative of three experiments. All data represent the mean ± SD. *p < 0.05, **p < 0.01, ***p < 0.001.
Fig. 7
Fig. 7. RIPK3 promotes NEK7/NLRP3 activation in myeloid Foxo1-mediated immune response in macrophages.
BMMs were isolated from Foxo1M-KO and Foxo1FL/FL mice and transfected with the p-CRISPR-RIPK3 activation, p-CRISPR-RIPK3 KO, or control vector followed by LPS stimulation. A, D Western blots analysis and relative density ratio of RIPK3, NEK7, NLRP3, and cleaved caspase-1. B, E Immunofluorescence staining for the NLRP3 expression in macrophages. C, F ELISA analysis of supernatant IL-1β levels. All western blots represent three experiments, and 3–4 samples each group for immunofluorescence staining and ELISA assay. DAPI was used to visualize nuclei. Scale bars, 40 and 20 μm. The data represent the mean ± SD. *p < 0.05, **p < 0.01, ***p < 0.001.
Fig. 8
Fig. 8. Myeloid Foxo1 signaling-mediated Snail regulates RIPK3-mediated hepatocyte necroptosis during inflammatory response.
BMMs were isolated from Foxo1M-KO mice and transfected with the p-CRISPR-Snail KO or control vector followed by LPS stimulation. A Western-assisted analysis and relative density ratio of HMGB1 in LPS-stimulated BMMs. Representative of three experiments. B ELISA analysis of supernatant HMGB1 levels in LPS-stimulated BMMs (n = 3–4 samples/group). C Schematic figure for macrophage/hepatocyte co-culture system. D BMMs transfected with the p-CRISPR-Snail KO were stimulated with LPS, and then co-cultured with primary hepatocytes that were supplemented with or without H2O2 for 24 h. LDH release from hepatocytes in co-cultures (n = 3–4 samples/group). E Western-assisted analysis and relative density ratio of RIPK3 and p-MLKL in hepatocytes after co-culture. Representative of three experiments. F Immunofluorescence staining of p-MLKL+ hepatocytes after co-culture (n = 4–6 mice/group). Scale bars, 40 μm. All data represent the mean ± SD. *p < 0.05, **p < 0.01, ***p < 0.001.

References

    1. Chen GY, Nunez G. Sterile inflammation: sensing and reacting to damage. Nat Rev Immunol. 2010;10:826–837. - PMC - PubMed
    1. Chen Y, Zhou Z, Min W. Mitochondria, oxidative stress and innate immunity. Front Physiol. 2018;9:1487. - PMC - PubMed
    1. Lotze MT, Zeh HJ, Rubartelli A, Sparvero LJ, Amoscato AA, Washburn NR, et al. The grateful dead: damage-associated molecular pattern molecules and reduction/oxidation regulate immunity. Immunol Rev. 2007;220:60–81. - PubMed
    1. Bianchi ME. DAMPs, PAMPs and alarmins: all we need to know about danger. J Leukoc Biol. 2007;81:1–5. - PubMed
    1. Yue S, Zhu J, Zhang M, Li C, Zhou X, Zhou M, et al. The myeloid heat shock transcription factor 1/beta-catenin axis regulates NLR family, pyrin domain-containing 3 inflammasome activation in mouse liver ischemia/reperfusion injury. Hepatology. 2016;64:1683–1698. - PMC - PubMed

Publication types