. 2021 Mar;39(3):313-319.
doi: 10.1038/s41587-020-0739-1. Epub 2020 Dec 7.

Highly sensitive spatial transcriptomics at near-cellular resolution with Slide-seqV2

Affiliations

Highly sensitive spatial transcriptomics at near-cellular resolution with Slide-seqV2

Robert R Stickels et al. Nat Biotechnol. 2021 Mar.

Abstract

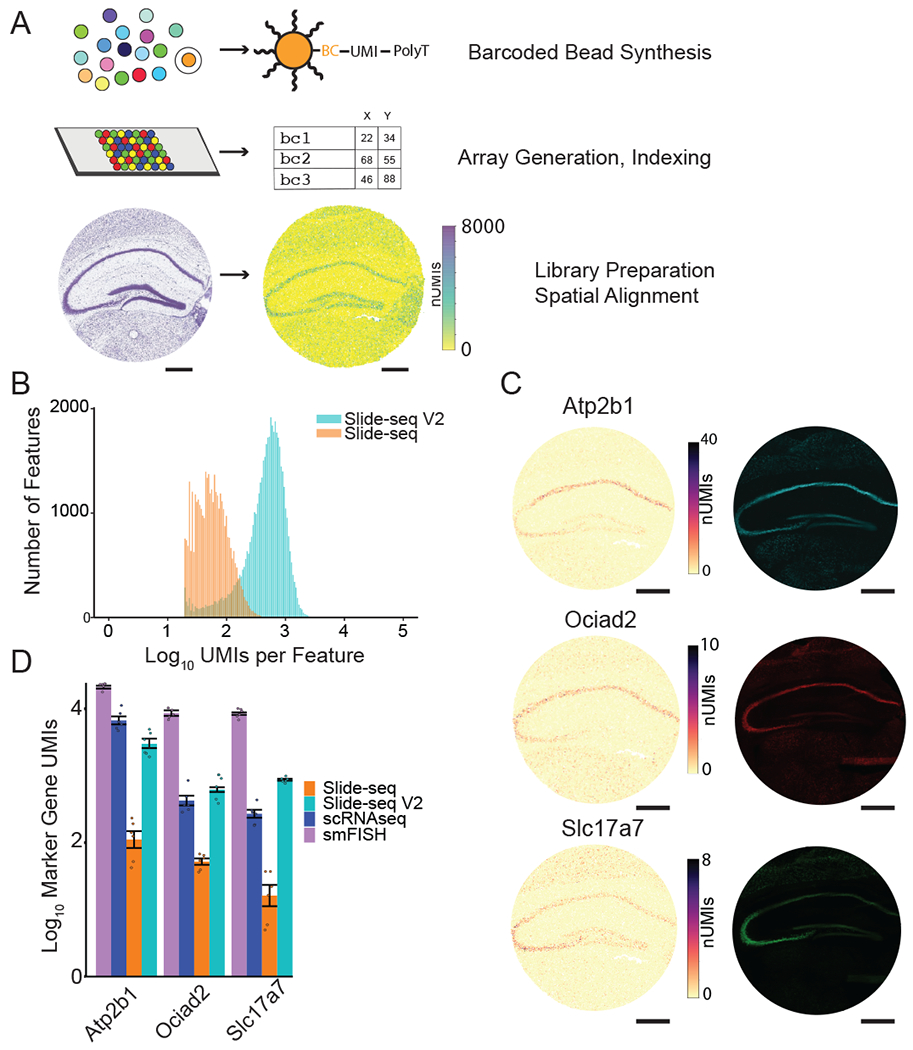
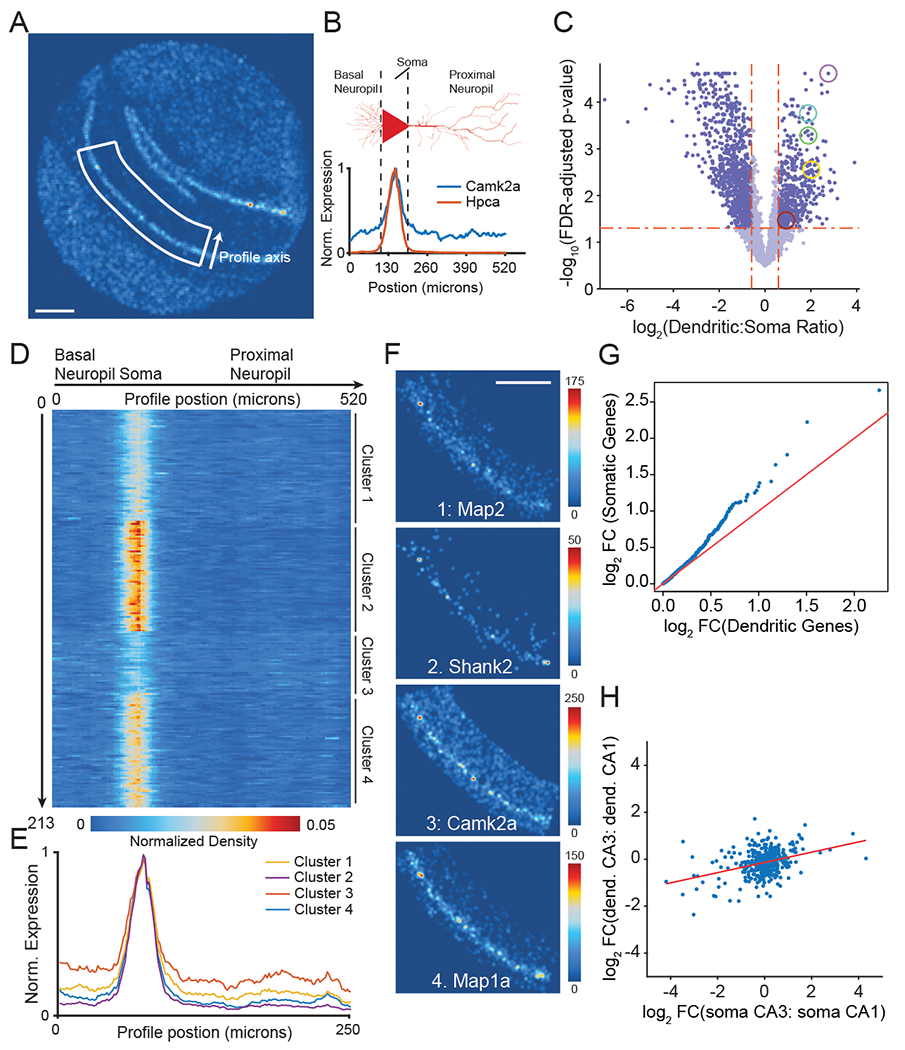
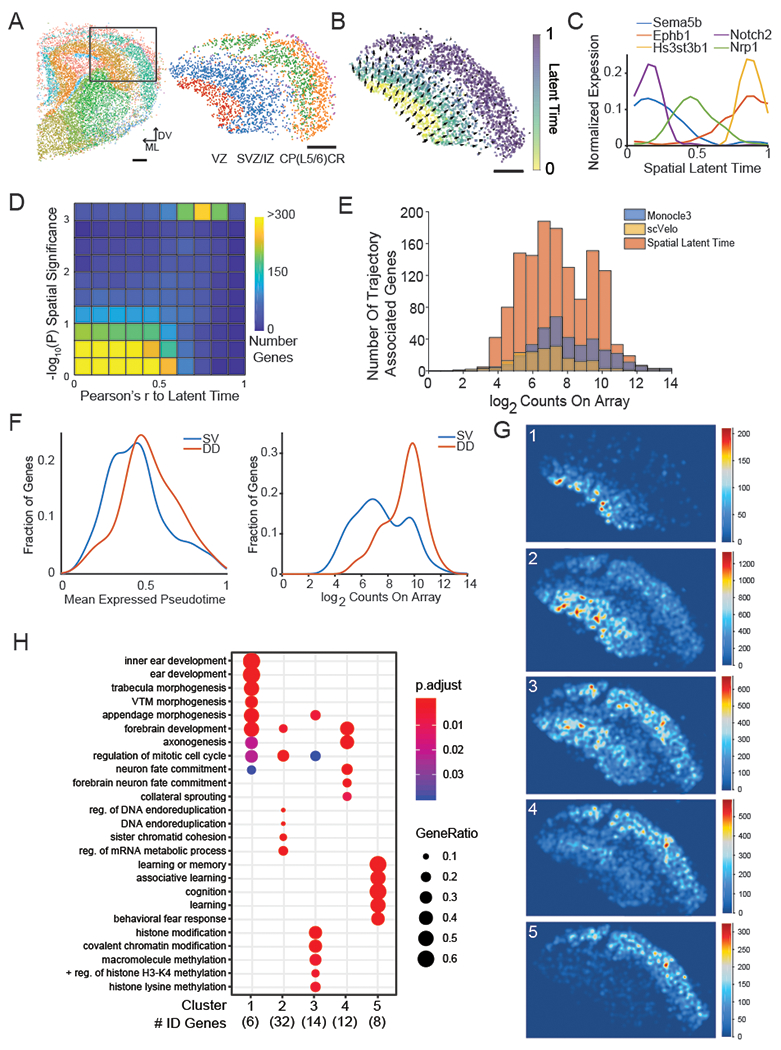
Measurement of the location of molecules in tissues is essential for understanding tissue formation and function. Previously, we developed Slide-seq, a technology that enables transcriptome-wide detection of RNAs with a spatial resolution of 10 μm. Here we report Slide-seqV2, which combines improvements in library generation, bead synthesis and array indexing to reach an RNA capture efficiency ~50% that of single-cell RNA-seq data (~10-fold greater than Slide-seq), approaching the detection efficiency of droplet-based single-cell RNA-seq techniques. First, we leverage the detection efficiency of Slide-seqV2 to identify dendritically localized mRNAs in neurons of the mouse hippocampus. Second, we integrate the spatial information of Slide-seqV2 data with single-cell trajectory analysis tools to characterize the spatiotemporal development of the mouse neocortex, identifying underlying genetic programs that were poorly sampled with Slide-seq. The combination of near-cellular resolution and high transcript detection efficiency makes Slide-seqV2 useful across many experimental contexts.


Conflict of interest statement

Competing Interests:

R.R.S., F.C., and E.Z.M. are listed as inventors on a pending patent application related to the development of Slide-seq.

Figures

Figure 1:
Figure 1:. Highly improved mRNA detection sensitivity in Slide-seqV2.
A) Overview of the Slide-seq method. An example array of mouse hippocampus generated with Slide-seqV2, with each bead colored by the number of UMIs. B) Histogram of number of UMIs per bead for Slide-seq (red) versus Slide-seqV2 (blue) on serial mouse embryo sections. C) Images of marker genes of hippocampus in Slide-seqV2 (left column) versus HCR FISH images (right column, N=1 HCR experiment on serial section of Slide-seq data shown). D) Comparison of marker gene counts in mouse hippocampus CA1 across four modalities (N = 6 measurements per modality, mean ∓ sd reported in Supplementary Table 2). For smFISH, Slide-seqV2 and Slide-seq data, all transcript counts within a fixed area of CA1 were summed together; for scRNA-seq, we summed the counts for the number of CA1 pyramidal cells counted within this area. (All scale bars 500 μm)
Figure 2:
Figure 2:. Slide-seqV2 reveals spatial patterning of dendritically enriched mRNAs.
A) Spatial heatmap of number of UMIs for a hippocampal Slide-seqV2 dataset. B) (top) Schematic of linear spatial profiling across CA1 soma and dendrites. (bottom) Spatial profiles of a CA1 marker (Hpca, red), and a classically dendritically localized gene (Camk2a, blue) are shown. C) Differentially expressed genes in soma versus proximal dendrites. Highlighted are genes with FDR-corrected p-value <0.05 and fold change >2. Several classically known dendritically expressed genes are circled: (Camk2a, (FDR adjusted p = 2.8×10⁻³, Yellow), Ef1a (FDR adjusted p = 5×10⁻⁴, Green), Prkcz (FDR adjusted p = .034, Red), Map2 (FDR adjusted p = 1.7×10⁻⁴, Teal) and Ddn (FDR adjusted p = 2.×10−5, Purple). Two tailed, two sample t-test (N=5 tissue sections). D) Expression heatmap of 237 dendritically enriched RNAs across the neuronal profile axis. Genes are shown clustered by their spatial profile (k-means clustering, 4 clusters). Rows are normalized and sum to 1. E) Average spatial expression profile of each of the four gene clusters identified in D across CA1. F) Slide-seqV2 reconstruction images of one synaptic protein-encoding gene from each of the four clusters in D. Scale bars are 500 μm for all Slide-seqV2 reconstructions. Color bar represents the total number of UMIs detected for gene. G) Quantile-quantile plot of the log2 fold-change (log2 FC) between CA1 and CA3/dentate pyramidal cell types (defined by scRNA-seq) of dendritic (x-axis), compared with somatic (y-axis) gene sets defined by the analysis in C. H) Ratio of expression between CA3 and CA1 regions in soma and dendrites for Slide-seqV2 data. Linear fit shown in red (slope = 0.22, R2 = 0.13).
Figure 3:
Figure 3:. Slide-seqV2 of developing mouse cortex reconstructs spatial developmental trajectories
A) Left: Unsupervised cluster analysis of Slide-seqV2 data obtained from a section of E15 mouse brain. Black box delineated the region used in the analysis. (Scale bar, 200 μm, ML: medial/lateral axis, DV: dorsal ventral axis). Right: Beads present within black-box inset from top, colored by their annotated cluster identities, subsetted by clusters of cortical identity. Red = Ventricular Zone (VZ), Blue/Purple = Subventricular Zone/ Intermediate Zone, Green/ Orange = Cortical Plate/ Layer 5 / 6, Pink = Cajal Retzius Cells (CR cells). These reflect the layers present in the mouse cortex at this time point. B) Beads within the anatomical region of developing cortex, colored by their assigned latent time metric from scVelo. Arrow size and direction correspond to the direction and magnitude of the spatial derivative of the latent time in physical space. C) Expression profiles of sample genes jointly identified by Slide-seqV2, scVelo and Monocle3, across the Slide-seqV2-generated spatial latent time axis. D) Two-dimensional density plot quantifying the relationship between a gene’s correlation with scVelo latent time (x-axis)and spatial significance (Permutation test, one-sided, y-axis), see Methods). Each square is colored by the number of genes found in that bin. E) Stacked histogram of the number of genes associated to the developmental trajectory by Monocle3 (blue), scVelo (yellow), and spatial latent time (red), binned by expression level . F) left: density plot of all spatial latent time genes (SV) compared to DD latent time genes (DD) across mean expressed latent time value; right: density plot of all spatial latent time genes (SV) compared to DD latent time genes (DD) for summed gene expression across array. G) Slide-seqV2 reconstruction images of metagenes associated with each spatial cluster of DD genes (Methods). H) Gene-ontology classifications using over-representation analysis (Methods) for biological process terms for each spatial cluster in G (Hypergeometric test, FDR-corrected p-value).

References

Main Text References:

    1. Rodriques SG et al. Slide-seq: A scalable technology for measuring genome-wide expression at high spatial resolution. Science 363, 1463–1467 (2019). - PMC - PubMed
    1. Chen KH, Boettiger AN, Moffitt JR, Wang S & Zhuang X RNA imaging. Spatially resolved, highly multiplexed RNA profiling in single cells. Science 348, aaa6090 (2015). - PMC - PubMed
    1. Wang X et al. Three-dimensional intact-tissue sequencing of single-cell transcriptional states. Science 361, (2018). - PMC - PubMed
    1. Shah S, Lubeck E, Zhou W & Cai L In Situ Transcription Profiling of Single Cells Reveals Spatial Organization of Cells in the Mouse Hippocampus. Neuron 92, 342–357 (2016). - PMC - PubMed
    1. Codeluppi S et al. Spatial organization of the somatosensory cortex revealed by osmFISH. Nat. Methods 15, 932–935 (2018). - PubMed

Online Methods References:

    1. McKernan KJ et al. Sequence and structural variation in a human genome uncovered by short-read, massively parallel ligation sequencing using two-base encoding. Genome Research vol. 19 1527–1541 (2009). - PMC - PubMed
    1. Dobin A et al. STAR: ultrafast universal RNA-seq aligner. Bioinformatics 29, 15–21 (2013). - PMC - PubMed
    1. Storey JD A Direct Approach to False Discovery Rates. J. R. Stat. Soc. Series B Stat. Methodol 64, 479–498 (2002).
    1. Yu G, Wang L-G, Han Y & He Q-Y clusterProfiler: an R package for comparing biological themes among gene clusters. OMICS 16, 284–287 (2012). - PMC - PubMed
    1. org.Mm.eg.db. Bioconductor http://bioconductor.org/packages/release/data/annotation/html/org.Mm.eg.....

Publication types