. 2021 Jan;24(1):34-46.
doi: 10.1038/s41593-020-00736-x. Epub 2020 Dec 7.

Diversification of molecularly defined myenteric neuron classes revealed by single-cell RNA sequencing

Affiliations

Diversification of molecularly defined myenteric neuron classes revealed by single-cell RNA sequencing

Khomgrit Morarach et al. Nat Neurosci. 2021 Jan.

Abstract

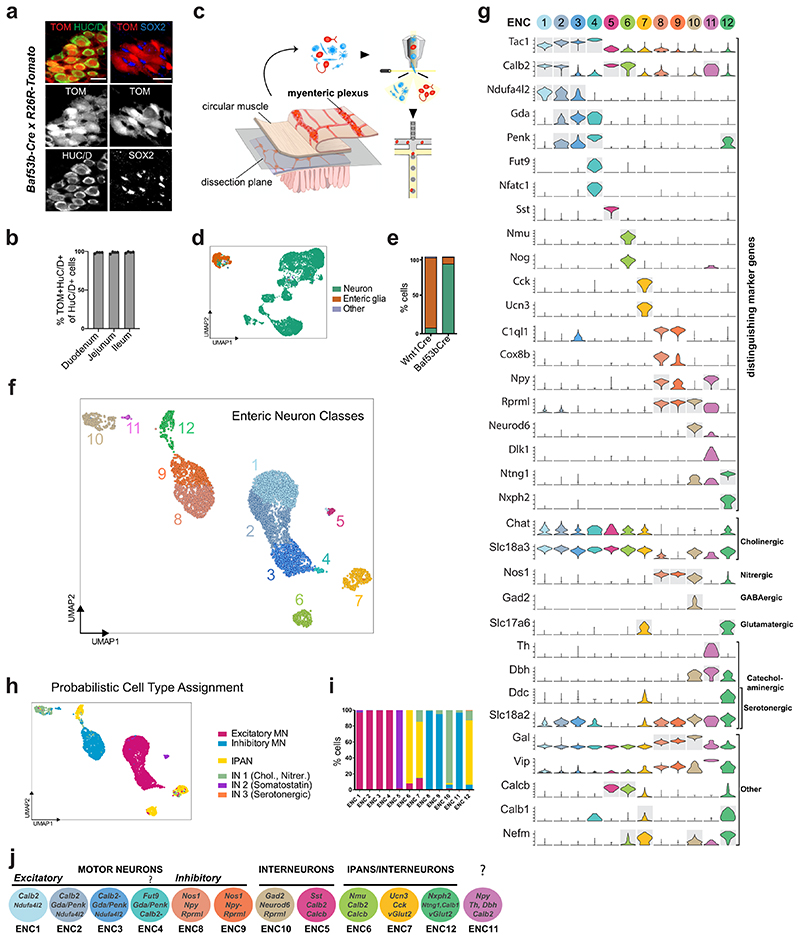
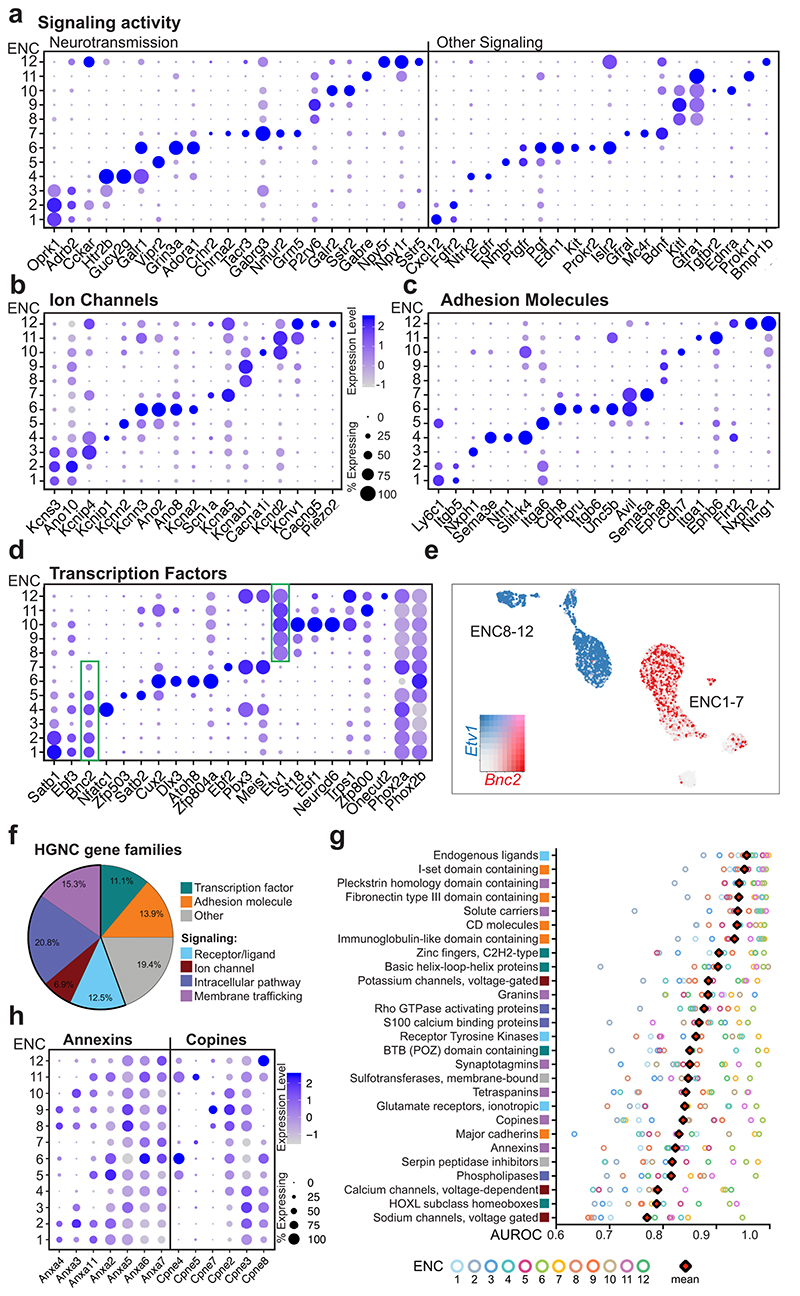
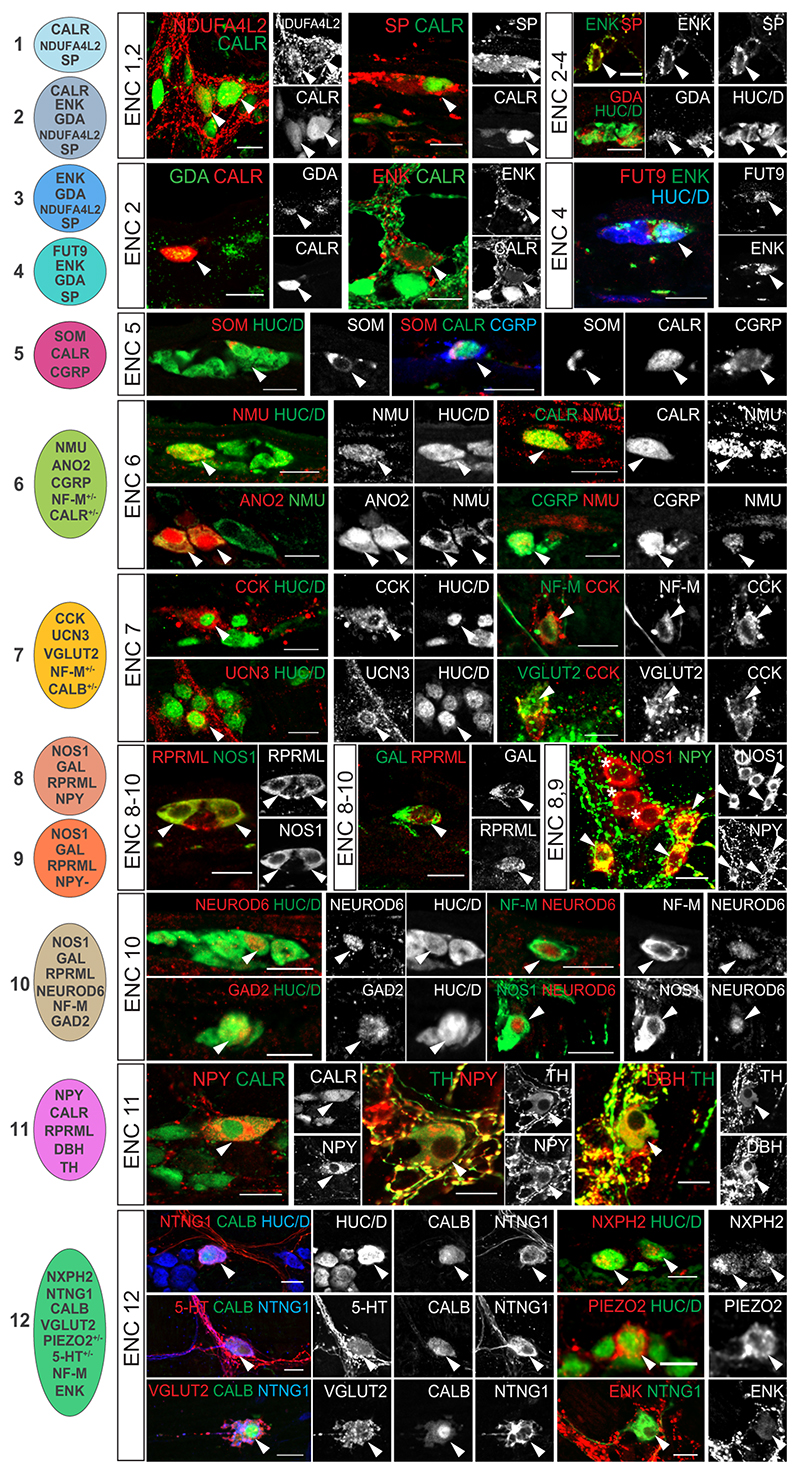
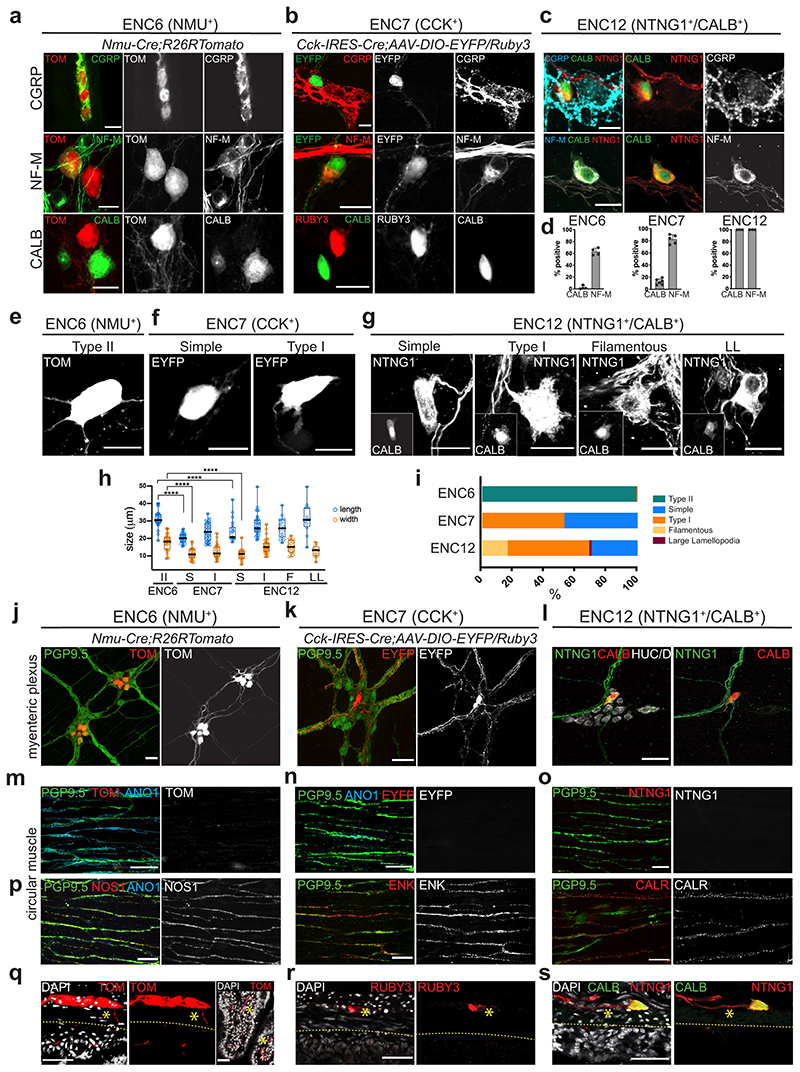
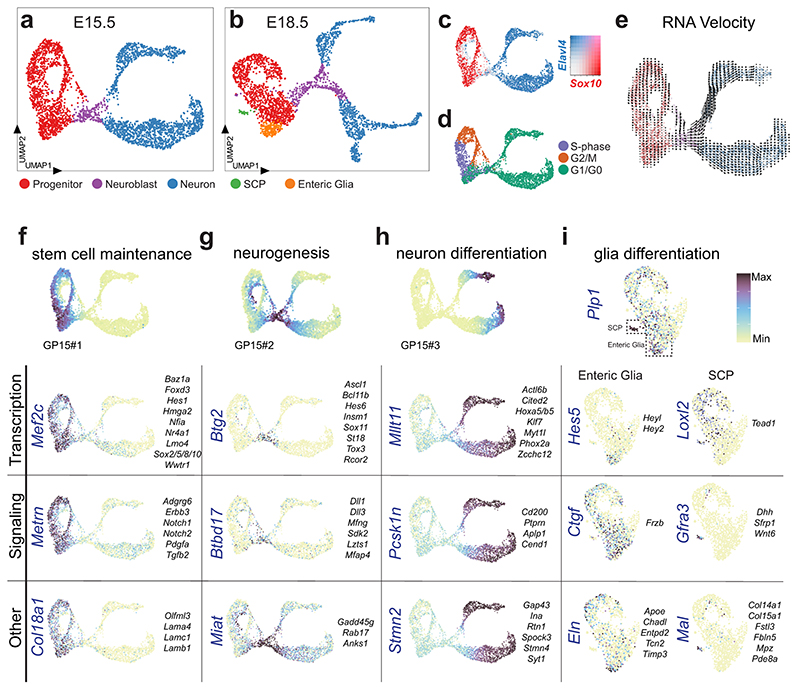
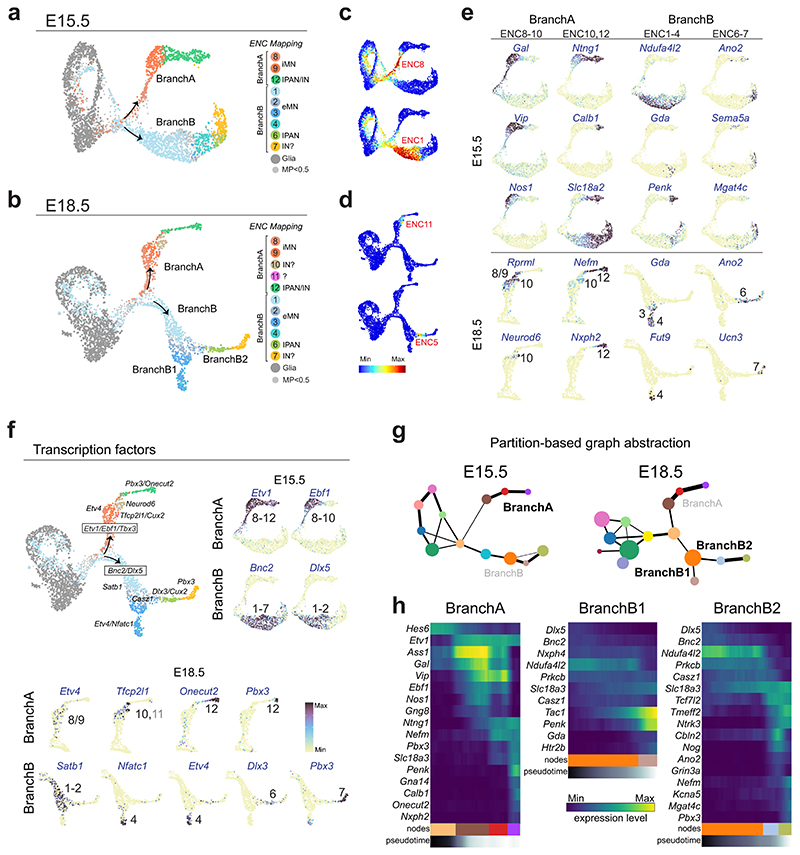
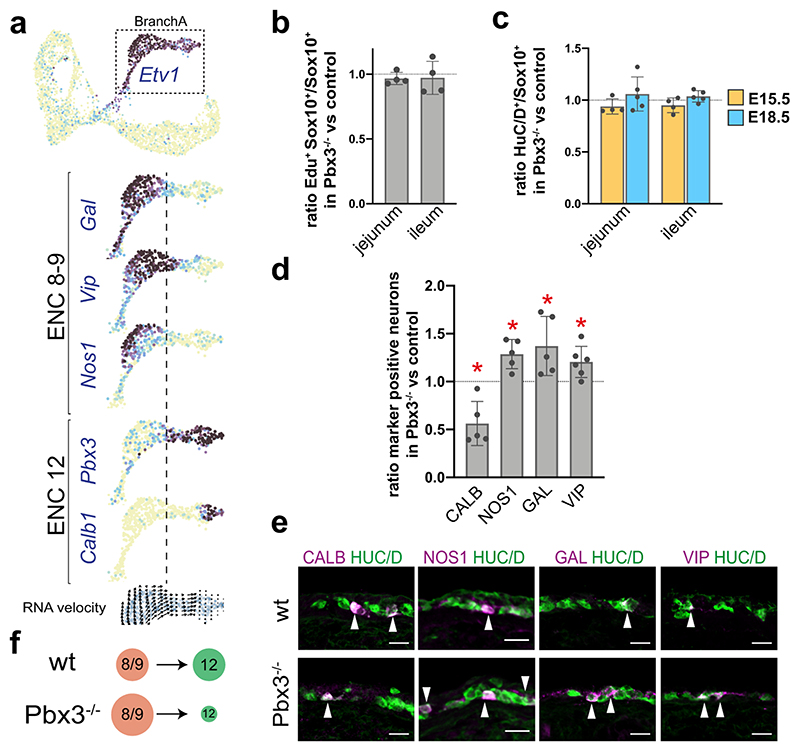
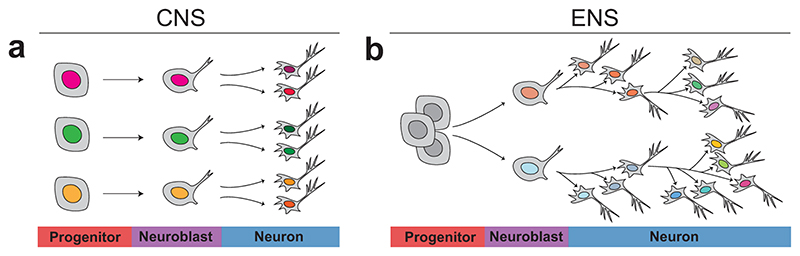
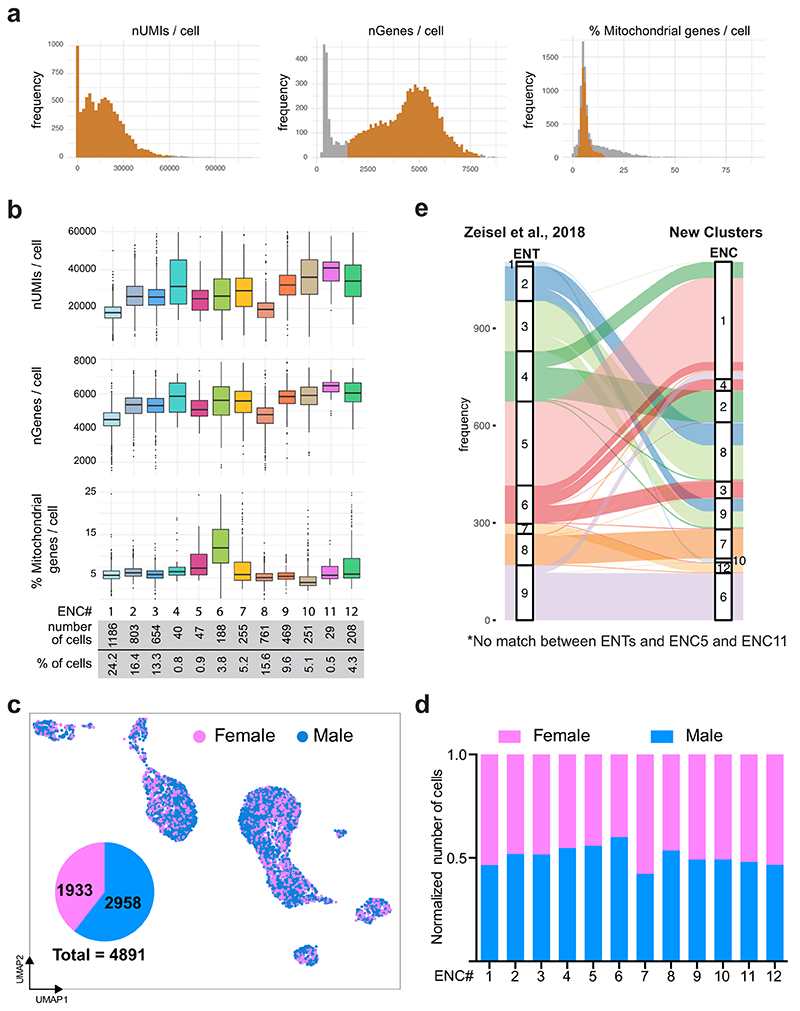
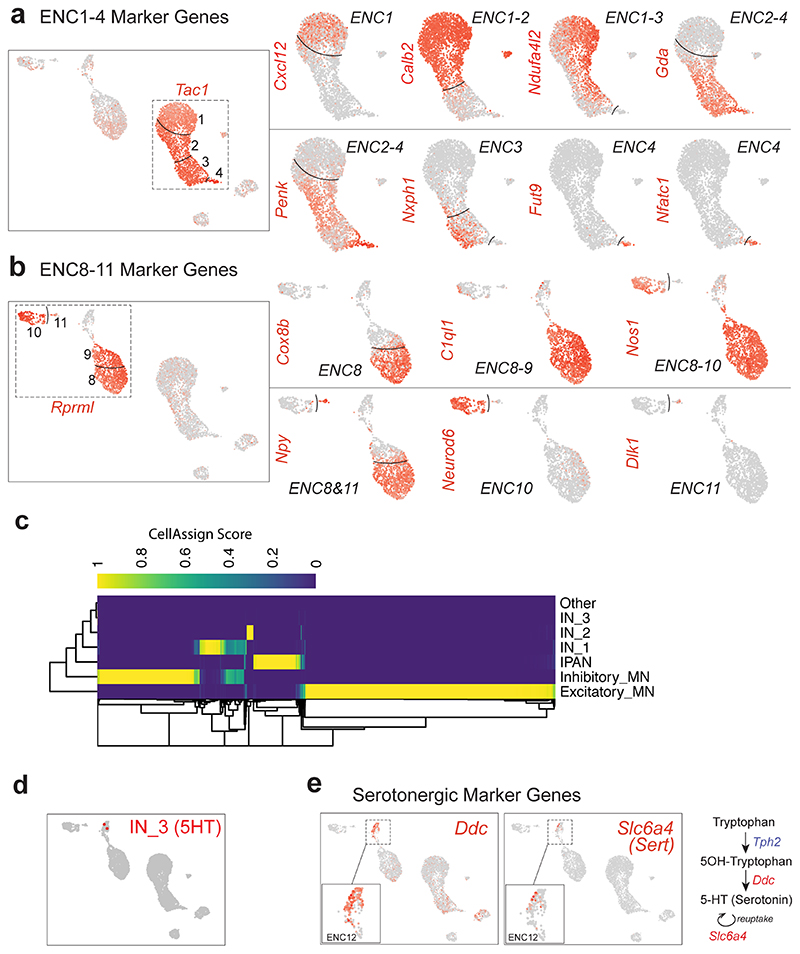
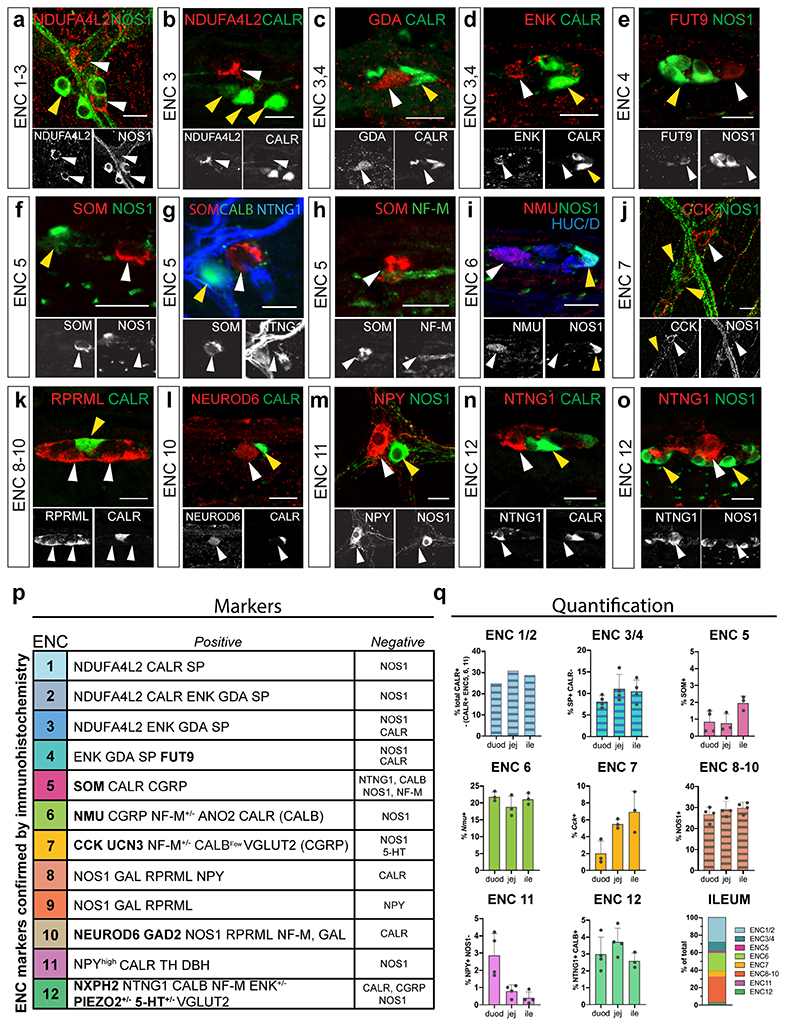
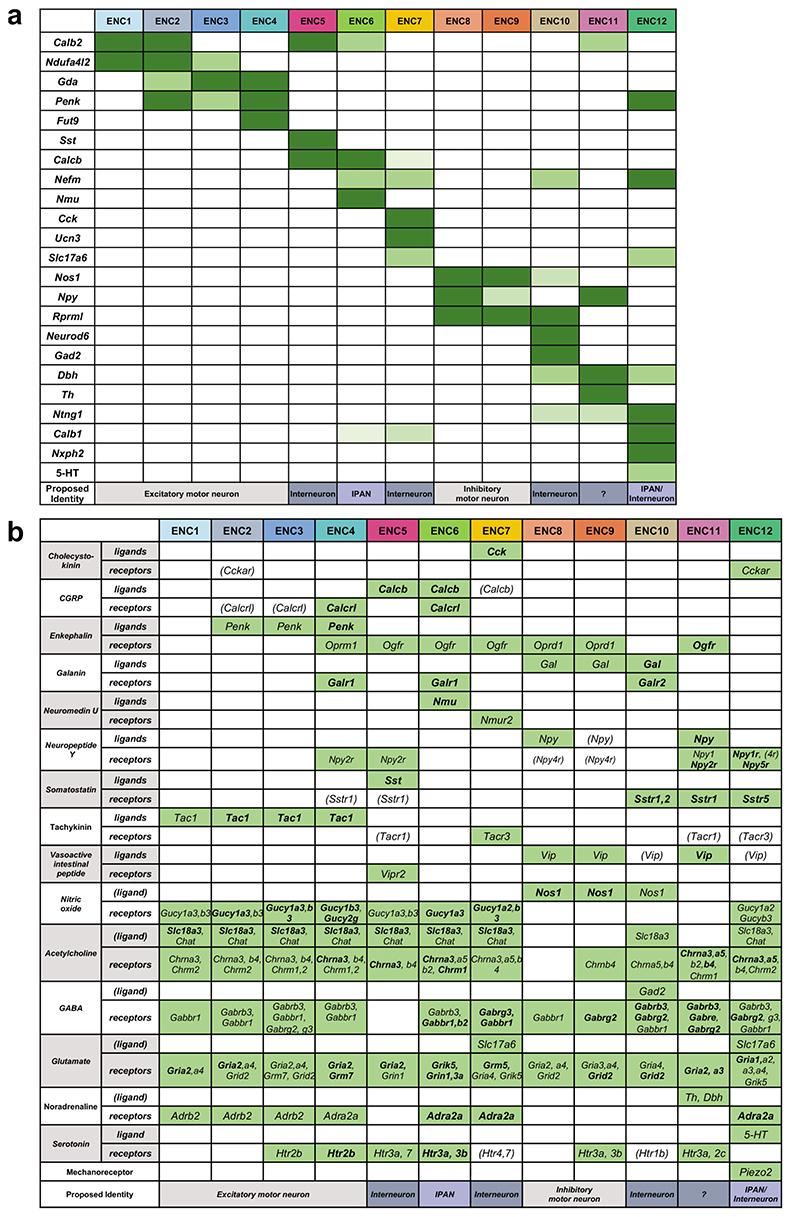
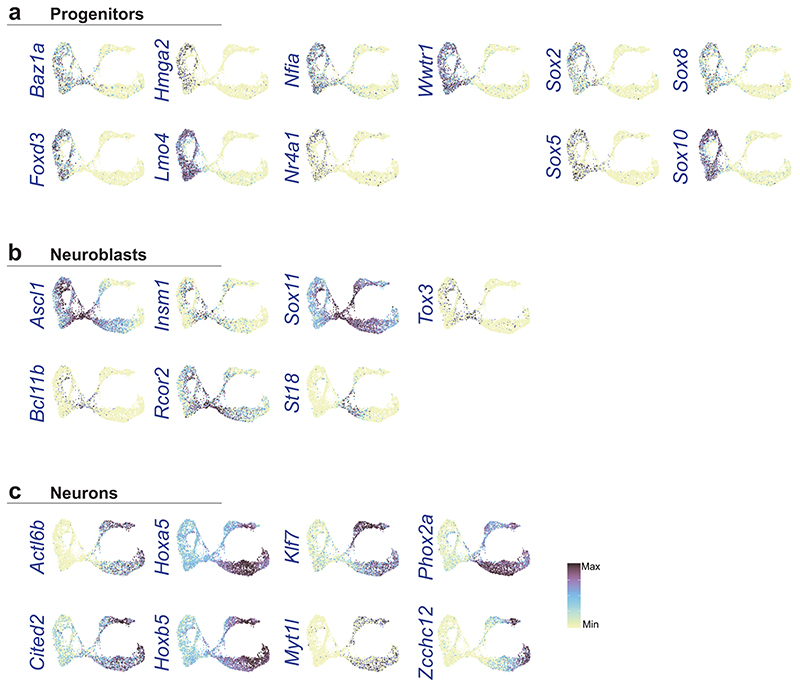
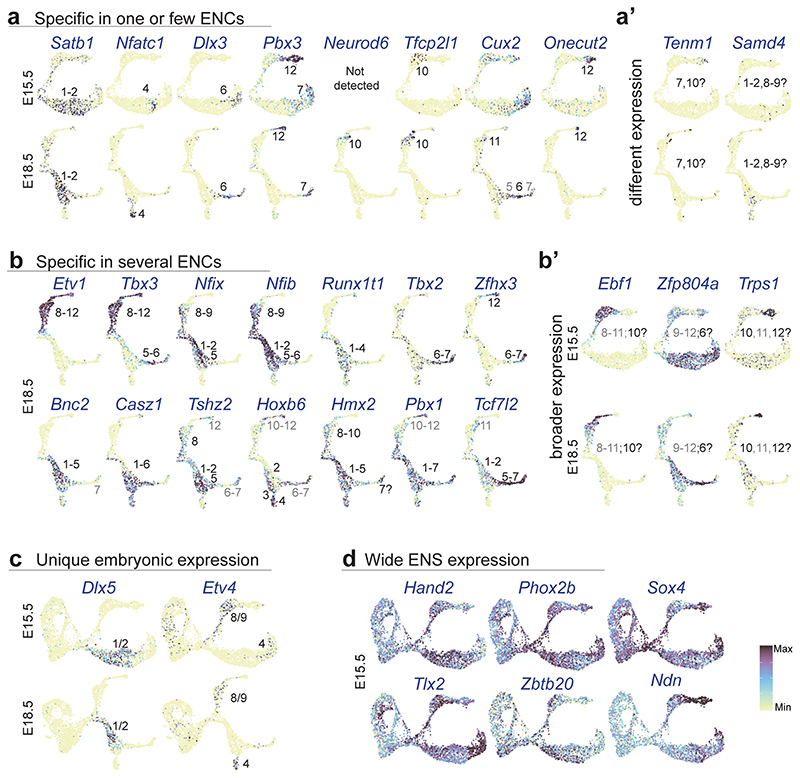
Autonomous regulation of the intestine requires the combined activity of functionally distinct neurons of the enteric nervous system (ENS). However, the variety of enteric neuron types and how they emerge during development remain largely unknown. Here, we define a molecular taxonomy of 12 enteric neuron classes within the myenteric plexus of the mouse small intestine using single-cell RNA sequencing. We present cell-cell communication features and histochemical markers for motor neurons, sensory neurons and interneurons, together with transgenic tools for class-specific targeting. Transcriptome analysis of the embryonic ENS uncovers a novel principle of neuronal diversification, where two neuron classes arise through a binary neurogenic branching and all other identities emerge through subsequent postmitotic differentiation. We identify generic and class-specific transcriptional regulators and functionally connect Pbx3 to a postmitotic fate transition. Our results offer a conceptual and molecular resource for dissecting ENS circuits and predicting key regulators for directed differentiation of distinct enteric neuron classes.


Conflict of interest statement

Competing Interests Statement

The authors disclose no conflicts.

Figures

Figure 1
Figure 1. Molecular definition of 12 Enteric Neuron Classes in the mouse small intestine myenteric plexus.
a) Peels of the myenteric plexus from Baf53b-Cre;R26R-Tomato mice at postnatal day (P)26, showing Tomato (TOM, red) expression in enteric neurons (HUC/D+, green) but not in enteric glia (SOX2+, blue). b) Graph showing the average percentage of HUC/D+ cells expressing TOM within the duodenum (2138 cells), jejunum (2791 cells) and ileum (3180 cells); n=4 mice at P24-26. TOM was not detected in any SOX2/10+ cells (1848 cells; n= 3 mice at P24-26; data not in graph). c) Schematic drawing of experimental procedure indicating the dissection plane to retrieve myenteric plexus of small intestine, flow sorting and single cell RNA-sequencing. d) UMAP representation of sequenced cells with total UMI counts > 600, annotated by probabilistic cell type assignment. e) Comparison of the proportion of major cell types in current single-cell dataset (postnatal day P(21)) and our published dataset from Wnt1-Cre;R26R-Tomato mice (P21,23). f) Unsupervised clustering of enteric neurons, color-coded by enteric neuron classes (ENC)1-12 and represented on UMAP. g) Violin plots representing the expression (log-scale) of key genes among ENCs, including new class-specific marker genes and neurotransmitter/neuropeptide genes. Grey boxes indicate genes whose expression were confirmed by immunohistochemistry (see Fig. 3). Expression of selected markers genes are also represented on UMAPs (Extended Data Fig. 2). h) Probabilistic neuron subtype assignment based on literacy-curated functional type markers represented on UMAP. i) Proportion of learned functional neuron subtypes in each ENC. j) Schematic drawing indicating proposed functional assignment and selected combinatorial marker genes for each ENC. Color channels were individually adjusted in (a). ENC: Enteric Neuron Class; FC: Fold Change; MN: Motor neuron; IN: Interneuron; UMI: Unique Molecular Identifiers; UMAP: Uniform Manifold Approximation and Projection
Figure 2
Figure 2. Gene categories conferring functional characteristics in Enteric Neuron Classes.
a-d) Dot plots showing differentially expressed genes categorized as signaling molecules, ion channels, adhesion molecules and transcription factors. Color scale represents z-score and dot size represent percentage of cells with non-zero expression within a given class. See Supplementary Fig. 2 for dot plots of all enriched gene members within these gene categories. Green boxes in (d) highlight Bnc2 and Etv1 whose expression broadly span class 1-7 and 8-12, respectively. e) Bnc2 and Etv1 expression in individual cells depicted on UMAP. Color map represents scaled expression of Bnc2 (red), Etv1 (blue), co-expressed (pink) and non-expressing (grey). f) Pie chart showing the proportion of different categories of gene families with mean AUROC > 0,75. g) Selected top scoring HGNC gene families ordered by mean AUROC. Square colors indicate gene family categories. See Supplementary Table 2 for the full list of the gene families. Top-scoring gene families corresponded to 69% of gene families previously shown to define diversity amongst cortical inhibitory neurons. h) Dot plot showing differentially expressed genes within two gene families categorized to membrane trafficking (see also Supplementary Fig. 2f). AUROC: area under the receiver operator characteristic curve; ENC: Enteric Neuron Class; HGNC: HUGO Gene Nomenclature Committee; UMAP: Uniform Manifold Approximation and Projection
Figure 3
Figure 3. Immunohistochemical validation of marker genes for Enteric Neuron Classes.
Immunohistochemical localisation of selected key marker proteins of ENC1-12 in the myenteric plexus of small intestine. Images for CCK, VGLUT2 and CGRP were obtained from colchicine treated tissues where proteins are concentrated to neuron bodies. Arrowheads indicate co-expression of proteins. Stars indicate NOS1+ neurons lacking NPY expression (ENC9). Schematic cell drawings to the left indicate positive markers tested. Pictures show either myenteric peel preparations or transverse sections at P21-P90. See Extended Data Fig. 3 for negative marker genes and summary of all validated marker genes. See also Extended Data Fig. 4 for schematic tables summarising gene expression. Color channels were individually adjusted. Scale bars indicate 20μm. CALB: Calbindin; CALR: Calretinin; CCK: Cholecystokinin; CGRP: Calcitonin Gene Related Peptide; DBH: Dopamine Beta Hydroxylase; ENK: Enkephalin; GAD2: Glutamic Acid Decarboxylase 2; GAL: Galanin; HUC/D: Elav-Like Protein 3/4; NF-M: Neurofilament M; NMU: Neuromedin U; NOS1; Nitric Oxide Synthase 1; NPY: Neuropeptide Y; NTNG1: Netrin G1; RPRML: Reprimo-Like; SOM: Somatostatin; SP: Substance P; TH: Tyrosine Hydroxylase; VGLUT2: Vesicular Glutamate Transporter 2
Figure 4
Figure 4. Assessment of IPAN characteristics in ENC6, 7 and 12.
a-c) Immunohistochemical detection of IPAN markers in ENC6, 7 and 12. d) Graph showing the proportions of cells among ENC6, 7 and 12 expressing IPAN markers. Each dot indicates one animal (n= 3-6). NF-M was detected in 63,6±5,43% of ENC6 (1326 cells), 82,5±7,42% of ENC7 (903 cells) and 100% of ENC12 neurons. CALB was found in 2,3±2,96% of ENC6 (1999 cells) and 14,9±4,76% of ENC7 (1588 cells) neurons and considered a defining marker of ENC12. Bar graphs show mean SD. We did not attempt to quanitify CGRP as faithful detection required colchicine treatment, compromising other marker expression. e-g) Representative examples of ENC6, 7 and 12 cell morphologies in Nmu-Cre;R26RTomato, Cck-IRES-Cre;AAV-DIO-Eyfp/Ruby3 mice and wildtype mice labelled with NTNG1/CALB, respectively. See Extended Data Fig. 6 for more examples. h) Quantification of neuron sizes in morphological groups of ENC6, 7 and 12. Each circle represents one cell. Box-and-whisker plots indicate max-min (whiskers), 25-75 percentile (boxes) with median as a centre line. Two-sided Student’s t-test was used for statistical analysis. ****p <0.0001. i) Quantification of proportions of different morphological types among ENC6, 7, and 12. Number of cells analysed (each from 2 animals): 689 ENC6 neurons; 440 ENC7 neurons; 321 ENC12 neurons. j-l) Cell bodies and projections originating from ENC6,7 and 12 are visible in the myenteric plexus plane. m-o) Immunohistochemical analysis in the circular muscle layer showing clear labelling of axons (PGP9.5+) and ICCs (ANO1+) but absence of ENC6, 7 and 12 axons. p) Abundance of motor neuron projections (NOS1+, ENK+ or CALR+) in the circular muscle layer. q-s) Transverse sections showing the direction of projections originating from NMU+, CCK+ and NTNG1/CALB neurons. Many NMU+ axons (but not CCK+ or NTNG1/CALB) were found to cross the circular muscle layer and project down into submucosa and villi. Stars indicate positive axons and dotted stripes demarcates the submucosal layer. Color channels were individually adjusted. Pictures show either myenteric peel preparations or transverse sections at P21-P90. Scale bars indicate 20μm in a-g, and 50μm in j-s. ANO1: Anoctamin 1; CALB: Calbindin; CALR: Calretinin; CCK: Cholecystokinin; CGRP: Calcitonin Gene Related Peptide; EYFP: Enhanced Yellow Fluorescent Protein; ENK: Enkephalin; HUC/D: ELAV-like Protein 3/4; ICC: Interstitial Cell of Cajal; NF-M: Neurofilament M; NMU: Neuromedin U; NOS1: Nitric Oxide Synthase 1; NTNG1: Netrin G1; PGP9.5: Neuron Cytoplasmic Protein 9.5; TOM: tdTomato, DAPI: 4′,6-diamidino-2-phenylindole
Figure 5
Figure 5. Single cell transcriptome analysis of the developing ENS reveals transcriptional programs of generic cell states.
UMAP of E15.5 (a) and E18.5 (b) ENS scRNA-seq datasets displaying generic states of the developing ENS. c) Complementary expression of Sox10 and Elavl4 reveals progenitor/glia cells versus neuronal populations in UMAP. Color map represents scaled expression of Sox10 (red), Elavl4 (blue), co-expressed (pink) and non-expressing (grey). d) Cell cycle assignment mapped onto UMAP at E15.5. e) RNA velocity analysis on UMAP at E15.5 suggesting the rate (indicated by arrow length) and direction (indicated by arrow direction) of cell differentiation. f-i) Enriched genes organized into categories, with likely functions in stem cell maintenance (E15.5; f), neurogenesis (E15.5; g), neuron differentiation (E15.5; h) and glial differentiation (E18.5; i) plotted on UMAPs. Top of panel displays UMAPs with corresponding gene patterns (GP15#1-3). Vertically written genes are displayed as UMAP for each category, while more genes with similar expression patterns are listed to the right of the UMAP. All transcription factors are displayed as Feature plots in Extended Data Fig. 9. See Supplementary Fig. 4 and Supplementary Table 4 for heat maps and lists of enriched genes, and Supplementary Table 5 for GP15#1-3 indicated in (f-h). Color bar indicates 0-90th percentile expression level. UMAP: Uniform Manifold Approximation and Projection; ENC: Enteric Neuron Class; GP15: Gene Pattern at E15.5.
Figure 6
Figure 6. ENC identities emerge through a binary neurogenic branching followed by post-mitotic neuronal diversification.
a,b) UMAP of E15.5 and 18.5 data sets with identity transfer of ENC1-12 and ‘enteric glia’. Threshold for maximum prediction score was set to > 0.5. Small grey dots indicate cells with no identity transfer. Most progenitor cells mapped to enteric glia due to their overall similar gene expression. c) Individual prediction scores of ENC8 and ENC1 coincide with emergence of BranchA and B. d) Individual prediction score of late-developing ENCs. See Supplementary Fig. 5 for prediction score of all individual ENCs mapped on UMAP. e) ENC1-12 juvenile marker genes displayed on E15.5 and E18.5 Feature plots validate ENC assignments. f) Transcription factors defining early binary branching and emerging ENCs on summary UMAP and Feature plots. See Extended Data Fig. 10 for more transcription factors on Feature plots. Color bar indicates 0-90th percentile expression level. g) PAGA graphs on UMAPs of E15.5 and E18.5 ENS corresponding to the differentiation of ENC8-12 (BranchA), ENC1-4 (BranchB1) and ENC1-3;6-7 (BranchB2). Weighted edges represent degree of significant connectivity between partitions. Size of node depicts number of cells in the corresponding cluster. Coloring is arbitrary, but matched between stages when possible. See Extended Data Fig. 7e and f for the corresponding clusters represented on UMAP. h) Heatmaps organized by diffusion pseudotime indicating gradual gene expression changes in PAGA paths. BranchA is shown at E15.5, while BranchB1, B2 are shown at E18.5 when clusters corresponding to ENC4, 6 and 7 are more distinct. Several more marker genes of juvenile ENCs picked from Supplementary Table 1 are shown: Ass1 and Gng8 (ENC8/9); Gna14 (ENC12); Nxph4 (ENC2/3, but not ENC4); Prkcb (ENC2/3/4, but not ENC6/7) Tmeff2 and Ntrk3 (ENC6/7), Cbln2 (ENC6) and Mgat4c/Kcna5 (ENC7). UMAP: Uniform Manifold Approximation and Projection; ENC: Enteric Neuron Class; PAGA: Partition-based graph abstraction; iMN: inhibitory motor neuron; eMN: excitatory motor neuron. IPAN: Intrinsic Primary Afferent Neuron; IN: Interneuron.
Figure 7
Figure 7. Loss of PBX3 expression impairs the ENC8/9 to ENC12 transition.
a) Feature plots showing the expression profile change in BranchA (Etv1+) at E15.5. Dotted line demarcates the approximate border between ENC8/9 and ENC12 and coincide with onset of Pbx3 expression. b) Graph showing that the ratio of SOX10+ cells that incorporated EdU after a 90 min pulse injection is similar in Pbx3-/- mutants and wt controls (set to 1) at E15.5. n = 4 Pbx3-/- mutants vs wt controls animal pairs. c) Graph showing an unchanged ratio of HUC/D+ over SOX10+ cells in Pbx3-/- mutants compared with wt controls (set to 1) at E15.5 and E18.5. n = 4-5 animal pairs. d) Graph showing the ratio between the percentages of neurons (HUC/D) expressing different neurotransmitters/peptides in Pbx3-/- mutant and control (set to 1). Two-sided Student’s Paired t-test was used for statistical analysis. n= 5-6 animal pairs. *p <0.05; bar graphs show mean SD. CALB: p=0,015; NOS1: p=0,013; GAL: p=0,038; VIP: p=0,02. The absolute percentages were: NOS1: Wt: 34,75 ± 5,26%; Mutant: 44,56 ± 7,69%; GAL: Wt: 13,40 ± 2,10%; Mutant: 17,85 ± 1,32%; VIP: Wt: 12,28 ± 4,20%; Mutant: 14,48 ± 4,43%; CALB: Wt: 5,95 ± 1,16%; Mutant: 3,4 ± 1,65%. e) Representative pictures of the small intestine at E18.5 in wt and Pbx3-/- embryos showing increased ratios of neurons expressing NOS1, GAL and VIP and decreased ratio of neurons expressing CALB. f) Schematic drawing indicating the increased number of presumed ENC8/9 at the expense of ENC12 neurons in the ENS of Pbx3-/- mutant mice compared to control. (d). Color channels were individually adjusted in (e); wt: wildtype; EdU: 5-ethynyl-2 deoxyuridine; HUC/D: Elav-Like Protein 3/4; GAL: Galanin: NOS1: Nitric Oxide Synthetase 1; CALB, Calb1: Calbindin; VIP: Vasoactive Intestinal Peptide; ENC: Enteric Neuron Class.
Figure 8
Figure 8. Schematic representation of the major principle of neuronal diversification in the developing CNS versus ENS.
a) Progenitor cells within the neural tube are patterned according to their position within the coordinates of morphogenetic cues. The transcription factor codes (depicted by different colors) of each progenitor is decoded into different neuron class identities at neurogenesis. Further maturation leads to neuronal heterogeneity within each major neuron class. Temporal specification mechanisms (important in telencephalon and ventral myelencephalon) are not accounted for here. b) In contrast to progenitors within the neural tube, ENS progenitor cells are migratory and therefore lack distinct positional identities. A binary heterogeneity is apparent in neuroblasts undergoing their last cell cycle, resulting in post-mitotic neurons with traits of ENC1 or ENC8. Immature neurons either differentiate into these prototypic classes, or differentiate further in a gradual diversification process where the initial features are downregulated and replaced by other transcriptional programs generating ENC2-7 and ENC9-12. Picture depicts the plausible branching process, but future interrogation is needed to resolve the trajectory of each ENC in detail. CNS: Central Nervous System; ENS: Enteric Nervous System; ENC: Enteric Neuron Class.
Extended Data Fig. 1
Extended Data Fig. 1. Supportive Data related to Figure 1d-g.
a) Frequency distribution of the number of UMIs, detected genes and percent of mitochondrial genes per cell. Orange bars indicate proportion of cells passing the thresholding for each parameter. b) Box plots showing number of UMIs, detected genes and percent of mitochondrial genes per cell for each of the ENCs. Box-and-whisker plots indicate max-min (whiskers), 25-75 percentile (boxes) with median as a centre line. Points indicate outliers. c) UMAP depicting inferred female (Xist) and male (Eif2s3y, Ddx3y, Kdm5) cells. Pie-chart showing proportions of male and female cells (2:3 ratio). d) Bar-graph showing fraction of male and female cells in each ENC after normalized by total number of cells from each sex and scaled to 1. e) Label transfer relationship between previously proposed enteric neuron types (ENT)1-9 in Zeisel et al., 201818 and ENC1-12 presented in this study. Notably, ENC5 (Sst) and ENC11 (Npy/Th/Dbh) represent new clusters. ENT-clusters representing plausible excitatory (ENT4-6) and inhibitory (ENT2,3) motor neurons were not retained, but distributed into ENC1-4 and ENC8-9, respectively. UMI: Unique Molecular Identifier; ENT: Enteric Neuron Type; ENC: Enteric Neuron Class; UMAP: Uniform Manifold Approximation and Projection.
Extended Data Fig. 2
Extended Data Fig. 2. Supportive data related to Figure 1h-j.
a) Feature plots related to Tac1+ clusters (ENC1-4). A gene set including Calb2 and stronger Ndufa4l2 demarcated ENC1-2 from ENC3-4, while Gda and Penk expression discriminated ENC2-4 from ENC1. ENC4 resembled ENC3, but displayed a unique expression of Fucosyltransferase 9 (Fut9) and the transcription factor Nfatc1. b) Feature plots related to Rprml+ clusters (ENC8-11). c) Heatmap representing CellAssign score for each cell (columns) to each functional type (rows). d) Rare cells assigned with maximum likelihood to interneuron 3 (IN_3, serotonin-producing), presented on UMAP. e) Feature plots displaying expression of genes correlated to serotonin production (Ddc) and re-uptake (Slc6a4) in ENC12.
Extended Data Fig. 3
Extended Data Fig. 3. Negative markers for ENC1-12, summary table of validated ENC markers and ENC proportions across the small intestine.
a-o) Immunohistochemical validation of negative marker proteins. Pictures show either myenteric peel preparations or transverse sections at P21-P90. white arrow: positive marker; yellow arrow: negative marker. Scale bars indicate 20mm. p) Table summarizing ENC markers verified by immunohistochemistry (unique markers in bold) q) Graphs indicating proportions of ENCs at week 9-12 (n=3-4 mice) using HUC/D or PGP9.5 for total neuron counts. ENC1-2 was calculated by subtracting CALR+ ENC6, ENC5 and ENC11 percentages from the average total CALR+ neurons. Note the much higher proportion of ENC6 in tissue, than in scRNA-seq data, reflecting the difficulties in isolating big size neurons from tissue. Graph with all ENCs in ileum was normalized to 100% (absolute value 102,6%). Data are presented as mean values ± SD.
Extended Data Fig. 4
Extended Data Fig. 4. Schematic tables summarizing marker and ligand/receptor gene expression in each ENC.
We combined information gained from RNA-sequencing (Fig. 1 and Supplementary Fig. 2), immunohistochemical analysis (Fig. 3) and transgenic mice (Fig. 4) to make a reasonable representation of gene expression patterns of a) marker genes b) ligand/receptors in the ENCs. (ligand): refers to genes required for the production of a ligand, including enzymes. ENC: Enteric Neuron Class
Extended Data Fig. 5
Extended Data Fig. 5. Validation of Cre mouse lines for the investigation of ENC6 and ENC7.
a) Myenteric plexus peel from Nmu-Cre;R26R-Tom mouse showing TOM in HUC/D+ neurons (stars) and its exclusion from enteric glia (SOX2+). b) Myenteric plexus peel from Cck-IRES-Cre;R26-Tom mouse showing TOM in both neurons (stars) and enteric glia (stars). c) Myenteric plexus peel of Cck-IRES-Cre mouse injected with AAV-DIO-Ruby3 showing RUBY3 only in neurons and not in glia. d) Transverse sections showing that Nmu and Cck RNA expression correlate with reporter+ neurons in Nmu-Cre;R26R-Tom and Cck-IRES-Cre; AAV-DIO-EYFP/Ruby3 animals. e) Graph showing the percentage of reporter+ neurons expressing the reciprocal RNA. Data are presented as mean values ± SD. A total of 638 reporter+ neurons were investigated in three Nmu-Cre;R26R-Tom mice, and 71 reporter+ neurons were investigated in three Cck-IRES-Cre;AAV-DIO-EYFP/Ruby3 mice. TOM: dtTomato. Scale bars indicate 50μm.
Extended Data Fig. 6
Extended Data Fig. 6. Morphological characterization of ENC6, 7, 12 and 5-HT+ ENC12.
Related to Fig. 4e-g. A) Representative examples of each morphological type found within ENC6, 7 and 12 and their size. B) Representative examples of each morphological type and their relative proportion (n=90 neurons from 5 animals) within jejunum and ileum of 5-HT+ ENC12. Scale bars indicates 20μm. Data are presented as mean values ± SD.
Extended Data Fig. 7
Extended Data Fig. 7. Supportive data related to Figure 5a,b
a-b) Frequency distribution of the number of UMIs, detected genes and percent of mitochondrial genes per cell in E15.5 (a) and E18.5 (b) datasets. Orange bars represent cells that pass the thresholding for each parameter. c-d) Boxplots showing normalized expression (log scale) of known cell state genes: Sox10 (progenitor), Ascl1 (neuroblast), Elavl4 (enteric neuron), Plp1 (Enteric glia) and Dhh (SCP), grouped by Louvian clusters for E15.5 (c) and E18.5 (d). Box-and-whisker plots indicate max-min (whiskers), 25-75 percentile (boxes) with median as a centre line. Points indicate outliers. e-f) Refined clusters on UMAP for E15.5 (e) and E18.5 (f). Clusters in the same state were merged to obtain the generic ENS state clusters shown in Figure 5a,b. UMI: Unique Molecular Identifier; SCP: Schwann cell precursor; E: Embryonic day; UMAP: Uniform Manifold Approximation and Projection; MT: Mitochondrial
Extended Data Fig. 8
Extended Data Fig. 8. Feature plots displaying expression of Notch signaling genes at E18.5.
Related to Figure 5. a) Ligands; note the predominant expression of Dll1 and Dll3 in neuroblasts b) Receptors; note the predominant expression of Notch1,2 in progenitors. c) Downstream transcription factor; note the enriched expression of Hes6 in neuroblasts, Hes1 in progenitors and Hes5, Heyl and Hey2 in enteric glia. d) Regulator of activity; note the enriched expression of Mfng in neuroblasts and Lfng in progenitors. Color bar indicate expression level with maximum cut off at the 90th percentile.
Extended Data Fig. 9
Extended Data Fig. 9. Feature plots displaying transcription factors associated with generic cell states of the ENS at E15.5.
Related to Figure 5f-h. a) progenitors, b) neuroblasts and c) neurons. Color bar indicate expression level with maximum cut-off at the 90th percentile.
Extended Data Fig. 10
Extended Data Fig. 10. Supportive data related to Figure 6f.
a) TFs expressed in one or few ENCs that correlated well with juvenile expression (exception in a’). b) TFs with broad ENC-specific expression that correlated well with juvenile expression (exception in b’). c) TFs only expressed at embryonic stages, and not maintained in juvenile ENCs. d) TFs with wide expression, including bona fide ENS markers Hand2 and Phox2b. See Supplementary Figure 2c to compare with the gene expressions in juvenile ENCs. Color bar indicate expression level with maximum cut off at the 90th percentile.

Comment in

References

    1. Furness JB. The enteric nervous system and neurogastroenterology. Nat Rev Gastroenterol Hepatol. 2012;9:286–294. - PubMed
    1. Veiga-Fernandes H, Pachnis V. Neuroimmune regulation during intestinal development and homeostasis. Nature Immunology. 2017;18:116–122. - PubMed
    1. Furness JB. Types of neurons in the enteric nervous system. J Auton Nerv Syst. 2000;81:87–96. - PubMed
    1. Sang Q, Young HM. Chemical coding of neurons in the myenteric plexus and external muscle of the small and large intestine of the mouse. Cell Tissue Res. 1996;284:39–53. - PubMed
    1. Sang Q, Williamson S, Young HM. Projections of chemically identified myenteric neurons of the small and large intestine of the mouse. J Anat. 1997;190:209–222. - PMC - PubMed

Publication types

MeSH terms