Review
. 2021 Apr;93(4):1950-1966.
doi: 10.1002/jmv.26707. Epub 2020 Dec 17.

Hidden in plain sight: The effects of BCG vaccination in the COVID-19 pandemic

Affiliations
Review

Hidden in plain sight: The effects of BCG vaccination in the COVID-19 pandemic

Eman A Toraih et al. J Med Virol. 2021 Apr.

Abstract

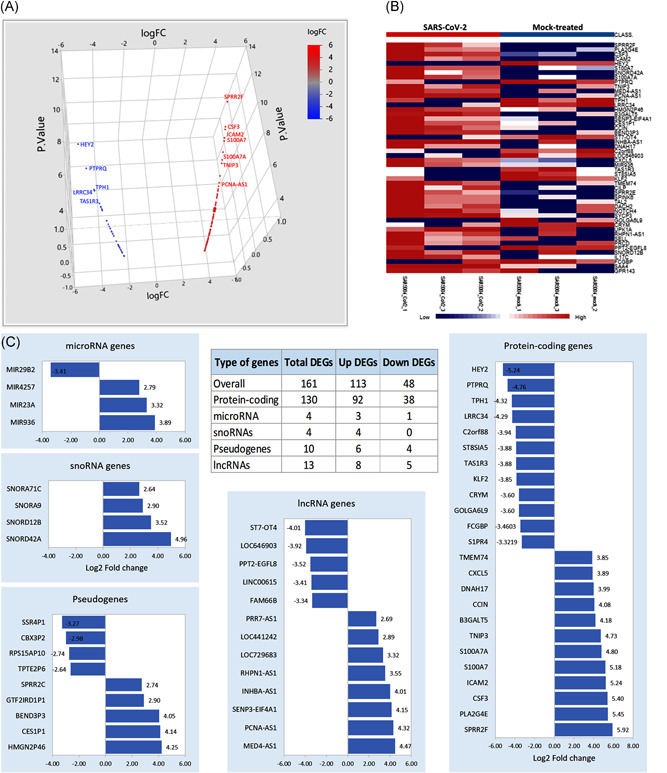
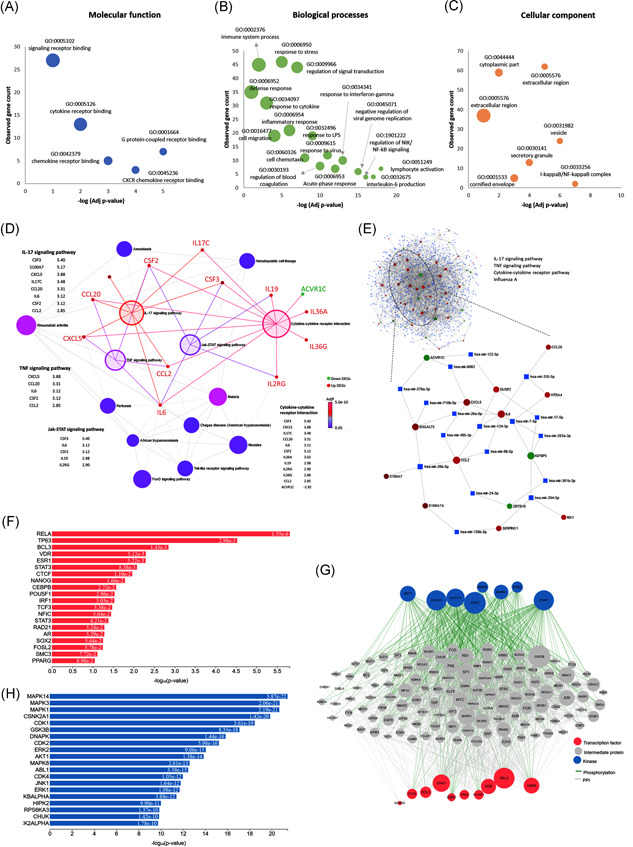
To investigate the relationship between Bacille Calmette-Guérin (BCG) vaccination and SARS-CoV-2 by a bioinformatics approach, two datasets for the SARS-CoV-2 infection group and BCG-vaccinated group were downloaded. Differentially Expressed Genes were identified. Gene ontology and pathways were functionally enriched, and networking was constructed in NetworkAnalyst. Lastly, the correlation between post-BCG vaccination and COVID-19 transcriptome signatures was established. A total of 161 DEGs (113 upregulated DEGs and 48 downregulated genes) were identified in the SARS-CoV-2 group. In the pathway enrichment analysis, a cross-reference of upregulated Kyoto Encyclopedia of Genes and Genomes pathways in SARS-CoV-2 with downregulated counterparts in the BCG-vaccinated group, resulted in the intersection of 45 common pathways, accounting for 86.5% of SARS-CoV-2 upregulated pathways. Of these intersecting pathways, a vast majority were immune and inflammatory pathways with top significance in interleukin-17, tumor necrosis factor, NOD-like receptors, and nuclear factor-κB signaling pathways. Given the inverse relationship of the specific differentially expressed gene pathways highlighted in our results, the BCG-vaccine may play a protective role against COVID-19 by mounting a nonspecific immunological response and further investigation of this relationship is warranted.

Keywords: BCG vaccine; COVID-19; differentially expressed genes; in silico analysis; networking; pathways.


Conflict of interest statement

The authors declare that there are no conflict of interests.

Figures

Figure 1
Figure 1
Functional annotations of differentially expressed genes (DEGs). (A) Three‐dimensional scatter plot for the upregulated (red) and downregulated (blue) DEGs. (B) Gene set enrichment analysis showing the top 100 variable genes between the six samples. (C) The numbers of upregulated and downregulated DEGs. The relative expression level of DEGs is stratified by the type of genes
Figure 2
Figure 2
Functional enrichment analysis and gene regulatory networks. (A) Gene ontology analysis for molecular function, (B) for biological processes, (C) for cellular components, (D) The Kyoto Encyclopedia of Genes and Genomes (KEGG) pathway enrichment analysis. Nodes represented pathways, with color based on its significance. Four enlarged highlighted nodes represented the most significant pathways. Bipartite gene networks with these nodes showed the association with upregulated (red) and downregulated (green) genes. (E) Gene–microRNA interaction. The data source for interaction pairs: TarBase and miRTarBase. Red and green circles represented upregulated and downregulated differentially expressed genes, respectively. Blue squares represented the microRNAs. The full network is shown with extracted nodes (ellipse) for four significant KEGG pathways. (F) Transcription factor enrichment analysis showing putative transcription factors that most likely to regulate the differences in gene expression. (G) Upstream regulatory network that connects the enriched transcription factors to kinases through known protein–protein interactions. (H) Kinase enrichment analysis. Candidate enriched protein kinases that most likely regulate the formation of the identified transcriptional complexes. They are ranked based on the overlap between known kinase‐substrate phosphorylation interactions and the proteins in the protein–protein interaction subnetwork created in (G)
Figure 3
Figure 3
Differentially expressed genes (DEGs) and functional enrichment analysis following Bacille Calmette‐Guérin (BCG) vaccination. (A) Principal component analysis after normalization, showing a cluster of samples postvaccination on Days 14 through 84. (B) Clustergram showing the hierarchical clustering of the top 2500 variable genes among the five groups. (C) Volcano plot representing log2‐fold change and −log10 (adjusted p‐value). (D) Number of DEGs at each stage postvaccination (Days 14 vs. 0, 28 vs. 0, 56 vs. 0, and 84 vs. 0) (E, F) Venn diagram showing the intersection between upregulated and downregulated DEGs at a different stage. The numbers of upregulated and downregulated DEGs are demonstrated in blue and red boxes, respectively. (G) Protein–protein interaction (PPI) network for DEGs following BCG vaccination. String interactome for PPI showing upregulated (red nodes) and downregulated (green nodes) genes. (H) A cluster of inhibited Kyoto Encyclopedia of Genes and Genomes pathways. Circled in blue the gene list of the selected pathways. (I) Top significant pathways inhibited following BCG vaccination (enriched in the cluster)
Figure 4
Figure 4
Common pathways between SARS‐CoV‐2 and BCG vaccination experiments. (A) The intersection between KEGG pathways of SARS‐CoV‐2 infected cells and BCG vaccination. (B) The expression level of some hub genes following BCG vaccination showing downregulation postvaccination as an example of the reversed direction of expression. (C) Displays 45 upregulated KEGG signaling pathways in the SARS‐CoV‐2 cell line which are downregulated following BCG vaccination. Bars represent the observed gene count for each pathway. The degree of color represents the degree of significance (the more intensity, the higher significance). KEGG signaling pathways are categorized according to the functional hierarchical classification system. (D) The expression intensity of genes in the tuberculosis KEGG pathway. Colored by the log fold change of DEGs in (1) SARS‐CoV‐2 infection compared to mock‐treated cells and (2) following BCG vaccination. BCG, Bacille Calmette‐Guérin, KEGG, Kyoto Encyclopedia of Genes and Genomes

References

    1. Kissler SM, Tedijanto C, Goldstein E, Grad Y, Lipsitch M. Projecting the transmission dynamics of SARS‐CoV‐2 through the postpandemic period. Science. 2020;5793:1‐13. - PMC - PubMed
    1. Chinazzi M, Davis JT, Ajelli M, et al. The effect of travel restrictions on the spread of the 2019 novel coronavirus (COVID‐19) outbreak. Science. 2020;368:395‐400. 10.1126/science.aba9757 - DOI - PMC - PubMed
    1. Kucharski AJ, Russell TW, Diamond C, et al. Early dynamics of transmission and control of COVID‐19: a mathematical modelling study. Lancet Infect Dis. 2020;20:553‐558. 10.1016/S1473-3099(20)30144-4 - DOI - PMC - PubMed
    1. Harbert R, Cunningham SW, Tessler M. Spatial modeling could not differentiate early SARS‐CoV‐2 cases from the distribution of humans on the basis of climate in the United States. PeerJ. (2020);8:e10140. 10.7717/peerj.10140 - DOI - PMC - PubMed
    1. Deshwal VK. COVID 19: A comparative study of Asian, European, American continent. Int J Sci Res Eng Dev. 2020;3:436‐440.